Обсуждение: Speed up Clog Access by increasing CLOG buffers
| Client Count/Patch_ver | 1 | 8 | 16 | 32 | 64 | 128 | 256 |
| HEAD | 911 | 5695 | 9886 | 18028 | 27851 | 28654 | 25714 |
| Patch-1 | 954 | 5568 | 9898 | 18450 | 29313 | 31108 | 28213 |
| Client Count/Patch_ver | 128 | 256 |
| HEAD | 16657 | 10512 |
| Patch-1 | 16694 | 10477 |
Вложения
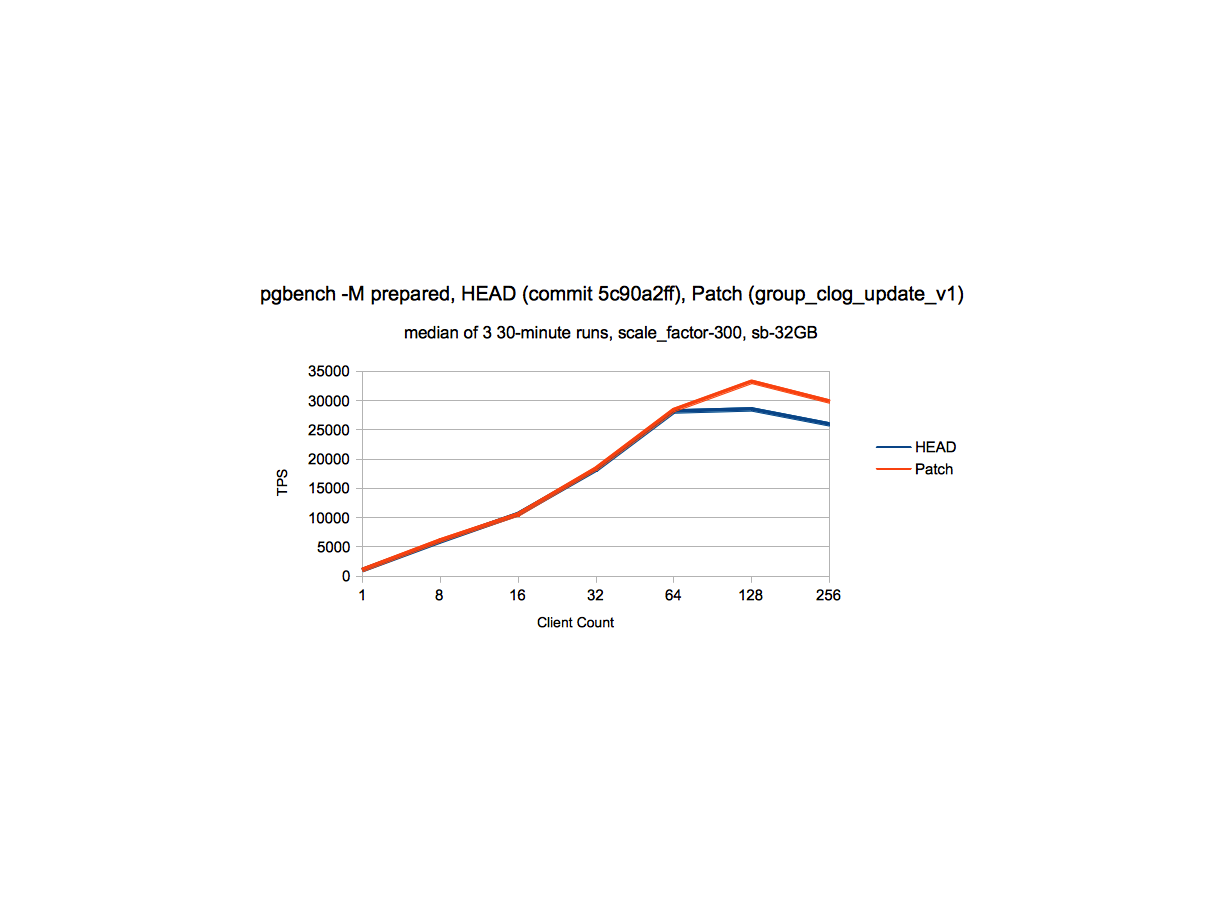
On 2015-09-01 10:19:19 +0530, Amit Kapila wrote:
> pgbench setup
> ------------------------
> scale factor - 300
> Data is on magnetic disk and WAL on ssd.
> pgbench -M prepared tpc-b
>
> HEAD - commit 0e141c0f
> Patch-1 - increase_clog_bufs_v1
>
> Client Count/Patch_ver 1 8 16 32 64 128 256 HEAD 911 5695 9886 18028 27851
> 28654 25714 Patch-1 954 5568 9898 18450 29313 31108 28213
>
>
> This data shows that there is an increase of ~5% at 64 client-count
> and 8~10% at more higher clients without degradation at lower client-
> count. In above data, there is some fluctuation seen at 8-client-count,
> but I attribute that to run-to-run variation, however if anybody has doubts
> I can again re-verify the data at lower client counts.

> Now if we try to further increase the number of CLOG buffers to 128,
> no improvement is seen.
>
> I have also verified that this improvement can be seen only after the
> contention around ProcArrayLock is reduced.  Below is the data with
> Commit before the ProcArrayLock reduction patch.  Setup and test
> is same as mentioned for previous test.

The buffer replacement algorithm for clog is rather stupid - I do wonder
where the cutoff is that it hurts.

Could you perhaps try to create a testcase where xids are accessed that
are so far apart on average that they're unlikely to be in memory? And
then test that across a number of client counts?

There's two reasons that I'd like to see that: First I'd like to avoid
regression, second I'd like to avoid having to bump the maximum number
of buffers by small buffers after every hardware generation...

>  /*
>   * Number of shared CLOG buffers.
>   *
> - * Testing during the PostgreSQL 9.2 development cycle revealed that on a
> + * Testing during the PostgreSQL 9.6 development cycle revealed that on a
>   * large multi-processor system, it was possible to have more CLOG page
> - * requests in flight at one time than the number of CLOG buffers which existed
> - * at that time, which was hardcoded to 8.  Further testing revealed that
> - * performance dropped off with more than 32 CLOG buffers, possibly because
> - * the linear buffer search algorithm doesn't scale well.
> + * requests in flight at one time than the number of CLOG buffers which
> + * existed at that time, which was 32 assuming there are enough shared_buffers.
> + * Further testing revealed that either performance stayed same or dropped off
> + * with more than 64 CLOG buffers, possibly because the linear buffer search
> + * algorithm doesn't scale well or some other locking bottlenecks in the
> + * system mask the improvement.
>   *
> - * Unconditionally increasing the number of CLOG buffers to 32 did not seem
> + * Unconditionally increasing the number of CLOG buffers to 64 did not seem
>   * like a good idea, because it would increase the minimum amount of shared
>   * memory required to start, which could be a problem for people running very
>   * small configurations.  The following formula seems to represent a reasonable
>   * compromise: people with very low values for shared_buffers will get fewer
> - * CLOG buffers as well, and everyone else will get 32.
> + * CLOG buffers as well, and everyone else will get 64.
>   *
>   * It is likely that some further work will be needed here in future releases;
>   * for example, on a 64-core server, the maximum number of CLOG requests that
>   * can be simultaneously in flight will be even larger.  But that will
>   * apparently require more than just changing the formula, so for now we take
> - * the easy way out.
> + * the easy way out.  It could also happen that after removing other locking
> + * bottlenecks, further increase in CLOG buffers can help, but that's not the
> + * case now.
>   */

I think the comment should be more drastically rephrased to not
reference individual versions and numbers.

Greetings,

Andres Freund
Andres Freund wrote:

> The buffer replacement algorithm for clog is rather stupid - I do wonder
> where the cutoff is that it hurts.
>
> Could you perhaps try to create a testcase where xids are accessed that
> are so far apart on average that they're unlikely to be in memory? And
> then test that across a number of client counts?
>
> There's two reasons that I'd like to see that: First I'd like to avoid
> regression, second I'd like to avoid having to bump the maximum number
> of buffers by small buffers after every hardware generation...

I wonder if it would make sense to explore an idea that has been floated
for years now -- to have pg_clog pages be allocated as part of shared
buffers rather than have their own separate pool.  That way, no separate
hardcoded allocation limit is needed.  It's probably pretty tricky to
implement, though :-(

--
Álvaro Herrera                http://www.2ndQuadrant.com/
PostgreSQL Development, 24x7 Support, Remote DBA, Training & Services
Hi,

On 2015-09-07 10:34:10 -0300, Alvaro Herrera wrote:
> I wonder if it would make sense to explore an idea that has been floated
> for years now -- to have pg_clog pages be allocated as part of shared
> buffers rather than have their own separate pool.  That way, no separate
> hardcoded allocation limit is needed.  It's probably pretty tricky to
> implement, though :-(

I still think that'd be a good plan, especially as it'd also let us use
a lot of related infrastructure. I doubt we could just use the standard
cache replacement mechanism though - it's not particularly efficient
either... I also have my doubts that a hash table lookup at every clog
lookup is going to be ok performancewise.

The biggest problem will probably be that the buffer manager is pretty
directly tied to relations and breaking up that bond won't be all that
easy. My guess is that the best bet here is that the easiest way to at
least explore this is to define pg_clog/... as their own tablespaces
(akin to pg_global) and treat the files therein as plain relations.

Greetings,

Andres Freund
Andres Freund wrote:

> On 2015-09-07 10:34:10 -0300, Alvaro Herrera wrote:
> > I wonder if it would make sense to explore an idea that has been floated
> > for years now -- to have pg_clog pages be allocated as part of shared
> > buffers rather than have their own separate pool.  That way, no separate
> > hardcoded allocation limit is needed.  It's probably pretty tricky to
> > implement, though :-(
>
> I still think that'd be a good plan, especially as it'd also let us use
> a lot of related infrastructure. I doubt we could just use the standard
> cache replacement mechanism though - it's not particularly efficient
> either... I also have my doubts that a hash table lookup at every clog
> lookup is going to be ok performancewise.

Yeah.  I guess we'd have to mark buffers as unusable for regular pages
("somehow"), and have a separate lookup mechanism.  As I said, it is
likely to be tricky.

--
Álvaro Herrera                http://www.2ndQuadrant.com/
PostgreSQL Development, 24x7 Support, Remote DBA, Training & Services
>
> Andres Freund wrote:
>
> > The buffer replacement algorithm for clog is rather stupid - I do wonder
> > where the cutoff is that it hurts.
> >
> > Could you perhaps try to create a testcase where xids are accessed that
> > are so far apart on average that they're unlikely to be in memory?
> > There's two reasons that I'd like to see that: First I'd like to avoid
> > regression, second I'd like to avoid having to bump the maximum number
> > of buffers by small buffers after every hardware generation...
>
> I wonder if it would make sense to explore an idea that has been floated
> for years now -- to have pg_clog pages be allocated as part of shared
> buffers rather than have their own separate pool.
On Mon, Sep 7, 2015 at 9:34 AM, Alvaro Herrera <alvherre@2ndquadrant.com> wrote:
> Andres Freund wrote:
>> The buffer replacement algorithm for clog is rather stupid - I do wonder
>> where the cutoff is that it hurts.
>>
>> Could you perhaps try to create a testcase where xids are accessed that
>> are so far apart on average that they're unlikely to be in memory? And
>> then test that across a number of client counts?
>>
>> There's two reasons that I'd like to see that: First I'd like to avoid
>> regression, second I'd like to avoid having to bump the maximum number
>> of buffers by small buffers after every hardware generation...
>
> I wonder if it would make sense to explore an idea that has been floated
> for years now -- to have pg_clog pages be allocated as part of shared
> buffers rather than have their own separate pool.  That way, no separate
> hardcoded allocation limit is needed.  It's probably pretty tricky to
> implement, though :-(

Yeah, I looked at that once and threw my hands up in despair pretty
quickly.  I also considered another idea that looked simpler: instead
of giving every SLRU its own pool of pages, have one pool of pages for
all of them, separate from shared buffers but common to all SLRUs.
That looked easier, but still not easy.

I've also considered trying to replace the entire SLRU system with new
code and throwing away what exists today.  The locking mode is just
really strange compared to what we do elsewhere.  That, too, does not
look all that easy.  :-(

--
Robert Haas
EnterpriseDB: http://www.enterprisedb.com
The Enterprise PostgreSQL Company
>
> On 2015-09-01 10:19:19 +0530, Amit Kapila wrote:
> > pgbench setup
> > ------------------------
> > scale factor - 300
> > Data is on magnetic disk and WAL on ssd.
> > pgbench -M prepared tpc-b
> >
> > HEAD - commit 0e141c0f
> > Patch-1 - increase_clog_bufs_v1
> >
>
> The buffer replacement algorithm for clog is rather stupid - I do wonder
> where the cutoff is that it hurts.
>
> Could you perhaps try to create a testcase where xids are accessed that
> are so far apart on average that they're unlikely to be in memory? And
> then test that across a number of client counts?
>
Okay, I have tried one such test, but what I could come up with is on an
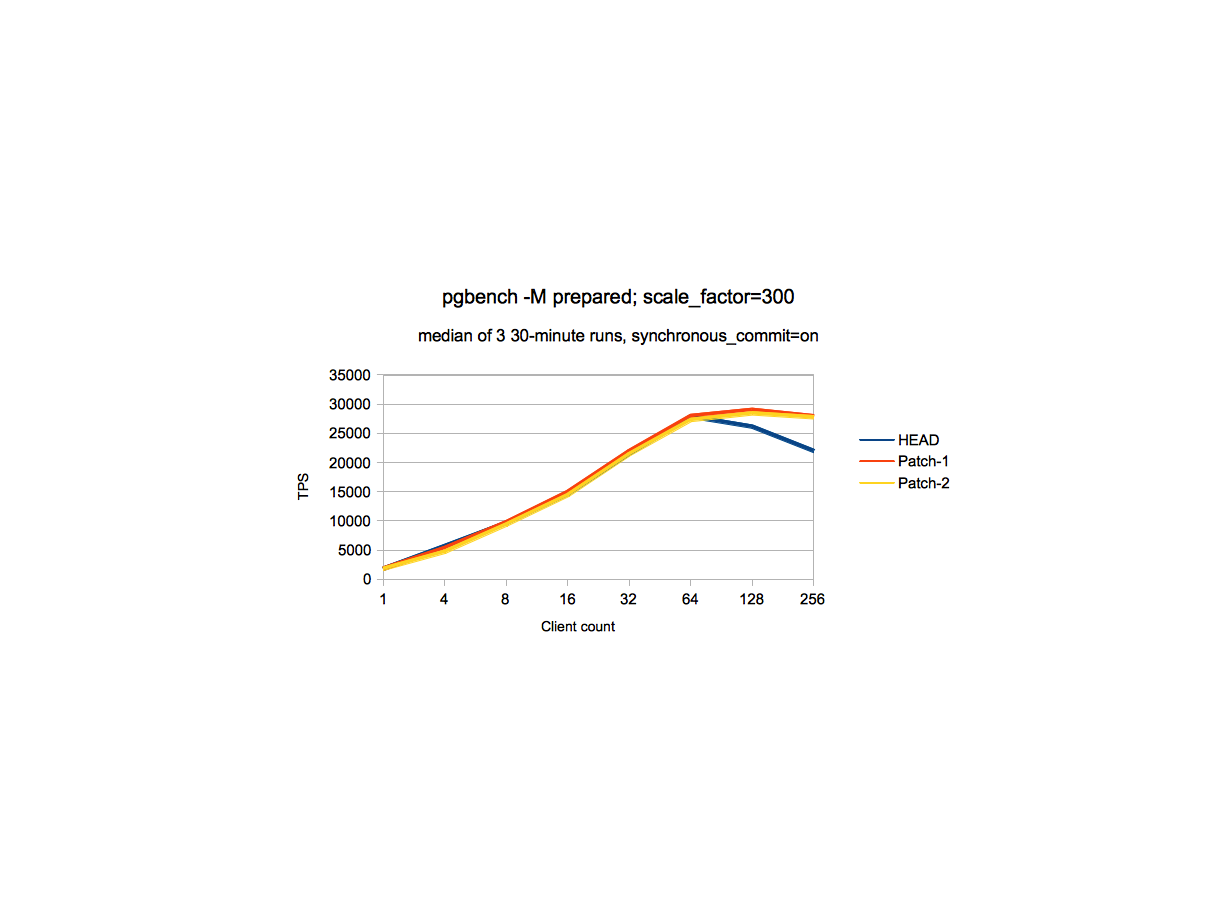
| Client Count/Patch_ver | 1 | 8 | 64 | 128 |
| HEAD | 1395 | 8336 | 37866 | 34463 |
| Patch-1 | 1615 | 8180 | 37799 | 35315 |
| Patch-2 | 1409 | 8219 | 37068 | 34729 |
>
> > /*
> > * Number of shared CLOG buffers.
> > *
>
>
> I think the comment should be more drastically rephrased to not
> reference individual versions and numbers.
>
Вложения
On Fri, Sep 11, 2015 at 10:31 AM, Amit Kapila <amit.kapila16@gmail.com> wrote:
> > Could you perhaps try to create a testcase where xids are accessed that
> > are so far apart on average that they're unlikely to be in memory? And
> > then test that across a number of client counts?
> >
>
> Now about the test, create a table with large number of rows (say 11617457,
> I have tried to create larger, but it was taking too much time (more than a day))
> and have each row with different transaction id.  Now each transaction should
> update rows that are at least 1048576 (number of transactions whose status can
> be held in 32 CLog buffers) distance apart, that way ideally for each update it will
> try to access Clog page that is not in-memory, however as the value to update
> is getting selected randomly and that leads to every 100th access as disk access.

What about just running a regular pgbench test, but hacking the
XID-assignment code so that we increment the XID counter by 100 each
time instead of 1?

--
Robert Haas
EnterpriseDB: http://www.enterprisedb.com
The Enterprise PostgreSQL Company
>
> On Fri, Sep 11, 2015 at 10:31 AM, Amit Kapila <amit.kapila16@gmail.com> wrote:
> > > Could you perhaps try to create a testcase where xids are accessed that
> > > are so far apart on average that they're unlikely to be in memory? And
> > > then test that across a number of client counts?
> > >
> >
> > Now about the test, create a table with large number of rows (say 11617457,
> > I have tried to create larger, but it was taking too much time (more than a day))
> > and have each row with different transaction id. Now each transaction should
> > update rows that are at least 1048576 (number of transactions whose status can
> > be held in 32 CLog buffers) distance apart, that way ideally for each update it will
> > try to access Clog page that is not in-memory, however as the value to update
> > is getting selected randomly and that leads to every 100th access as disk access.
>
> What about just running a regular pgbench test, but hacking the
> XID-assignment code so that we increment the XID counter by 100 each
> time instead of 1?
>
#define CLOG_XACTS_PER_PAGE (BLCKSZ * CLOG_XACTS_PER_BYTE)
On Fri, Sep 11, 2015 at 11:01 PM, Amit Kapila <amit.kapila16@gmail.com> wrote:
> If I am not wrong we need 1048576 number of transactions difference
> for each record to make each CLOG access a disk access, so if we
> increment XID counter by 100, then probably every 10000th (or multiplier
> of 10000) transaction would go for disk access.
>
> The number 1048576 is derived by below calc:
> #define CLOG_XACTS_PER_BYTE 4
> #define CLOG_XACTS_PER_PAGE (BLCKSZ * CLOG_XACTS_PER_BYTE)
>
> Transaction difference required for each transaction to go for disk access:
> CLOG_XACTS_PER_PAGE * num_clog_buffers.
>
> I think reducing to every 100th access for transaction status as disk access
> is sufficient to prove that there is no regression with the patch for the
> screnario
> asked by Andres or do you think it is not?

I have no idea.  I was just suggesting that hacking the server somehow
might be an easier way of creating the scenario Andres was interested
in than the process you described.  But feel free to ignore me, I
haven't taken much time to think about this.

--
Robert Haas
EnterpriseDB: http://www.enterprisedb.com
The Enterprise PostgreSQL Company
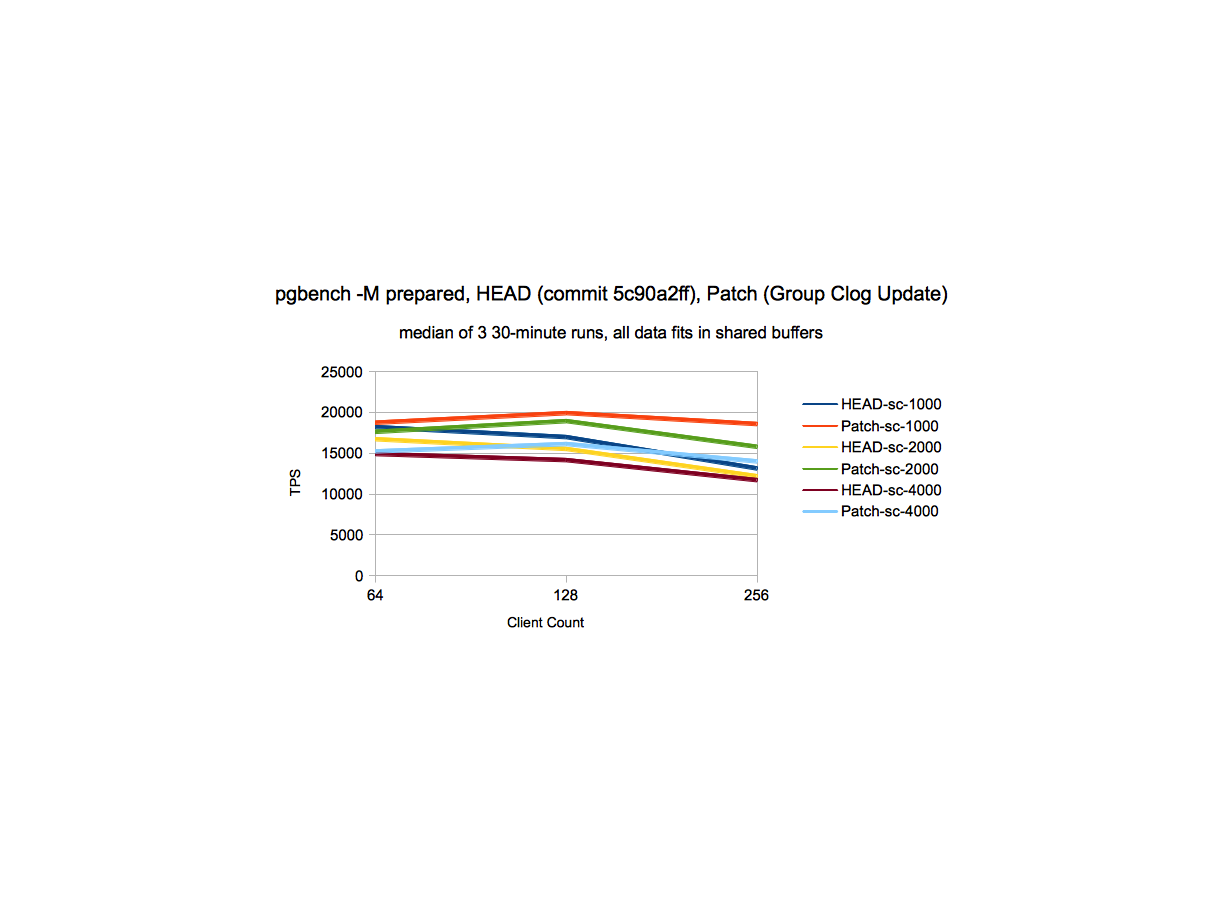
On 09/11/2015 10:31 AM, Amit Kapila wrote:
> Updated comments and the patch (increate_clog_bufs_v2.patch)
> containing the same is attached.
>

I have done various runs on an Intel Xeon 28C/56T w/ 256Gb mem and 2 x
RAID10 SSD (data + xlog) with Min(64,).

Kept the shared_buffers=64GB and effective_cache_size=160GB settings
across all runs, but did runs with both synchronous_commit on and off
and different scale factors for pgbench.

The results are in flux for all client numbers within -2 to +2%
depending on the latency average.

So no real conclusion from here other than the patch doesn't help/hurt
performance on this setup, likely depends on further CLogControlLock
related changes to see real benefit.

Best regards, Jesper
On 09/11/2015 10:31 AM, Amit Kapila wrote:Updated comments and the patch (increate_clog_bufs_v2.patch)
containing the same is attached.
I have done various runs on an Intel Xeon 28C/56T w/ 256Gb mem and 2 x RAID10 SSD (data + xlog) with Min(64,).
On Mon, Aug 31, 2015 at 9:49 PM, Amit Kapila <amit.kapila16@gmail.com> wrote:
> Increasing CLOG buffers to 64 helps in reducing the contention due to second
> reason.  Experiments revealed that increasing CLOG buffers only helps
> once the contention around ProcArrayLock is reduced.

There has been a lot of research on bitmap compression, more or less
for the benefit of bitmap index access methods.

Simple techniques like run length encoding are effective for some
things. If the need to map the bitmap into memory to access the status
of transactions is a concern, there has been work done on that, too.
Byte-aligned bitmap compression is a technique that might offer a good
trade-off between compression clog, and decompression overhead -- I
think that there basically is no decompression overhead, because set
operations can be performed on the "compressed" representation
directly. There are other techniques, too.

Something to consider. There could be multiple benefits to compressing
clog, even beyond simply avoiding managing clog buffers.

--
Peter Geoghegan
On 09/18/2015 11:11 PM, Amit Kapila wrote:
>> I have done various runs on an Intel Xeon 28C/56T w/ 256Gb mem and 2 x
>> RAID10 SSD (data + xlog) with Min(64,).
>>
>>
> The benefit with this patch could be seen at somewhat higher
> client-count as you can see in my initial mail, can you please
> once try with client count > 64?
>

Client count were from 1 to 80.

I did do one run with Min(128,) like you, but didn't see any difference
in the result compared to Min(64,), so focused instead in the
sync_commit on/off testing case.

Best regards, Jesper
On Fri, Sep 11, 2015 at 9:21 PM, Robert Haas <robertmhaas@gmail.com> wrote:
>
> On Fri, Sep 11, 2015 at 10:31 AM, Amit Kapila <amit.kapila16@gmail.com> wrote:
> > > Could you perhaps try to create a testcase where xids are accessed that
> > > are so far apart on average that they're unlikely to be in memory? And
> > > then test that across a number of client counts?
> > >
> >
> > Now about the test, create a table with large number of rows (say 11617457,
> > I have tried to create larger, but it was taking too much time (more than a day))
> > and have each row with different transaction id. Now each transaction should
> > update rows that are at least 1048576 (number of transactions whose status can
> > be held in 32 CLog buffers) distance apart, that way ideally for each update it will
> > try to access Clog page that is not in-memory, however as the value to update
> > is getting selected randomly and that leads to every 100th access as disk access.
>
> What about just running a regular pgbench test, but hacking the
> XID-assignment code so that we increment the XID counter by 100 each
> time instead of 1?
>If I am not wrong we need 1048576 number of transactions differencefor each record to make each CLOG access a disk access, so if weincrement XID counter by 100, then probably every 10000th (or multiplierof 10000) transaction would go for disk access.The number 1048576 is derived by below calc:#define CLOG_XACTS_PER_BYTE 4
#define CLOG_XACTS_PER_PAGE (BLCKSZ * CLOG_XACTS_PER_BYTE)
Transaction difference required for each transaction to go for disk access:CLOG_XACTS_PER_PAGE * num_clog_buffers.
Actually I haven't attached it, because then the commitfest app will list it as the patch needing review, instead I've put it here https://drive.google.com/file/d/0Bzqrh1SO9FcERV9EUThtT3pacmM/view?usp=sharing
I think reducing to every 100th access for transaction status as disk accessis sufficient to prove that there is no regression with the patch for the screnarioasked by Andres or do you think it is not?Now another possibility here could be that we try by commenting out fsyncin CLOG path to see how much it impact the performance of this test andthen for pgbench test. I am not sure there will be any impact because evenevery 100th transaction goes to disk access that is still less as compareWAL fsync which we have to perform for each transaction.
On Fri, Sep 11, 2015 at 8:01 PM, Amit Kapila <amit.kapila16@gmail.com> wrote:If I am not wrong we need 1048576 number of transactions differencefor each record to make each CLOG access a disk access, so if weincrement XID counter by 100, then probably every 10000th (or multiplierof 10000) transaction would go for disk access.The number 1048576 is derived by below calc:#define CLOG_XACTS_PER_BYTE 4
#define CLOG_XACTS_PER_PAGE (BLCKSZ * CLOG_XACTS_PER_BYTE)Transaction difference required for each transaction to go for disk access:CLOG_XACTS_PER_PAGE * num_clog_buffers.That guarantees that every xid occupies its own 32-contiguous-pages chunk of clog.But clog pages are not pulled in and out in 32-page chunks, but one page chunks. So you would only need 32,768 differences to get every real transaction to live on its own clog page, which means every look up of a different real transaction would have to do a page replacement.
(I think your references to disk access here are misleading. Isn't the issue here the contention on the lock that controls the page replacement, not the actual IO?)
I've attached a patch that allows you set the guc "JJ_xid",which makes it burn the given number of xids every time one new one is asked for. (The patch introduces lots of other stuff as well, but I didn't feel like ripping the irrelevant parts out--if you don't set any of the other gucs it introduces from their defaults, they shouldn't cause you trouble.) I think there are other tools around that do the same thing, but this is the one I know about. It is easy to drive the system into wrap-around shutdown with this, so lowering autovacuum_vacuum_cost_delay is a good idea.
Actually I haven't attached it, because then the commitfest app will list it as the patch needing review, instead I've put it here https://drive.google.com/file/d/0Bzqrh1SO9FcERV9EUThtT3pacmM/view?usp=sharing
I think reducing to every 100th access for transaction status as disk accessis sufficient to prove that there is no regression with the patch for the screnarioasked by Andres or do you think it is not?Now another possibility here could be that we try by commenting out fsyncin CLOG path to see how much it impact the performance of this test andthen for pgbench test. I am not sure there will be any impact because evenevery 100th transaction goes to disk access that is still less as compareWAL fsync which we have to perform for each transaction.You mentioned that your clog is not on ssd, but surely at this scale of hardware, the hdd the clog is on has a bbu in front of it, no?
But I thought Andres' concern was not about fsync, but about the fact that the SLRU does linear scans (repeatedly) of the buffers while holding the control lock? At some point, scanning more and more buffers under the lock is going to cause more contention than scanning fewer buffers and just evicting a page will.
On 09/18/2015 11:11 PM, Amit Kapila wrote:I have done various runs on an Intel Xeon 28C/56T w/ 256Gb mem and 2 xThe benefit with this patch could be seen at somewhat higher
RAID10 SSD (data + xlog) with Min(64,).
client-count as you can see in my initial mail, can you please
once try with client count > 64?
Client count were from 1 to 80.
I did do one run with Min(128,) like you, but didn't see any difference in the result compared to Min(64,), so focused instead in the sync_commit on/off testing case.
Performance Data
different_sc_perf.png - At various scale factors, there is a gain from
perf_write_clogcontrollock_data_v1.ods - Detailed performance data at
Stats Data
---------
A. scale_factor = 300; shared_buffers=32GB; client_connections - 128
HEAD - 5c90a2ff
----------------
CLogControlLock Data
------------------------
PID 94100 lwlock main 11: shacq 678672 exacq 326477 blk 204427 spindelay 8532 dequeue self 93192
PID 94129 lwlock main 11: shacq 757047 exacq 363176 blk 207840 spindelay 8866 dequeue self 96601
PID 94115 lwlock main 11: shacq 721632 exacq 345967 blk 207665 spindelay 8595 dequeue self 96185
PID 94011 lwlock main 11: shacq 501900 exacq 241346 blk 173295 spindelay 7882 dequeue self 78134
PID 94087 lwlock main 11: shacq 653701 exacq 314311 blk 201733 spindelay 8419 dequeue self 92190
After Patch group_update_clog_v1
----------------
CLogControlLock Data
------------------------
PID 100205 lwlock main 11: shacq 836897 exacq 176007 blk 116328 spindelay 1206 dequeue self 54485
PID 100034 lwlock main 11: shacq 437610 exacq 91419 blk 77523 spindelay 994 dequeue self 35419
PID 100175 lwlock main 11: shacq 748948 exacq 158970 blk 114027 spindelay 1277 dequeue self 53486
PID 100162 lwlock main 11: shacq 717262 exacq 152807 blk 115268 spindelay 1227 dequeue self 51643
PID 100214 lwlock main 11: shacq 856044 exacq 180422 blk 113695 spindelay 1202 dequeue self 54435
The above data indicates that contention due to CLogControlLock is
The reasons for remaining contention could be:
1. Readers of clog data (checking transaction status data) can take
exclusive locker which updates transaction status. One of the ways to
2. Readers of clog data (checking transaction status data) takes shared
Вложения
>
> On Mon, Aug 31, 2015 at 9:49 PM, Amit Kapila <amit.kapila16@gmail.com> wrote:
> > Increasing CLOG buffers to 64 helps in reducing the contention due to second
> > reason. Experiments revealed that increasing CLOG buffers only helps
> > once the contention around ProcArrayLock is reduced.
>
> There has been a lot of research on bitmap compression, more or less
> for the benefit of bitmap index access methods.
>
> Simple techniques like run length encoding are effective for some
> things. If the need to map the bitmap into memory to access the status
> of transactions is a concern, there has been work done on that, too.
> Byte-aligned bitmap compression is a technique that might offer a good
> trade-off between compression clog, and decompression overhead -- I
> think that there basically is no decompression overhead, because set
> operations can be performed on the "compressed" representation
> directly. There are other techniques, too.
>
>
> On Mon, Sep 21, 2015 at 6:34 AM, Peter Geoghegan <pg@heroku.com> wrote:
> >
> > On Mon, Aug 31, 2015 at 9:49 PM, Amit Kapila <amit.kapila16@gmail.com> wrote:
> > > Increasing CLOG buffers to 64 helps in reducing the contention due to second
> > > reason. Experiments revealed that increasing CLOG buffers only helps
> > > once the contention around ProcArrayLock is reduced.
> >
>
> Overall this idea sounds promising, but I think the work involved is more
> than the benefit I am expecting for the current optimization we are
> discussing.
>
than the benefit expected from the current optimization we are
discussing.
In anycase, I went ahead and tried further reducing the CLogControlLockcontention by grouping the transaction status updates. The basic ideais same as is used to reduce the ProcArrayLock contention [1] which is toallow one of the proc to become leader and update the transaction status forother active transactions in system. This has helped to reduce the contentionaround CLOGControlLock.
Attached patch group_update_clog_v1.patchimplements this idea.
The above data indicates that contention due to CLogControlLock isreduced by around 50% with this patch.
The reasons for remaining contention could be:
1. Readers of clog data (checking transaction status data) can takeExclusive CLOGControlLock when reading the page from disk, this cancontend with other Readers (shared lockers of CLogControlLock) and with
exclusive locker which updates transaction status. One of the ways tomitigate this contention is to increase the number of CLOG buffers for whichpatch has been already posted on this thread.
2. Readers of clog data (checking transaction status data) takes sharedCLOGControlLock which can contend with exclusive locker (Group leader) whichupdates transaction status. I have tried to reduce the amount of work doneby group leader, by allowing group leader to just read the Clog page oncefor all the transactions in the group which updated the same CLOG page(idea similar to what we currently we use for updating the status of transactionshaving sub-transaction tree), but that hasn't given any further performance boost,so I left it.I think we can use some other ways as well to reduce the contention aroundCLOGControlLock by doing somewhat major surgery around SLRU like usingbuffer pools similar to shared buffers, but this idea gives us moderateimprovement without much impact on exiting mechanism.
PostgreSQL Development, 24x7 Support, Remote DBA, Training & Services
On 17 November 2015 at 06:50, Amit Kapila <amit.kapila16@gmail.com> wrote:In anycase, I went ahead and tried further reducing the CLogControlLockcontention by grouping the transaction status updates. The basic ideais same as is used to reduce the ProcArrayLock contention [1] which is toallow one of the proc to become leader and update the transaction status forother active transactions in system. This has helped to reduce the contentionaround CLOGControlLock.Sounds good. The technique has proved effective with proc array and makes sense to use here also.Attached patch group_update_clog_v1.patchimplements this idea.I don't think we should be doing this only for transactions that don't have subtransactions.
We are trying to speed up real cases, not just benchmarks.
So +1 for the concept, patch is going in right direction though lets do the full press-up.
The above data indicates that contention due to CLogControlLock isreduced by around 50% with this patch.
The reasons for remaining contention could be:
1. Readers of clog data (checking transaction status data) can takeExclusive CLOGControlLock when reading the page from disk, this cancontend with other Readers (shared lockers of CLogControlLock) and with
exclusive locker which updates transaction status. One of the ways tomitigate this contention is to increase the number of CLOG buffers for whichpatch has been already posted on this thread.
2. Readers of clog data (checking transaction status data) takes sharedCLOGControlLock which can contend with exclusive locker (Group leader) whichupdates transaction status. I have tried to reduce the amount of work doneby group leader, by allowing group leader to just read the Clog page oncefor all the transactions in the group which updated the same CLOG page(idea similar to what we currently we use for updating the status of transactionshaving sub-transaction tree), but that hasn't given any further performance boost,so I left it.I think we can use some other ways as well to reduce the contention aroundCLOGControlLock by doing somewhat major surgery around SLRU like usingbuffer pools similar to shared buffers, but this idea gives us moderateimprovement without much impact on exiting mechanism.My earlier patch to reduce contention by changing required lock level is still valid here. Increasing the number of buffers doesn't do enough to remove that.
I'm working on a patch to use a fast-update area like we use for GIN. If a page is not available when we want to record commit, just store it in a hash table, when not in crash recovery. I'm experimenting with writing WAL for any xids earlier than last checkpoint, though we could also trickle writes and/or flush them in batches at checkpoint time - your code would help there.The hash table can also be used for lookups. My thinking is that most reads of older xids are caused by long running transactions, so they cause a page fault at commit and then other page faults later when people read them back in. The hash table works for both kinds of page fault.
With Regards,
Amit Kapila.
Attached patch group_update_clog_v1.patchimplements this idea.I don't think we should be doing this only for transactions that don't have subtransactions.The reason for not doing this optimization for subtransactions is that weneed to advertise the information that Group leader needs for updatingthe transaction status and if we want to do it for sub transactions, thenall the subtransaction id's needs to be advertised. Now here the trickypart is that number of subtransactions for which the status needs tobe updated is dynamic, so reserving memory for it would be difficult.However, we can reserve some space in Proc like we do for XidCache(cache of sub transaction ids) and then use that to advertise that manyXid's at-a-time or just allow this optimization if number of subtransactionsis lesser than or equal to the size of this new XidCache. I am not sureif it is good idea to use the existing XidCache for this purpose in whichcase we need to have a separate space in PGProc for this purpose. Idon't see allocating space for 64 or so subxid's as a problem, howeverdoing it for bigger number could be cause of concern.We are trying to speed up real cases, not just benchmarks.So +1 for the concept, patch is going in right direction though lets do the full press-up.I have mentioned above the reason for not doing it for sub transactions, ifyou think it is viable to reserve space in shared memory for this purpose, thenI can include the optimization for subtransactions as well.
PostgreSQL Development, 24x7 Support, Remote DBA, Training & Services
On 17 November 2015 at 11:27, Amit Kapila <amit.kapila16@gmail.com> wrote:We are trying to speed up real cases, not just benchmarks.So +1 for the concept, patch is going in right direction though lets do the full press-up.I have mentioned above the reason for not doing it for sub transactions, ifyou think it is viable to reserve space in shared memory for this purpose, thenI can include the optimization for subtransactions as well.The number of subxids is unbounded, so as you say, reserving shmem isn't viable.I'm interested in real world cases, so allocating 65 xids per process isn't needed, but we can say is that the optimization shouldn't break down abruptly in the presence of a small/reasonable number of subtransactions.
On Tue, Nov 17, 2015 at 5:04 PM, Simon Riggs <simon@2ndquadrant.com> wrote:On 17 November 2015 at 11:27, Amit Kapila <amit.kapila16@gmail.com> wrote:We are trying to speed up real cases, not just benchmarks.So +1 for the concept, patch is going in right direction though lets do the full press-up.I have mentioned above the reason for not doing it for sub transactions, ifyou think it is viable to reserve space in shared memory for this purpose, thenI can include the optimization for subtransactions as well.The number of subxids is unbounded, so as you say, reserving shmem isn't viable.I'm interested in real world cases, so allocating 65 xids per process isn't needed, but we can say is that the optimization shouldn't break down abruptly in the presence of a small/reasonable number of subtransactions.I think in that case what we can do is if the total number ofsub transactions is lesser than equal to 64 (we can find that byoverflowed flag in PGXact) , then apply this optimisation, else usethe existing flow to update the transaction status. I think for that wedon't even need to reserve any additional memory.
On Tue, Nov 17, 2015 at 5:04 PM, Simon Riggs <simon@2ndquadrant.com> wrote:On 17 November 2015 at 11:27, Amit Kapila <amit.kapila16@gmail.com> wrote:We are trying to speed up real cases, not just benchmarks.So +1 for the concept, patch is going in right direction though lets do the full press-up.I have mentioned above the reason for not doing it for sub transactions, ifyou think it is viable to reserve space in shared memory for this purpose, thenI can include the optimization for subtransactions as well.The number of subxids is unbounded, so as you say, reserving shmem isn't viable.I'm interested in real world cases, so allocating 65 xids per process isn't needed, but we can say is that the optimization shouldn't break down abruptly in the presence of a small/reasonable number of subtransactions.I think in that case what we can do is if the total number ofsub transactions is lesser than equal to 64 (we can find that byoverflowed flag in PGXact) , then apply this optimisation, else usethe existing flow to update the transaction status. I think for that wedon't even need to reserve any additional memory. Does that soundsensible to you?
PostgreSQL Development, 24x7 Support, Remote DBA, Training & Services
On 17 November 2015 at 11:48, Amit Kapila <amit.kapila16@gmail.com> wrote:On Tue, Nov 17, 2015 at 5:04 PM, Simon Riggs <simon@2ndquadrant.com> wrote:On 17 November 2015 at 11:27, Amit Kapila <amit.kapila16@gmail.com> wrote:We are trying to speed up real cases, not just benchmarks.So +1 for the concept, patch is going in right direction though lets do the full press-up.I have mentioned above the reason for not doing it for sub transactions, ifyou think it is viable to reserve space in shared memory for this purpose, thenI can include the optimization for subtransactions as well.The number of subxids is unbounded, so as you say, reserving shmem isn't viable.I'm interested in real world cases, so allocating 65 xids per process isn't needed, but we can say is that the optimization shouldn't break down abruptly in the presence of a small/reasonable number of subtransactions.I think in that case what we can do is if the total number ofsub transactions is lesser than equal to 64 (we can find that byoverflowed flag in PGXact) , then apply this optimisation, else usethe existing flow to update the transaction status. I think for that wedon't even need to reserve any additional memory. Does that soundsensible to you?I understand you to mean that the leader should look backwards through the queue collecting xids while !(PGXACT->overflowed)
No additional shmem is required
On 17 November 2015 at 11:48, Amit Kapila <amit.kapila16@gmail.com> wrote:I think in that case what we can do is if the total number ofsub transactions is lesser than equal to 64 (we can find that byoverflowed flag in PGXact) , then apply this optimisation, else usethe existing flow to update the transaction status. I think for that wedon't even need to reserve any additional memory. Does that soundsensible to you?I understand you to mean that the leader should look backwards through the queue collecting xids while !(PGXACT->overflowed)No additional shmem is required
Вложения
On Thu, Nov 26, 2015 at 11:32 PM, Amit Kapila <amit.kapila16@gmail.com> wrote:
> On Tue, Nov 17, 2015 at 6:30 PM, Simon Riggs <simon@2ndquadrant.com> wrote:
>>
>> On 17 November 2015 at 11:48, Amit Kapila <amit.kapila16@gmail.com> wrote:
>>>
>>>
>>> I think in that case what we can do is if the total number of
>>> sub transactions is lesser than equal to 64 (we can find that by
>>> overflowed flag in PGXact) , then apply this optimisation, else use
>>> the existing flow to update the transaction status.  I think for that we
>>> don't even need to reserve any additional memory. Does that sound
>>> sensible to you?
>>
>>
>> I understand you to mean that the leader should look backwards through the
>> queue collecting xids while !(PGXACT->overflowed)
>>
>> No additional shmem is required
>>
>
> Okay, as discussed I have handled the case of sub-transactions without
> additional shmem in the attached patch.  Apart from that, I have tried
> to apply this optimization for Prepared transactions as well, but as
> the dummy proc used for such transactions doesn't have semaphore like
> backend proc's, so it is not possible to use such a proc in group status
> updation as each group member needs to wait on semaphore.  It is not tad
> difficult to add the support for that case if we are okay with creating
> additional
> semaphore for each such dummy proc which I was not sure, so I have left
> it for now.

Is this proposal instead of, or in addition to, the original thread
topic of increasing clog buffers to 64?

Thanks,

Jeff
>
> On Thu, Nov 26, 2015 at 11:32 PM, Amit Kapila <amit.kapila16@gmail.com> wrote:
> > On Tue, Nov 17, 2015 at 6:30 PM, Simon Riggs <simon@2ndquadrant.com> wrote:
> >>
> >> On 17 November 2015 at 11:48, Amit Kapila <amit.kapila16@gmail.com> wrote:
> >>>
> >>>
> >>> I think in that case what we can do is if the total number of
> >>> sub transactions is lesser than equal to 64 (we can find that by
> >>> overflowed flag in PGXact) , then apply this optimisation, else use
> >>> the existing flow to update the transaction status. I think for that we
> >>> don't even need to reserve any additional memory. Does that sound
> >>> sensible to you?
> >>
> >>
> >> I understand you to mean that the leader should look backwards through the
> >> queue collecting xids while !(PGXACT->overflowed)
> >>
> >> No additional shmem is required
> >>
> >
> > Okay, as discussed I have handled the case of sub-transactions without
> > additional shmem in the attached patch. Apart from that, I have tried
> > to apply this optimization for Prepared transactions as well, but as
> > the dummy proc used for such transactions doesn't have semaphore like
> > backend proc's, so it is not possible to use such a proc in group status
> > updation as each group member needs to wait on semaphore. It is not tad
> > difficult to add the support for that case if we are okay with creating
> > additional
> > semaphore for each such dummy proc which I was not sure, so I have left
> > it for now.
>
> Is this proposal instead of, or in addition to, the original thread
> topic of increasing clog buffers to 64?
>
On Fri, Nov 27, 2015 at 2:32 AM, Amit Kapila <amit.kapila16@gmail.com> wrote:
> Okay, as discussed I have handled the case of sub-transactions without
> additional shmem in the attached patch.  Apart from that, I have tried
> to apply this optimization for Prepared transactions as well, but as
> the dummy proc used for such transactions doesn't have semaphore like
> backend proc's, so it is not possible to use such a proc in group status
> updation as each group member needs to wait on semaphore.  It is not tad
> difficult to add the support for that case if we are okay with creating
> additional
> semaphore for each such dummy proc which I was not sure, so I have left
> it for now.

"updation" is not a word.  "acquirations" is not a word.  "penality"
is spelled wrong.

I think the approach this patch takes is pretty darned strange, and
almost certainly not what we want.  What you're doing here is putting
every outstanding CLOG-update request into a linked list, and then the
leader goes and does all of those CLOG updates.  But there's no
guarantee that the pages that need to be updated are even present in a
CLOG buffer.  If it turns out that all of the batched CLOG updates are
part of resident pages, then this is going to work great, just like
the similar ProcArrayLock optimization.  But if the pages are not
resident, then you will get WORSE concurrency and SLOWER performance
than the status quo.  The leader will sit there and read every page
that is needed, and to do that it will repeatedly release and
reacquire CLogControlLock (inside SimpleLruReadPage).  If you didn't
have a leader, the reads of all those pages could happen at the same
time, but with this design, they get serialized.  That's not good.

My idea for how this could possibly work is that you could have a list
of waiting backends for each SLRU buffer page.  Pages with waiting
backends can't be evicted without performing the updates for which
backends are waiting.  Updates to non-resident pages just work as they
do now.  When a backend acquires CLogControlLock to perform updates to
a given page, it also performs all other pending updates to that page
and releases those waiters.  When a backend acquires CLogControlLock
to evict a page, it must perform any pending updates and write the
page before completing the eviction.

I agree with Simon that it's probably a good idea for this
optimization to handle cases where a backend has a non-overflowed list
of subtransactions.  That seems doable.  Handling the case where the
subxid list has overflowed seems unimportant; it should happen rarely
and is therefore not performance-critical.  Also, handling the case
where the XIDs are spread over multiple pages seems far too
complicated to be worth the effort of trying to fit into a "fast
path".  Optimizing the case where there are 1+ XIDs that need to be
updated but all on the same page should cover well over 90% of commits
on real systems, very possibly over 99%.  That should be plenty good
enough to get whatever contention-reduction benefit is possible here.

--
Robert Haas
EnterpriseDB: http://www.enterprisedb.com
The Enterprise PostgreSQL Company
>
>
> I think the approach this patch takes is pretty darned strange, and
> almost certainly not what we want. What you're doing here is putting
> every outstanding CLOG-update request into a linked list, and then the
> leader goes and does all of those CLOG updates. But there's no
> guarantee that the pages that need to be updated are even present in a
> CLOG buffer. If it turns out that all of the batched CLOG updates are
> part of resident pages, then this is going to work great, just like
> the similar ProcArrayLock optimization. But if the pages are not
> resident, then you will get WORSE concurrency and SLOWER performance
> than the status quo. The leader will sit there and read every page
> that is needed, and to do that it will repeatedly release and
> reacquire CLogControlLock (inside SimpleLruReadPage). If you didn't
> have a leader, the reads of all those pages could happen at the same
> time, but with this design, they get serialized. That's not good.
>
> My idea for how this could possibly work is that you could have a list
> of waiting backends for each SLRU buffer page.
> I agree with Simon that it's probably a good idea for this
> optimization to handle cases where a backend has a non-overflowed list
> of subtransactions. That seems doable.
On Thu, Dec 3, 2015 at 1:48 AM, Amit Kapila <amit.kapila16@gmail.com> wrote:
> I think the way to address is don't add backend to Group list if it is
> not intended to update the same page as Group leader.  For transactions
> to be on different pages, they have to be 32768 transactionid's far apart
> and I don't see much possibility of that happening for concurrent
> transactions that are going to be grouped.

That might work.

>> My idea for how this could possibly work is that you could have a list
>> of waiting backends for each SLRU buffer page.
>
> Won't this mean that first we need to ensure that page exists in one of
> the buffers and once we have page in SLRU buffer, we can form the
> list and ensure that before eviction, the list must be processed?
> If my understanding is right, then for this to work we need to probably
> acquire CLogControlLock in Shared mode in addition to acquiring it
> in Exclusive mode for updating the status on page and performing
> pending updates for other backends.

Hmm, that wouldn't be good.  You're right: this is a problem with my
idea.  We can try what you suggested above and see how that works.  We
could also have two or more slots for groups - if a backend doesn't
get the lock, it joins the existing group for the same page, or else
creates a new group if any slot is unused.  I think it might be
advantageous to have at least two groups because otherwise things
might slow down when some transactions are rolling over to a new page
while others are still in flight for the previous page.  Perhaps we
should try it both ways and benchmark.

--
Robert Haas
EnterpriseDB: http://www.enterprisedb.com
The Enterprise PostgreSQL Company
>
> On Thu, Dec 3, 2015 at 1:48 AM, Amit Kapila <amit.kapila16@gmail.com> wrote:
> > I think the way to address is don't add backend to Group list if it is
> > not intended to update the same page as Group leader. For transactions
> > to be on different pages, they have to be 32768 transactionid's far apart
> > and I don't see much possibility of that happening for concurrent
> > transactions that are going to be grouped.
>
> That might work.
>
> >> My idea for how this could possibly work is that you could have a list
> >> of waiting backends for each SLRU buffer page.
> >
> > Won't this mean that first we need to ensure that page exists in one of
> > the buffers and once we have page in SLRU buffer, we can form the
> > list and ensure that before eviction, the list must be processed?
> > If my understanding is right, then for this to work we need to probably
> > acquire CLogControlLock in Shared mode in addition to acquiring it
> > in Exclusive mode for updating the status on page and performing
> > pending updates for other backends.
>
> Hmm, that wouldn't be good. You're right: this is a problem with my
> idea. We can try what you suggested above and see how that works. We
> could also have two or more slots for groups - if a backend doesn't
> get the lock, it joins the existing group for the same page, or else
> creates a new group if any slot is unused.
> advantageous to have at least two groups because otherwise things
> might slow down when some transactions are rolling over to a new page
> while others are still in flight for the previous page. Perhaps we
> should try it both ways and benchmark.
>
Вложения
On Sat, Dec 12, 2015 at 8:03 AM, Amit Kapila <amit.kapila16@gmail.com> wrote:

>>  I think it might be
>> advantageous to have at least two groups because otherwise things
>> might slow down when some transactions are rolling over to a new page
>> while others are still in flight for the previous page.  Perhaps we
>> should try it both ways and benchmark.
>>
>
> Sure, I can do the benchmarks with both the patches, but before that
> if you can once check whether group_slots_update_clog_v3.patch is inline
> with what you have in mind then it will be helpful.

Benchmarking sounds good.  This looks broadly like what I was thinking
about, although I'm not very sure you've got all the details right.

Some random comments:

- TransactionGroupUpdateXidStatus could do just as well without
add_proc_to_group.  You could just say if (group_no >= NUM_GROUPS)
break; instead.  Also, I think you could combine the two if statements
inside the loop.  if (nextidx != INVALID_PGPROCNO &&
ProcGlobal->allProcs[nextidx].clogPage == proc->clogPage) break; or
something like that.

- memberXid and memberXidstatus are terrible names.  Member of what?
That's going to be clear as mud to the next person looking at the
definitiono f PGPROC.  And the capitalization of memberXidstatus isn't
even consistent.  Nor is nextupdateXidStatusElem.  Please do give some
thought to the names you pick for variables and structure members.

--
Robert Haas
EnterpriseDB: http://www.enterprisedb.com
The Enterprise PostgreSQL Company
On Sat, Dec 12, 2015 at 8:03 AM, Amit Kapila <amit.kapila16@gmail.com> wrote:
>> I think it might be
>> advantageous to have at least two groups because otherwise things
>> might slow down when some transactions are rolling over to a new page
>> while others are still in flight for the previous page. Perhaps we
>> should try it both ways and benchmark.
>>
>
> Sure, I can do the benchmarks with both the patches, but before that
> if you can once check whether group_slots_update_clog_v3.patch is inline
> with what you have in mind then it will be helpful.
Benchmarking sounds good. This looks broadly like what I was thinking
about, although I'm not very sure you've got all the details right.
RAM = 492GB
Some random comments:
- TransactionGroupUpdateXidStatus could do just as well without
add_proc_to_group. You could just say if (group_no >= NUM_GROUPS)
break; instead. Also, I think you could combine the two if statements
inside the loop. if (nextidx != INVALID_PGPROCNO &&
ProcGlobal->allProcs[nextidx].clogPage == proc->clogPage) break; or
something like that.
- memberXid and memberXidstatus are terrible names. Member of what?
That's going to be clear as mud to the next person looking at the
definitiono f PGPROC.
And the capitalization of memberXidstatus isn't
even consistent. Nor is nextupdateXidStatusElem. Please do give some
thought to the names you pick for variables and structure members.
Вложения
On Fri, Dec 18, 2015 at 1:16 AM, Amit Kapila <amit.kapila16@gmail.com> wrote:
> 1. At scale factor 300, there is gain of 11% at 128-client count and
> 27% at 256 client count with Patch-1. At 4 clients, the performance with
> Patch is 0.6% less (which might be a run-to-run variation or there could
> be a small regression, but I think it is too less to be bothered about)
>
> 2. At scale factor 1000, there is no visible difference and there is some
> at lower client count there is a <1% regression which could be due to
> I/O bound nature of test.
>
> 3. On these runs, Patch-2 is mostly always worse than Patch-1, but
> the difference between them is not significant.

Hmm, that's interesting.  So the slots don't help.  I was concerned
that with only a single slot, you might have things moving quickly
until you hit the point where you switch over to the next clog
segment, and then you get a bad stall.  It sounds like that either
doesn't happen in practice, or more likely it does happen but the
extra slot doesn't eliminate the stall because there's I/O at that
point.  Either way, it sounds like we can forget the slots idea for
now.

>> Some random comments:
>>
>> - TransactionGroupUpdateXidStatus could do just as well without
>> add_proc_to_group.  You could just say if (group_no >= NUM_GROUPS)
>> break; instead.  Also, I think you could combine the two if statements
>> inside the loop.  if (nextidx != INVALID_PGPROCNO &&
>> ProcGlobal->allProcs[nextidx].clogPage == proc->clogPage) break; or
>> something like that.
>>
>> - memberXid and memberXidstatus are terrible names.  Member of what?
>
> How about changing them to clogGroupMemberXid and
> clogGroupMemberXidStatus?

What we've currently got for group XID clearing for the ProcArray is
clearXid, nextClearXidElem, and backendLatestXid.  We should try to
make these things consistent.  Maybe rename those to
procArrayGroupMember, procArrayGroupNext, procArrayGroupXid and then
start all of these identifiers with clogGroup as you propose.

>> That's going to be clear as mud to the next person looking at the
>> definitiono f PGPROC.
>
> I understand that you don't like the naming convention, but using
> such harsh language could sometimes hurt others.

Sorry.  If I am slightly frustrated here I think it is because this
same point has been raised about three times now, by me and also by
Andres, just with respect to this particular technique, and also on
other patches.  But you are right - that is no excuse for being rude.

--
Robert Haas
EnterpriseDB: http://www.enterprisedb.com
The Enterprise PostgreSQL Company
>
> On Fri, Dec 18, 2015 at 1:16 AM, Amit Kapila <amit.kapila16@gmail.com> wrote:
>
> >> Some random comments:
> >>
> >> - TransactionGroupUpdateXidStatus could do just as well without
> >> add_proc_to_group. You could just say if (group_no >= NUM_GROUPS)
> >> break; instead. Also, I think you could combine the two if statements
> >> inside the loop. if (nextidx != INVALID_PGPROCNO &&
> >> ProcGlobal->allProcs[nextidx].clogPage == proc->clogPage) break; or
> >> something like that.
> >>
> >> - memberXid and memberXidstatus are terrible names. Member of what?
> >
> > How about changing them to clogGroupMemberXid and
> > clogGroupMemberXidStatus?
>
> What we've currently got for group XID clearing for the ProcArray is
> clearXid, nextClearXidElem, and backendLatestXid. We should try to
> make these things consistent. Maybe rename those to
> procArrayGroupMember, procArrayGroupNext, procArrayGroupXid
> start all of these identifiers with clogGroup as you propose.
>
Вложения
On Mon, Dec 21, 2015 at 1:27 AM, Amit Kapila <amit.kapila16@gmail.com> wrote:
> On Fri, Dec 18, 2015 at 9:58 PM, Robert Haas <robertmhaas@gmail.com> wrote:
>>
>> On Fri, Dec 18, 2015 at 1:16 AM, Amit Kapila <amit.kapila16@gmail.com>
>> wrote:
>>
>> >> Some random comments:
>> >>
>> >> - TransactionGroupUpdateXidStatus could do just as well without
>> >> add_proc_to_group.  You could just say if (group_no >= NUM_GROUPS)
>> >> break; instead.  Also, I think you could combine the two if statements
>> >> inside the loop.  if (nextidx != INVALID_PGPROCNO &&
>> >> ProcGlobal->allProcs[nextidx].clogPage == proc->clogPage) break; or
>> >> something like that.
>> >>
>
> Changed as per suggestion.
>
>> >> - memberXid and memberXidstatus are terrible names.  Member of what?
>> >
>> > How about changing them to clogGroupMemberXid and
>> > clogGroupMemberXidStatus?
>>
>> What we've currently got for group XID clearing for the ProcArray is
>> clearXid, nextClearXidElem, and backendLatestXid.  We should try to
>> make these things consistent.  Maybe rename those to
>> procArrayGroupMember, procArrayGroupNext, procArrayGroupXid
>>
>
> Here procArrayGroupXid sounds like Xid at group level, how about
> procArrayGroupMemberXid?
> Find the patch with renamed variables for PGProc
> (rename_pgproc_variables_v1.patch) attached with mail.

I sort of hate to make these member names any longer, but I wonder if
we should make it procArrayGroupClearXid etc.  Otherwise it might be
confused with some other time of grouping of PGPROCs.

--
Robert Haas
EnterpriseDB: http://www.enterprisedb.com
The Enterprise PostgreSQL Company
>
> On Mon, Dec 21, 2015 at 1:27 AM, Amit Kapila <amit.kapila16@gmail.com> wrote:
> > On Fri, Dec 18, 2015 at 9:58 PM, Robert Haas <robertmhaas@gmail.com> wrote:
> >>
> >> On Fri, Dec 18, 2015 at 1:16 AM, Amit Kapila <amit.kapila16@gmail.com>
> >> wrote:
> >>
> >> >> Some random comments:
> >> >>
> >> >> - TransactionGroupUpdateXidStatus could do just as well without
> >> >> add_proc_to_group. You could just say if (group_no >= NUM_GROUPS)
> >> >> break; instead. Also, I think you could combine the two if statements
> >> >> inside the loop. if (nextidx != INVALID_PGPROCNO &&
> >> >> ProcGlobal->allProcs[nextidx].clogPage == proc->clogPage) break; or
> >> >> something like that.
> >> >>
> >
> > Changed as per suggestion.
> >
> >> >> - memberXid and memberXidstatus are terrible names. Member of what?
> >> >
> >> > How about changing them to clogGroupMemberXid and
> >> > clogGroupMemberXidStatus?
> >>
> >> What we've currently got for group XID clearing for the ProcArray is
> >> clearXid, nextClearXidElem, and backendLatestXid. We should try to
> >> make these things consistent. Maybe rename those to
> >> procArrayGroupMember, procArrayGroupNext, procArrayGroupXid
> >>
> >
> > Here procArrayGroupXid sounds like Xid at group level, how about
> > procArrayGroupMemberXid?
> > Find the patch with renamed variables for PGProc
> > (rename_pgproc_variables_v1.patch) attached with mail.
>
> I sort of hate to make these member names any longer, but I wonder if
> we should make it procArrayGroupClearXid etc.
> confused with some other time of grouping of PGPROCs.
>
Вложения
On Wed, Dec 23, 2015 at 6:16 PM, Amit Kapila <amit.kapila16@gmail.com> wrote:
> blah.

autovacuum log: Moved to next CF as thread is really active.
--
Michael
On Wed, Dec 23, 2015 at 1:16 AM, Amit Kapila <amit.kapila16@gmail.com> wrote:
> On Tue, Dec 22, 2015 at 10:43 PM, Robert Haas <robertmhaas@gmail.com> wrote:
>>
>> On Mon, Dec 21, 2015 at 1:27 AM, Amit Kapila <amit.kapila16@gmail.com>
>> wrote:
>> > On Fri, Dec 18, 2015 at 9:58 PM, Robert Haas <robertmhaas@gmail.com>
>> > wrote:
>> >>
>> >> On Fri, Dec 18, 2015 at 1:16 AM, Amit Kapila <amit.kapila16@gmail.com>
>> >> wrote:
>> >>
>> >> >> Some random comments:
>> >> >>
>> >> >> - TransactionGroupUpdateXidStatus could do just as well without
>> >> >> add_proc_to_group.  You could just say if (group_no >= NUM_GROUPS)
>> >> >> break; instead.  Also, I think you could combine the two if
>> >> >> statements
>> >> >> inside the loop.  if (nextidx != INVALID_PGPROCNO &&
>> >> >> ProcGlobal->allProcs[nextidx].clogPage == proc->clogPage) break; or
>> >> >> something like that.
>> >> >>
>> >
>> > Changed as per suggestion.
>> >
>> >> >> - memberXid and memberXidstatus are terrible names.  Member of what?
>> >> >
>> >> > How about changing them to clogGroupMemberXid and
>> >> > clogGroupMemberXidStatus?
>> >>
>> >> What we've currently got for group XID clearing for the ProcArray is
>> >> clearXid, nextClearXidElem, and backendLatestXid.  We should try to
>> >> make these things consistent.  Maybe rename those to
>> >> procArrayGroupMember, procArrayGroupNext, procArrayGroupXid
>> >>
>> >
>> > Here procArrayGroupXid sounds like Xid at group level, how about
>> > procArrayGroupMemberXid?
>> > Find the patch with renamed variables for PGProc
>> > (rename_pgproc_variables_v1.patch) attached with mail.
>>
>> I sort of hate to make these member names any longer, but I wonder if
>> we should make it procArrayGroupClearXid etc.
>
> If we go by this suggestion, then the name will look like:
> PGProc
> {
> ..
> bool procArrayGroupClearXid, pg_atomic_uint32 procArrayGroupNextClearXid,
> TransactionId procArrayGroupLatestXid;
> ..
>
> PROC_HDR
> {
> ..
> pg_atomic_uint32 procArrayGroupFirstClearXid;
> ..
> }
>
> I think whatever I sent in last patch were better.  It seems to me it is
> better to add some comments before variable names, so that anybody
> referring them can understand better and I have added comments in
> attached patch rename_pgproc_variables_v2.patch to explain the same.

Well, I don't know.  Anybody else have an opinion?

--
Robert Haas
EnterpriseDB: http://www.enterprisedb.com
The Enterprise PostgreSQL Company
Well, I don't know. Anybody else have an opinion?On Wed, Dec 23, 2015 at 1:16 AM, Amit Kapila <amit.kapila16@gmail.com> wrote:
>> >
>> > Here procArrayGroupXid sounds like Xid at group level, how about
>> > procArrayGroupMemberXid?
>> > Find the patch with renamed variables for PGProc
>> > (rename_pgproc_variables_v1.patch) attached with mail.
>>
>> I sort of hate to make these member names any longer, but I wonder if
>> we should make it procArrayGroupClearXid etc.
>
> If we go by this suggestion, then the name will look like:
> PGProc
> {
> ..
> bool procArrayGroupClearXid, pg_atomic_uint32 procArrayGroupNextClearXid,
> TransactionId procArrayGroupLatestXid;
> ..
>
> PROC_HDR
> {
> ..
> pg_atomic_uint32 procArrayGroupFirstClearXid;
> ..
> }
>
> I think whatever I sent in last patch were better. It seems to me it is
> better to add some comments before variable names, so that anybody
> referring them can understand better and I have added comments in
> attached patch rename_pgproc_variables_v2.patch to explain the same.
Вложения
On 7 January 2016 at 05:24, Amit Kapila <amit.kapila16@gmail.com> wrote:
> On Fri, Dec 25, 2015 at 6:36 AM, Robert Haas <robertmhaas@gmail.com> wrote:
>>
>> On Wed, Dec 23, 2015 at 1:16 AM, Amit Kapila <amit.kapila16@gmail.com>
>> wrote:
>> >> >
>> >> > Here procArrayGroupXid sounds like Xid at group level, how about
>> >> > procArrayGroupMemberXid?
>> >> > Find the patch with renamed variables for PGProc
>> >> > (rename_pgproc_variables_v1.patch) attached with mail.
>> >>
>> >> I sort of hate to make these member names any longer, but I wonder if
>> >> we should make it procArrayGroupClearXid etc.
>> >
>> > If we go by this suggestion, then the name will look like:
>> > PGProc
>> > {
>> > ..
>> > bool procArrayGroupClearXid, pg_atomic_uint32
>> > procArrayGroupNextClearXid,
>> > TransactionId procArrayGroupLatestXid;
>> > ..
>> >
>> > PROC_HDR
>> > {
>> > ..
>> > pg_atomic_uint32 procArrayGroupFirstClearXid;
>> > ..
>> > }
>> >
>> > I think whatever I sent in last patch were better.  It seems to me it is
>> > better to add some comments before variable names, so that anybody
>> > referring them can understand better and I have added comments in
>> > attached patch rename_pgproc_variables_v2.patch to explain the same.
>>
>> Well, I don't know.  Anybody else have an opinion?
>>
>
> It seems that either people don't have any opinion on this matter or they
> are okay with either of the naming conventions being discussed.  I think
> specifying Member after procArrayGroup can help distinguishing which
> variables are specific to the whole group and which are specific to a
> particular member.  I think that will be helpful for other places as well
> if we use this technique to improve performance.  Let me know what
> you think about the same.
>
> I have verified that previous patches can be applied cleanly and passes
> make check-world.  To avoid confusion, I am attaching the latest
> patches with this mail.

Patches still apply 1 month later.

I don't really have an opinion on the variable naming.  I guess they
only need making longer if there's going to be some confusion about
what they're for, but I'm guessing it's not a blocker here.

Thom
>
> On 7 January 2016 at 05:24, Amit Kapila <amit.kapila16@gmail.com> wrote:
> > On Fri, Dec 25, 2015 at 6:36 AM, Robert Haas <robertmhaas@gmail.com> wrote:
> >>
> >> On Wed, Dec 23, 2015 at 1:16 AM, Amit Kapila <amit.kapila16@gmail.com>
> >> wrote:
> >> >> >
> >> >> > Here procArrayGroupXid sounds like Xid at group level, how about
> >> >> > procArrayGroupMemberXid?
> >> >> > Find the patch with renamed variables for PGProc
> >> >> > (rename_pgproc_variables_v1.patch) attached with mail.
> >> >>
> >> >> I sort of hate to make these member names any longer, but I wonder if
> >> >> we should make it procArrayGroupClearXid etc.
> >> >
> >> > If we go by this suggestion, then the name will look like:
> >> > PGProc
> >> > {
> >> > ..
> >> > bool procArrayGroupClearXid, pg_atomic_uint32
> >> > procArrayGroupNextClearXid,
> >> > TransactionId procArrayGroupLatestXid;
> >> > ..
> >> >
> >> > PROC_HDR
> >> > {
> >> > ..
> >> > pg_atomic_uint32 procArrayGroupFirstClearXid;
> >> > ..
> >> > }
> >> >
> >> > I think whatever I sent in last patch were better. It seems to me it is
> >> > better to add some comments before variable names, so that anybody
> >> > referring them can understand better and I have added comments in
> >> > attached patch rename_pgproc_variables_v2.patch to explain the same.
> >>
> >> Well, I don't know. Anybody else have an opinion?
> >>
> >
> > It seems that either people don't have any opinion on this matter or they
> > are okay with either of the naming conventions being discussed. I think
> > specifying Member after procArrayGroup can help distinguishing which
> > variables are specific to the whole group and which are specific to a
> > particular member. I think that will be helpful for other places as well
> > if we use this technique to improve performance. Let me know what
> > you think about the same.
> >
> > I have verified that previous patches can be applied cleanly and passes
> > make check-world. To avoid confusion, I am attaching the latest
> > patches with this mail.
>
> Patches still apply 1 month later.
>
Thanks for verification!
>
> I don't really have an opinion on the variable naming. I guess they
> only need making longer if there's going to be some confusion about
> what they're for,
>
On Tue, Feb 9, 2016 at 11:14 PM, Amit Kapila <amit.kapila16@gmail.com> wrote:
>> Patches still apply 1 month later.
>
> Thanks for verification!
>
>>
>> I don't really have an opinion on the variable naming.  I guess they
>> only need making longer if there's going to be some confusion about
>> what they're for,
>
> makes sense, that is the reason why I have added few comments
> as well, but not sure if you are suggesting something else.
>
>> but I'm guessing it's not a blocker here.
>>
>
> I also think so, but not sure what else is required here.  The basic
> idea of this rename_pgproc_variables_v2.patch is to rename
> few variables in existing similar code, so that the main patch
> group_update_clog can adapt those naming convention if required,
> other than that I have handled all review comments raised in this
> thread (mainly by Simon and Robert).
>
> Is there anything, I can do to move this forward?

Well, looking at this again, I think I'm OK to go with your names.
That doesn't seem like the thing to hold up the patch for.  So I'll go
ahead and push the renaming patch now.

--
Robert Haas
EnterpriseDB: http://www.enterprisedb.com
The Enterprise PostgreSQL Company
On Thu, Feb 11, 2016 at 9:04 AM, Robert Haas <robertmhaas@gmail.com> wrote:
>> Is there anything, I can do to move this forward?
>
> Well, looking at this again, I think I'm OK to go with your names.
> That doesn't seem like the thing to hold up the patch for.  So I'll go
> ahead and push the renaming patch now.

On the substantive part of the patch, this doesn't look safe:

+    /*
+     * Add ourselves to the list of processes needing a group XID status
+     * update.
+     */
+    proc->clogGroupMember = true;
+    proc->clogGroupMemberXid = xid;
+    proc->clogGroupMemberXidStatus = status;
+    proc->clogGroupMemberPage = pageno;
+    proc->clogGroupMemberLsn = lsn;
+    while (true)
+    {
+        nextidx = pg_atomic_read_u32(&procglobal->clogGroupFirst);
+
+        /*
+         * Add the proc to list if the clog page where we need to update the
+         * current transaction status is same as group leader's clog page.
+         */
+        if (nextidx != INVALID_PGPROCNO &&
+            ProcGlobal->allProcs[nextidx].clogGroupMemberPage !=
proc->clogGroupMemberPage)
+            return false;

DANGER HERE!

+        pg_atomic_write_u32(&proc->clogGroupNext, nextidx);
+
+        if (pg_atomic_compare_exchange_u32(&procglobal->clogGroupFirst,
+                                           &nextidx,
+                                           (uint32) proc->pgprocno))
+            break;
+    }

There is a potential ABA problem here.  Suppose that this code
executes in one process as far as the line that says DANGER HERE.
Then, the group leader wakes up, performs all of the CLOG
modifications, performs another write transaction, and again becomes
the group leader, but for a different member page.  Then, the original
process that went to sleep at DANGER HERE wakes up.  At this point,
the pg_atomic_compare_exchange_u32 will succeed and we'll have
processes with different pages in the list, contrary to the intention
of the code.

This kind of thing can be really subtle and difficult to fix.  The
problem might not happen even with a very large amount of testing, and
then might happen in the real world on some other hardware or on
really rare occasions.  In general, compare-and-swap loops need to be
really really simple with minimal dependencies on other data, ideally
none.  It's very hard to make anything else work.

--
Robert Haas
EnterpriseDB: http://www.enterprisedb.com
The Enterprise PostgreSQL Company
>
> On the substantive part of the patch, this doesn't look safe:
>
> + /*
> + * Add ourselves to the list of processes needing a group XID status
> + * update.
> + */
> + proc->clogGroupMember = true;
> + proc->clogGroupMemberXid = xid;
> + proc->clogGroupMemberXidStatus = status;
> + proc->clogGroupMemberPage = pageno;
> + proc->clogGroupMemberLsn = lsn;
> + while (true)
> + {
> + nextidx = pg_atomic_read_u32(&procglobal->clogGroupFirst);
> +
> + /*
> + * Add the proc to list if the clog page where we need to update the
> + * current transaction status is same as group leader's clog page.
> + */
> + if (nextidx != INVALID_PGPROCNO &&
> + ProcGlobal->allProcs[nextidx].clogGroupMemberPage !=
> proc->clogGroupMemberPage)
> + return false;
>
> DANGER HERE!
>
> + pg_atomic_write_u32(&proc->clogGroupNext, nextidx);
> +
> + if (pg_atomic_compare_exchange_u32(&procglobal->clogGroupFirst,
> + &nextidx,
> + (uint32) proc->pgprocno))
> + break;
> + }
>
> There is a potential ABA problem here. Suppose that this code
> executes in one process as far as the line that says DANGER HERE.
> Then, the group leader wakes up, performs all of the CLOG
> modifications, performs another write transaction, and again becomes
> the group leader, but for a different member page. Then, the original
> process that went to sleep at DANGER HERE wakes up. At this point,
> the pg_atomic_compare_exchange_u32 will succeed and we'll have
> processes with different pages in the list, contrary to the intention
> of the code.
>
On Fri, Feb 12, 2016 at 12:55 AM, Amit Kapila <amit.kapila16@gmail.com> wrote:
> Very Good Catch.  I think if we want to address this we can detect
> the non-group leader transactions that tries to update the different
> CLOG page (different from group-leader) after acquiring
> CLogControlLock and then mark these transactions such that
> after waking they need to perform CLOG update via normal path.
> Now this can decrease the latency of such transactions, but I

I think you mean "increase".

> think there will be only very few transactions if at-all there which
> can face this condition, because most of the concurrent transactions
> should be on same page, otherwise the idea of multiple-slots we
> have tried upthread would have shown benefits.
> Another idea could be that we update the comments indicating the
> possibility of multiple Clog-page updates in same group on the basis
> that such cases will be less and even if it happens, it won't effect the
> transaction status update.

I think either approach of those approaches could work, as long as the
logic is correct and the comments are clear.  The important thing is
that the code had better do something safe if this situation ever
occurs, and the comments had better be clear that this is a possible
situation so that someone modifying the code in the future doesn't
think it's impossible, rely on it not happening, and consequently
introduce a very-low-probability bug.

--
Robert Haas
EnterpriseDB: http://www.enterprisedb.com
The Enterprise PostgreSQL Company
>
> On Fri, Feb 12, 2016 at 12:55 AM, Amit Kapila <amit.kapila16@gmail.com> wrote:
> > Very Good Catch. I think if we want to address this we can detect
> > the non-group leader transactions that tries to update the different
> > CLOG page (different from group-leader) after acquiring
> > CLogControlLock and then mark these transactions such that
> > after waking they need to perform CLOG update via normal path.
> > Now this can decrease the latency of such transactions, but I
>
> I think you mean "increase".
>
> > think there will be only very few transactions if at-all there which
> > can face this condition, because most of the concurrent transactions
> > should be on same page, otherwise the idea of multiple-slots we
> > have tried upthread would have shown benefits.
> > Another idea could be that we update the comments indicating the
> > possibility of multiple Clog-page updates in same group on the basis
> > that such cases will be less and even if it happens, it won't effect the
> > transaction status update.
>
> I think either approach of those approaches could work, as long as the
> logic is correct and the comments are clear. The important thing is
> that the code had better do something safe if this situation ever
> occurs, and the comments had better be clear that this is a possible
> situation so that someone modifying the code in the future doesn't
> think it's impossible, rely on it not happening, and consequently
> introduce a very-low-probability bug.
>
| Client_Count/Patch_Ver | 1 | 64 | 128 | 256 |
| HEAD(481725c0) | 963 | 28145 | 28593 | 26447 |
| Patch-1 | 938 | 28152 | 31703 | 29402 |
Вложения
Client_Count/Patch_Ver 1 64 128 256 HEAD(481725c0) 963 28145 28593 26447 Patch-1 938 28152 31703 29402 We can see 10~11% performance improvement as observedpreviously. You might see 0.02% performance difference withpatch as regression, but that is just a run-to-run variation.
On Sun, Feb 21, 2016 at 10:27 AM, Amit Kapila <amit.kapila16@gmail.com> wrote:
Client_Count/Patch_Ver 1 64 128 256 HEAD(481725c0) 963 28145 28593 26447 Patch-1 938 28152 31703 29402 We can see 10~11% performance improvement as observedpreviously. You might see 0.02% performance difference withpatch as regression, but that is just a run-to-run variation.Don't the single-client numbers show about a 3% regresssion? Surely not 0.02%.
On Sun, Feb 21, 2016 at 12:02 PM, Robert Haas <robertmhaas@gmail.com> wrote:On Sun, Feb 21, 2016 at 10:27 AM, Amit Kapila <amit.kapila16@gmail.com> wrote:
Client_Count/Patch_Ver 1 64 128 256 HEAD(481725c0) 963 28145 28593 26447 Patch-1 938 28152 31703 29402 We can see 10~11% performance improvement as observedpreviously. You might see 0.02% performance difference withpatch as regression, but that is just a run-to-run variation.Don't the single-client numbers show about a 3% regresssion? Surely not 0.02%.Sorry, you are right, it is ~2.66%, but in read-write pgbench tests, Icould see such fluctuation. Also patch doesn't change single-clientcase. However, if you still feel that there could be impact by patch,I can re-run the single client case once again with different combinationslike first with HEAD and then patch and vice versa.
http://bonesmoses.org/2016/01/08/pg-phriday-how-far-weve-come/
On Sun, Feb 21, 2016 at 12:24 PM, Amit Kapila <amit.kapila16@gmail.com> wrote:On Sun, Feb 21, 2016 at 12:02 PM, Robert Haas <robertmhaas@gmail.com> wrote:On Sun, Feb 21, 2016 at 10:27 AM, Amit Kapila <amit.kapila16@gmail.com> wrote:
Client_Count/Patch_Ver 1 64 128 256 HEAD(481725c0) 963 28145 28593 26447 Patch-1 938 28152 31703 29402 We can see 10~11% performance improvement as observedpreviously. You might see 0.02% performance difference withpatch as regression, but that is just a run-to-run variation.Don't the single-client numbers show about a 3% regresssion? Surely not 0.02%.Sorry, you are right, it is ~2.66%, but in read-write pgbench tests, Icould see such fluctuation. Also patch doesn't change single-clientcase. However, if you still feel that there could be impact by patch,I can re-run the single client case once again with different combinationslike first with HEAD and then patch and vice versa.Are these results from a single run, or median-of-three?
I mean, my basic feeling is that I would not accept a 2-3% regression in the single client case to get a 10% speedup in the case where we have 128 clients.
A lot of people will not have 128 clients; quite a few will have a single session, or just a few. Sometimes just making the code more complex can hurt performance in subtle ways, e.g. by making it fit into the L1 instruction cache less well. If the numbers you have here are accurate, I'd vote to reject the patch.
I mean, my basic feeling is that I would not accept a 2-3% regression in the single client case to get a 10% speedup in the case where we have 128 clients.I understand your point. I think to verify whether it is run-to-runvariation or an actual regression, I will re-run these tests on singleclient multiple times and post the result.
A lot of people will not have 128 clients; quite a few will have a single session, or just a few. Sometimes just making the code more complex can hurt performance in subtle ways, e.g. by making it fit into the L1 instruction cache less well. If the numbers you have here are accurate, I'd vote to reject the patch.One point to note is that this patch along with first patch which Iposted in this thread to increase clog buffers can make significantreduction in contention on CLogControlLock. OTOH, I think introducingregression at single-client is also not a sane thing to do, so letsfirst try to find if there is actually any regression and if it is, canwe mitigate it by writing code with somewhat fewer instructions orin a slightly different way and then we can decide whether it is goodto reject the patch or not. Does that sound reasonable to you?
Yes.
On Sun, Feb 21, 2016 at 7:45 PM, Amit Kapila <amit.kapila16@gmail.com> wrote:I mean, my basic feeling is that I would not accept a 2-3% regression in the single client case to get a 10% speedup in the case where we have 128 clients.
I understand your point. I think to verify whether it is run-to-runvariation or an actual regression, I will re-run these tests on singleclient multiple times and post the result.Perhaps you could also try it on a couple of different machines (e.g. MacBook Pro and a couple of different large servers).
| Client_Count/Patch_ver | 1 | 8 | 64 | 128 | 256 |
| HEAD | 871 | 5090 | 17760 | 17616 | 13907 |
| PATCH | 900 | 5110 | 18331 | 20277 | 19263 |
Вложения
Here, we can see that there is a gain of ~15% to ~38% at higher client count.The attached document (perf_write_clogcontrollock_data_v6.ods) contains data, mainly focussing on single client performance. The data is for multiple runs on different machines, so I thought it is better to present in form of document rather than dumping everything in e-mail. Do let me know if there is any confusion in understanding/interpreting the data.
On Fri, Feb 26, 2016 at 11:37 PM, Amit Kapila <amit.kapila16@gmail.com> wrote:
> On Sat, Feb 27, 2016 at 10:03 AM, Amit Kapila <amit.kapila16@gmail.com>
> wrote:
>>
>> Here, we can see that there is a gain of ~15% to ~38% at higher client
>> count.
>>
>> The attached document (perf_write_clogcontrollock_data_v6.ods) contains
>> data, mainly focussing on single client performance.  The data is for
>> multiple runs on different machines, so I thought it is better to present in
>> form of document rather than dumping everything in e-mail.  Do let me know
>> if there is any confusion in understanding/interpreting the data.
>
> Forgot to mention that all these tests have been done by reverting
> commit-ac1d794.

OK, that seems better.  But I have a question: if we don't really need
to make this optimization apply only when everything is on the same
page, then why even try?  If we didn't try, we wouldn't need the
all_trans_same_page flag, which would reduce the amount of code
change.  Would that hurt anything? Taking it even further, we could
remove the check from TransactionGroupUpdateXidStatus too.  I'd be
curious to know whether that set of changes would improve performance
or regress it.  Or maybe it does nothing, in which case perhaps
simpler is better.

All things being equal, it's probably better if the cases where
transactions from different pages get into the list together is
something that is more or less expected rather than a
once-in-a-blue-moon scenario - that way, if any bugs exist, we'll find
them.  The downside of that is that we could increase latency for the
leader that way - doing other work on the same page shouldn't hurt
much but different pages is a bigger hit.  But that hit might be
trivial enough not to be worth worrying about.

+       /*
+        * Now that we've released the lock, go back and wake everybody up.  We
+        * don't do this under the lock so as to keep lock hold times to a
+        * minimum.  The system calls we need to perform to wake other processes
+        * up are probably much slower than the simple memory writes
we did while
+        * holding the lock.
+        */

This comment was true in the place that you cut-and-pasted it from,
but it's not true here, since we potentially need to read from disk.

--
Robert Haas
EnterpriseDB: http://www.enterprisedb.com
The Enterprise PostgreSQL Company
>
> On Fri, Feb 26, 2016 at 11:37 PM, Amit Kapila <amit.kapila16@gmail.com> wrote:
> > On Sat, Feb 27, 2016 at 10:03 AM, Amit Kapila <amit.kapila16@gmail.com>
> > wrote:
> >>
> >> Here, we can see that there is a gain of ~15% to ~38% at higher client
> >> count.
> >>
> >> The attached document (perf_write_clogcontrollock_data_v6.ods) contains
> >> data, mainly focussing on single client performance. The data is for
> >> multiple runs on different machines, so I thought it is better to present in
> >> form of document rather than dumping everything in e-mail. Do let me know
> >> if there is any confusion in understanding/interpreting the data.
> >
> > Forgot to mention that all these tests have been done by reverting
> > commit-ac1d794.
>
> OK, that seems better. But I have a question: if we don't really need
> to make this optimization apply only when everything is on the same
> page, then why even try? If we didn't try, we wouldn't need the
> all_trans_same_page flag, which would reduce the amount of code
> change.
> remove the check from TransactionGroupUpdateXidStatus too. I'd be
> curious to know whether that set of changes would improve performance
> or regress it. Or maybe it does nothing, in which case perhaps
> simpler is better.
>
> All things being equal, it's probably better if the cases where
> transactions from different pages get into the list together is
> something that is more or less expected rather than a
> once-in-a-blue-moon scenario - that way, if any bugs exist, we'll find
> them. The downside of that is that we could increase latency for the
> leader that way - doing other work on the same page shouldn't hurt
> much but different pages is a bigger hit. But that hit might be
> trivial enough not to be worth worrying about.
>
> + /*
> + * Now that we've released the lock, go back and wake everybody up. We
> + * don't do this under the lock so as to keep lock hold times to a
> + * minimum. The system calls we need to perform to wake other processes
> + * up are probably much slower than the simple memory writes
> we did while
> + * holding the lock.
> + */
>
> This comment was true in the place that you cut-and-pasted it from,
> but it's not true here, since we potentially need to read from disk.
>
Okay, will change.
>
> On Fri, Feb 26, 2016 at 11:37 PM, Amit Kapila <amit.kapila16@gmail.com> wrote:
> > On Sat, Feb 27, 2016 at 10:03 AM, Amit Kapila <amit.kapila16@gmail.com>
> > wrote:
> >>
> >> Here, we can see that there is a gain of ~15% to ~38% at higher client
> >> count.
> >>
> >> The attached document (perf_write_clogcontrollock_data_v6.ods) contains
> >> data, mainly focussing on single client performance. The data is for
> >> multiple runs on different machines, so I thought it is better to present in
> >> form of document rather than dumping everything in e-mail. Do let me know
> >> if there is any confusion in understanding/interpreting the data.
> >
> > Forgot to mention that all these tests have been done by reverting
> > commit-ac1d794.
>
> OK, that seems better. But I have a question: if we don't really need
> to make this optimization apply only when everything is on the same
> page, then why even try?
>
This optimization is only applicable if the transaction and
+ * all child sub-transactions belong to same page which we presume to be the
+ * most common case, we might be able to apply this when they are not on same
+ * page, but that needs us to map sub-transactions in proc's XidCache based
+ * on pageno for which each time Group leader needs to set the transaction
+ * status and that can lead to some performance penalty as well because it
+ * needs to be done after acquiring CLogControlLock, so let's leave that
+ * case for now.
On 2/26/16 11:37 PM, Amit Kapila wrote:

> On Sat, Feb 27, 2016 at 10:03 AM, Amit Kapila <amit.kapila16@gmail.com
>
>     Here, we can see that there is a gain of ~15% to ~38% at higher
>     client count.
>
>     The attached document (perf_write_clogcontrollock_data_v6.ods)
>     contains data, mainly focussing on single client performance.  The
>     data is for multiple runs on different machines, so I thought it is
>     better to present in form of document rather than dumping everything
>     in e-mail.  Do let me know if there is any confusion in
>     understanding/interpreting the data.
>
> Forgot to mention that all these tests have been done by
> reverting commit-ac1d794.

This patch no longer applies cleanly:

$ git apply ../other/group_update_clog_v6.patch
error: patch failed: src/backend/storage/lmgr/proc.c:404
error: src/backend/storage/lmgr/proc.c: patch does not apply
error: patch failed: src/include/storage/proc.h:152
error: src/include/storage/proc.h: patch does not apply

It's not clear to me whether Robert has completed a review of this code
or it still needs to be reviewed more comprehensively.

Other than a comment that needs to be fixed it seems that all questions
have been answered by Amit.

Is this "ready for committer" or still in need of further review?

--
-David
david@pgmasters.net
>
> On 2/26/16 11:37 PM, Amit Kapila wrote:
>
>> On Sat, Feb 27, 2016 at 10:03 AM, Amit Kapila <amit.kapila16@gmail.com
>>
>> Here, we can see that there is a gain of ~15% to ~38% at higher
>> client count.
>>
>> The attached document (perf_write_clogcontrollock_data_v6.ods)
>> contains data, mainly focussing on single client performance. The
>> data is for multiple runs on different machines, so I thought it is
>> better to present in form of document rather than dumping everything
>> in e-mail. Do let me know if there is any confusion in
>> understanding/interpreting the data.
>>
>> Forgot to mention that all these tests have been done by
>> reverting commit-ac1d794.
>
>
> This patch no longer applies cleanly:
>
> $ git apply ../other/group_update_clog_v6.patch
> error: patch failed: src/backend/storage/lmgr/proc.c:404
> error: src/backend/storage/lmgr/proc.c: patch does not apply
> error: patch failed: src/include/storage/proc.h:152
> error: src/include/storage/proc.h: patch does not apply
>
For me, with patch -p1 < <path_of_patch> it works, but any how I have updated the patch based on recent commit. Can you please check the latest patch and see if it applies cleanly for you now.
>
> It's not clear to me whether Robert has completed a review of this code or it still needs to be reviewed more comprehensively.
>
> Other than a comment that needs to be fixed it seems that all questions have been answered by Amit.
>
Вложения
On 3/15/16 1:17 AM, Amit Kapila wrote:

> On Tue, Mar 15, 2016 at 12:00 AM, David Steele <david@pgmasters.net
>
>> This patch no longer applies cleanly:
>>
>> $ git apply ../other/group_update_clog_v6.patch
>> error: patch failed: src/backend/storage/lmgr/proc.c:404
>> error: src/backend/storage/lmgr/proc.c: patch does not apply
>> error: patch failed: src/include/storage/proc.h:152
>> error: src/include/storage/proc.h: patch does not apply
>
> For me, with patch -p1 < <path_of_patch> it works, but any how I have
> updated the patch based on recent commit.  Can you please check the
> latest patch and see if it applies cleanly for you now.

Yes, it now applies cleanly (101fd93).

--
-David
david@pgmasters.net
>
> On 3/15/16 1:17 AM, Amit Kapila wrote:
>
> > On Tue, Mar 15, 2016 at 12:00 AM, David Steele <david@pgmasters.net
> >
> >> This patch no longer applies cleanly:
> >>
> >> $ git apply ../other/group_update_clog_v6.patch
> >> error: patch failed: src/backend/storage/lmgr/proc.c:404
> >> error: src/backend/storage/lmgr/proc.c: patch does not apply
> >> error: patch failed: src/include/storage/proc.h:152
> >> error: src/include/storage/proc.h: patch does not apply
> >
> > For me, with patch -p1 < <path_of_patch> it works, but any how I have
> > updated the patch based on recent commit. Can you please check the
> > latest patch and see if it applies cleanly for you now.
>
> Yes, it now applies cleanly (101fd93).
>
Thanks for verification.
David Steele wrote:

> This patch no longer applies cleanly:
>
> $ git apply ../other/group_update_clog_v6.patch

Normally "git apply -3" gives good results in these cases -- it applies
the 3-way merge algorithm just as if you had applied the patch to the
revision it was built on and later git-merged with the latest head.

--
Álvaro Herrera                http://www.2ndQuadrant.com/
PostgreSQL Development, 24x7 Support, Remote DBA, Training & Services
On 03/15/2016 01:17 AM, Amit Kapila wrote:
> I have updated the comments and changed the name of one of a variable from
> "all_trans_same_page" to "all_xact_same_page" as pointed out offlist by
> Alvaro.
>
>

I have done a run, and don't see any regressions.

Intel Xeon 28C/56T @ 2GHz w/ 256GB + 2 x RAID10 (data + xlog) SSD.

I can provide perf / flamegraph profiles if needed.

Thanks for working on this !

Best regards,
  Jesper
Вложения
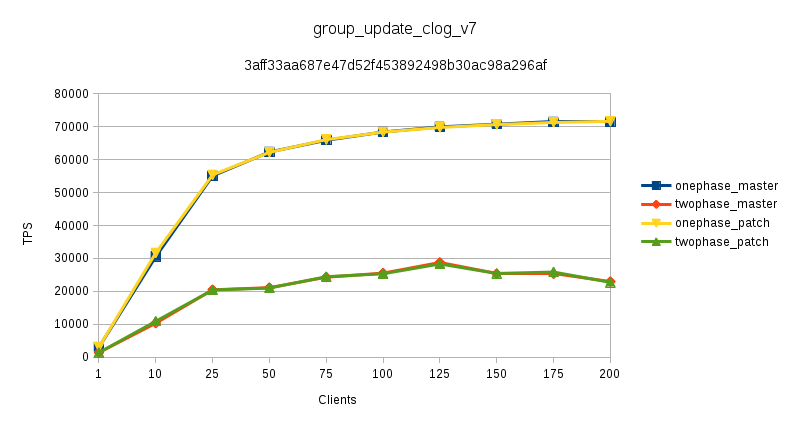
>
> On 03/15/2016 01:17 AM, Amit Kapila wrote:
>>
>> I have updated the comments and changed the name of one of a variable from
>> "all_trans_same_page" to "all_xact_same_page" as pointed out offlist by
>> Alvaro.
>>
>>
>
> I have done a run, and don't see any regressions.
>
Can you provide the details of test, like is this pgbench read-write test and if possible steps for doing test execution.
I wonder if you can do the test with unlogged tables (if you are using pgbench, then I think you need to change the Create Table command to use Unlogged option).
>
> Intel Xeon 28C/56T @ 2GHz w/ 256GB + 2 x RAID10 (data + xlog) SSD.
>
Hi,

On 2016-03-15 10:47:12 +0530, Amit Kapila wrote:
> @@ -248,12 +256,67 @@ set_status_by_pages(int nsubxids, TransactionId *subxids,
>   * Record the final state of transaction entries in the commit log for
>   * all entries on a single page.  Atomic only on this page.
>   *
> + * Group the status update for transactions. This improves the efficiency
> + * of the transaction status update by reducing the number of lock
> + * acquisitions required for it.  To achieve the group transaction status
> + * update, we need to populate the transaction status related information
> + * in shared memory and doing it for overflowed sub-transactions would need
> + * a big chunk of shared memory, so we are not doing this optimization for
> + * such cases. This optimization is only applicable if the transaction and
> + * all child sub-transactions belong to same page which we presume to be the
> + * most common case, we might be able to apply this when they are not on same
> + * page, but that needs us to map sub-transactions in proc's XidCache based
> + * on pageno for which each time a group leader needs to set the transaction
> + * status and that can lead to some performance penalty as well because it
> + * needs to be done after acquiring CLogControlLock, so let's leave that
> + * case for now.  We don't do this optimization for prepared transactions
> + * as the dummy proc associated with such transactions doesn't have a
> + * semaphore associated with it and the same is required for group status
> + * update.  We choose not to create a semaphore for dummy procs for this
> + * purpose as the advantage of using this optimization for prepared transactions
> + * is not clear.
> + *

I think you should try to break up some of the sentences, one of them
spans 7 lines.

I'm actually rather unconvinced that it's all that common that all
subtransactions are on one page. If you have concurrency - otherwise
there'd be not much point in this patch - they'll usually be heavily
interleaved, no?  You can argue that you don't care about subxacts,
because they're more often used in less concurrent scenarios, but if
that's the argument, it should actually be made.


>   * Otherwise API is same as TransactionIdSetTreeStatus()
>   */
>  static void
>  TransactionIdSetPageStatus(TransactionId xid, int nsubxids,
>                             TransactionId *subxids, XidStatus status,
> -                           XLogRecPtr lsn, int pageno)
> +                           XLogRecPtr lsn, int pageno,
> +                           bool all_xact_same_page)
> +{
> +    /*
> +     * If we can immediately acquire CLogControlLock, we update the status
> +     * of our own XID and release the lock.  If not, use group XID status
> +     * update to improve efficiency and if still not able to update, then
> +     * acquire CLogControlLock and update it.
> +     */
> +    if (LWLockConditionalAcquire(CLogControlLock, LW_EXCLUSIVE))
> +    {
> +        TransactionIdSetPageStatusInternal(xid, nsubxids, subxids, status, lsn, pageno);
> +        LWLockRelease(CLogControlLock);
> +    }
> +    else if (!all_xact_same_page ||
> +             nsubxids > PGPROC_MAX_CACHED_SUBXIDS ||
> +             IsGXactActive() ||
> +             !TransactionGroupUpdateXidStatus(xid, status, lsn, pageno))
> +    {
> +        LWLockAcquire(CLogControlLock, LW_EXCLUSIVE);
> +
> +        TransactionIdSetPageStatusInternal(xid, nsubxids, subxids, status, lsn, pageno);
> +
> +        LWLockRelease(CLogControlLock);
> +    }
> +}
>

This code is a bit arcane. I think it should be restructured to
a) Directly go for LWLockAcquire if !all_xact_same_page || nsubxids >  PGPROC_MAX_CACHED_SUBXIDS || IsGXactActive().
Goingfor a conditional  lock acquire first can be rather expensive.

b) I'd rather see an explicit fallback for the  !TransactionGroupUpdateXidStatus case, this way it's too hard to
understand.It's also harder to add probes to detect whether that


> +
> +/*
> + * When we cannot immediately acquire CLogControlLock in exclusive mode at
> + * commit time, add ourselves to a list of processes that need their XIDs
> + * status update.

At this point my "ABA Problem" alarm goes off. If it's not an actual
danger, can you please document close by, why not?


> The first process to add itself to the list will acquire
> + * CLogControlLock in exclusive mode and perform TransactionIdSetPageStatusInternal
> + * on behalf of all group members.  This avoids a great deal of contention
> + * around CLogControlLock when many processes are trying to commit at once,
> + * since the lock need not be repeatedly handed off from one committing
> + * process to the next.
> + *
> + * Returns true, if transaction status is updated in clog page, else return
> + * false.
> + */
> +static bool
> +TransactionGroupUpdateXidStatus(TransactionId xid, XidStatus status,
> +                                XLogRecPtr lsn, int pageno)
> +{
> +    volatile PROC_HDR *procglobal = ProcGlobal;
> +    PGPROC       *proc = MyProc;
> +    uint32        nextidx;
> +    uint32        wakeidx;
> +    int            extraWaits = -1;
> +
> +    /* We should definitely have an XID whose status needs to be updated. */
> +    Assert(TransactionIdIsValid(xid));
> +
> +    /*
> +     * Add ourselves to the list of processes needing a group XID status
> +     * update.
> +     */
> +    proc->clogGroupMember = true;
> +    proc->clogGroupMemberXid = xid;
> +    proc->clogGroupMemberXidStatus = status;
> +    proc->clogGroupMemberPage = pageno;
> +    proc->clogGroupMemberLsn = lsn;
> +    while (true)
> +    {
> +        nextidx = pg_atomic_read_u32(&procglobal->clogGroupFirst);
> +
> +        /*
> +         * Add the proc to list, if the clog page where we need to update the
> +         * current transaction status is same as group leader's clog page.
> +         * There is a race condition here such that after doing the below
> +         * check and before adding this proc's clog update to a group, if the
> +         * group leader already finishes the group update for this page and
> +         * becomes group leader of another group which updates different clog
> +         * page, then it will lead to a situation where a single group can
> +         * have different clog page updates.  Now the chances of such a race
> +         * condition are less and even if it happens, the only downside is
> +         * that it could lead to serial access of clog pages from disk if
> +         * those pages are not in memory.  Tests doesn't indicate any
> +         * performance hit due to different clog page updates in same group,
> +         * however in future, if we want to improve the situation, then we can
> +         * detect the non-group leader transactions that tries to update the
> +         * different CLOG page after acquiring CLogControlLock and then mark
> +         * these transactions such that after waking they need to perform CLOG
> +         * update via normal path.
> +         */

Needs a good portion of polishing.


> +        if (nextidx != INVALID_PGPROCNO &&
> +            ProcGlobal->allProcs[nextidx].clogGroupMemberPage != proc->clogGroupMemberPage)
> +            return false;

I think we're returning with clogGroupMember = true - that doesn't look
right.


> +        pg_atomic_write_u32(&proc->clogGroupNext, nextidx);
> +
> +        if (pg_atomic_compare_exchange_u32(&procglobal->clogGroupFirst,
> +                                           &nextidx,
> +                                           (uint32) proc->pgprocno))
> +            break;
> +    }

So this indeed has ABA type problems. And you appear to be arguing above
that that's ok. Need to ponder that for a bit.

So, we enqueue ourselves as the *head* of the wait list, if there's
other waiters. Seems like it could lead to the first element after the
leader to be delayed longer than the others.


FWIW, You can move the nextidx = part of out the loop,
pgatomic_compare_exchange will update the nextidx value from memory; no
need for another load afterwards.


> +    /*
> +     * If the list was not empty, the leader will update the status of our
> +     * XID. It is impossible to have followers without a leader because the
> +     * first process that has added itself to the list will always have
> +     * nextidx as INVALID_PGPROCNO.
> +     */
> +    if (nextidx != INVALID_PGPROCNO)
> +    {
> +        /* Sleep until the leader updates our XID status. */
> +        for (;;)
> +        {
> +            /* acts as a read barrier */
> +            PGSemaphoreLock(&proc->sem);
> +            if (!proc->clogGroupMember)
> +                break;
> +            extraWaits++;
> +        }
> +
> +        Assert(pg_atomic_read_u32(&proc->clogGroupNext) == INVALID_PGPROCNO);
> +
> +        /* Fix semaphore count for any absorbed wakeups */
> +        while (extraWaits-- > 0)
> +            PGSemaphoreUnlock(&proc->sem);
> +        return true;
> +    }
> +
> +    /* We are the leader.  Acquire the lock on behalf of everyone. */
> +    LWLockAcquire(CLogControlLock, LW_EXCLUSIVE);
> +
> +    /*
> +     * Now that we've got the lock, clear the list of processes waiting for
> +     * group XID status update, saving a pointer to the head of the list.
> +     * Trying to pop elements one at a time could lead to an ABA problem.
> +     */
> +    while (true)
> +    {
> +        nextidx = pg_atomic_read_u32(&procglobal->clogGroupFirst);
> +        if (pg_atomic_compare_exchange_u32(&procglobal->clogGroupFirst,
> +                                           &nextidx,
> +                                           INVALID_PGPROCNO))
> +            break;
> +    }

Hm. It seems like you should should simply use pg_atomic_exchange_u32(),
rather than compare_exchange?


> diff --git a/src/backend/access/transam/twophase.c b/src/backend/access/transam/twophase.c
> index c4fd9ef..120b9c0 100644
> --- a/src/backend/access/transam/twophase.c
> +++ b/src/backend/access/transam/twophase.c
> @@ -177,7 +177,7 @@ static TwoPhaseStateData *TwoPhaseState;
>  /*
>   * Global transaction entry currently locked by us, if any.
>   */
> -static GlobalTransaction MyLockedGxact = NULL;
> +GlobalTransaction MyLockedGxact = NULL;

Hm, I'm doubtful it's worthwhile to expose this, just so we can use an
inline function, but whatever.


> +#include "access/clog.h"
>  #include "access/xlogdefs.h"
>  #include "lib/ilist.h"
>  #include "storage/latch.h"
> @@ -154,6 +155,17 @@ struct PGPROC
>
>      uint32          wait_event_info;        /* proc's wait information */
>
> +    /* Support for group transaction status update. */
> +    bool        clogGroupMember;    /* true, if member of clog group */
> +    pg_atomic_uint32 clogGroupNext;        /* next clog group member */
> +    TransactionId clogGroupMemberXid;    /* transaction id of clog group member */
> +    XidStatus    clogGroupMemberXidStatus;        /* transaction status of clog
> +                                                 * group member */
> +    int            clogGroupMemberPage;    /* clog page corresponding to
> +                                         * transaction id of clog group member */
> +    XLogRecPtr    clogGroupMemberLsn;        /* WAL location of commit record for
> +                                         * clog group member */
> +

Man, we're surely bloating PGPROC at a prodigious rate.


That's my first pass over the code itself.


Hm. Details aside, what concerns me most is that the whole group
mechanism, as implemented, only works als long as transactions only span
a short and regular amount of time. As soon as there's some variance in
transaction duration, the likelihood of building a group, where all xids
are on one page, diminishes. That likely works well in benchmarking, but
I'm afraid it's much less the case in the real world, where there's
network latency involved, and where applications actually contain
computations themselves.

If I understand correctly, without having followed the thread, the
reason you came up with this batching on a per-page level is to bound
the amount of effort spent by the leader; and thus bound the latency?

I think it's worthwhile to create a benchmark that does something like
BEGIN;SELECT ... FOR UPDATE; SELECT pg_sleep(random_time);
INSERT;COMMIT; you'd find that if random is a bit larger (say 20-200ms,
completely realistic values for network RTT + application computation),
the success rate of group updates shrinks noticeably.

Greetings,

Andres Freund
>
> Hi,
>
> On 2016-03-15 10:47:12 +0530, Amit Kapila wrote:
> > @@ -248,12 +256,67 @@ set_status_by_pages(int nsubxids, TransactionId *subxids,
> > * Record the final state of transaction entries in the commit log for
> > * all entries on a single page. Atomic only on this page.
> > *
> > + * Group the status update for transactions. This improves the efficiency
> > + * of the transaction status update by reducing the number of lock
> > + * acquisitions required for it. To achieve the group transaction status
> > + * update, we need to populate the transaction status related information
> > + * in shared memory and doing it for overflowed sub-transactions would need
> > + * a big chunk of shared memory, so we are not doing this optimization for
> > + * such cases. This optimization is only applicable if the transaction and
> > + * all child sub-transactions belong to same page which we presume to be the
> > + * most common case, we might be able to apply this when they are not on same
> > + * page, but that needs us to map sub-transactions in proc's XidCache based
> > + * on pageno for which each time a group leader needs to set the transaction
> > + * status and that can lead to some performance penalty as well because it
> > + * needs to be done after acquiring CLogControlLock, so let's leave that
> > + * case for now. We don't do this optimization for prepared transactions
> > + * as the dummy proc associated with such transactions doesn't have a
> > + * semaphore associated with it and the same is required for group status
> > + * update. We choose not to create a semaphore for dummy procs for this
> > + * purpose as the advantage of using this optimization for prepared transactions
> > + * is not clear.
> > + *
>
> I think you should try to break up some of the sentences, one of them
> spans 7 lines.
>
> I'm actually rather unconvinced that it's all that common that all
> subtransactions are on one page. If you have concurrency - otherwise
> there'd be not much point in this patch - they'll usually be heavily
> interleaved, no? You can argue that you don't care about subxacts,
> because they're more often used in less concurrent scenarios, but if
> that's the argument, it should actually be made.
>
>
> > * Otherwise API is same as TransactionIdSetTreeStatus()
> > */
> > static void
> > TransactionIdSetPageStatus(TransactionId xid, int nsubxids,
> > TransactionId *subxids, XidStatus status,
> > - XLogRecPtr lsn, int pageno)
> > + XLogRecPtr lsn, int pageno,
> > + bool all_xact_same_page)
> > +{
> > + /*
> > + * If we can immediately acquire CLogControlLock, we update the status
> > + * of our own XID and release the lock. If not, use group XID status
> > + * update to improve efficiency and if still not able to update, then
> > + * acquire CLogControlLock and update it.
> > + */
> > + if (LWLockConditionalAcquire(CLogControlLock, LW_EXCLUSIVE))
> > + {
> > + TransactionIdSetPageStatusInternal(xid, nsubxids, subxids, status, lsn, pageno);
> > + LWLockRelease(CLogControlLock);
> > + }
> > + else if (!all_xact_same_page ||
> > + nsubxids > PGPROC_MAX_CACHED_SUBXIDS ||
> > + IsGXactActive() ||
> > + !TransactionGroupUpdateXidStatus(xid, status, lsn, pageno))
> > + {
> > + LWLockAcquire(CLogControlLock, LW_EXCLUSIVE);
> > +
> > + TransactionIdSetPageStatusInternal(xid, nsubxids, subxids, status, lsn, pageno);
> > +
> > + LWLockRelease(CLogControlLock);
> > + }
> > +}
> >
>
> This code is a bit arcane. I think it should be restructured to
> a) Directly go for LWLockAcquire if !all_xact_same_page || nsubxids >
> PGPROC_MAX_CACHED_SUBXIDS || IsGXactActive(). Going for a conditional
> lock acquire first can be rather expensive.
> b) I'd rather see an explicit fallback for the
> !TransactionGroupUpdateXidStatus case, this way it's too hard to
> understand. It's also harder to add probes to detect whether that
>
>
> > +
> > +/*
> > + * When we cannot immediately acquire CLogControlLock in exclusive mode at
> > + * commit time, add ourselves to a list of processes that need their XIDs
> > + * status update.
>
> At this point my "ABA Problem" alarm goes off. If it's not an actual
> danger, can you please document close by, why not?
>
+ /*
+ * Now that we've got the lock, clear the list of processes waiting for
+ * group XID status update, saving a pointer to the head of the list.
+ * Trying to pop elements one at a time could lead to an ABA problem.
+ */
>
> > The first process to add itself to the list will acquire
> > + * CLogControlLock in exclusive mode and perform TransactionIdSetPageStatusInternal
> > + * on behalf of all group members. This avoids a great deal of contention
> > + * around CLogControlLock when many processes are trying to commit at once,
> > + * since the lock need not be repeatedly handed off from one committing
> > + * process to the next.
> > + *
> > + * Returns true, if transaction status is updated in clog page, else return
> > + * false.
> > + */
> > +static bool
> > +TransactionGroupUpdateXidStatus(TransactionId xid, XidStatus status,
> > + XLogRecPtr lsn, int pageno)
> > +{
> > + volatile PROC_HDR *procglobal = ProcGlobal;
> > + PGPROC *proc = MyProc;
> > + uint32 nextidx;
> > + uint32 wakeidx;
> > + int extraWaits = -1;
> > +
> > + /* We should definitely have an XID whose status needs to be updated. */
> > + Assert(TransactionIdIsValid(xid));
> > +
> > + /*
> > + * Add ourselves to the list of processes needing a group XID status
> > + * update.
> > + */
> > + proc->clogGroupMember = true;
> > + proc->clogGroupMemberXid = xid;
> > + proc->clogGroupMemberXidStatus = status;
> > + proc->clogGroupMemberPage = pageno;
> > + proc->clogGroupMemberLsn = lsn;
> > + while (true)
> > + {
> > + nextidx = pg_atomic_read_u32(&procglobal->clogGroupFirst);
> > +
> > + /*
> > + * Add the proc to list, if the clog page where we need to update the
> > + * current transaction status is same as group leader's clog page.
> > + * There is a race condition here such that after doing the below
> > + * check and before adding this proc's clog update to a group, if the
> > + * group leader already finishes the group update for this page and
> > + * becomes group leader of another group which updates different clog
> > + * page, then it will lead to a situation where a single group can
> > + * have different clog page updates. Now the chances of such a race
> > + * condition are less and even if it happens, the only downside is
> > + * that it could lead to serial access of clog pages from disk if
> > + * those pages are not in memory. Tests doesn't indicate any
> > + * performance hit due to different clog page updates in same group,
> > + * however in future, if we want to improve the situation, then we can
> > + * detect the non-group leader transactions that tries to update the
> > + * different CLOG page after acquiring CLogControlLock and then mark
> > + * these transactions such that after waking they need to perform CLOG
> > + * update via normal path.
> > + */
>
> Needs a good portion of polishing.
>
>
> > + if (nextidx != INVALID_PGPROCNO &&
> > + ProcGlobal->allProcs[nextidx].clogGroupMemberPage != proc->clogGroupMemberPage)
> > + return false;
>
> I think we're returning with clogGroupMember = true - that doesn't look
> right.
>
>
> > + pg_atomic_write_u32(&proc->clogGroupNext, nextidx);
> > +
> > + if (pg_atomic_compare_exchange_u32(&procglobal->clogGroupFirst,
> > + &nextidx,
> > + (uint32) proc->pgprocno))
> > + break;
> > + }
>
> So this indeed has ABA type problems. And you appear to be arguing above
> that that's ok. Need to ponder that for a bit.
>
> So, we enqueue ourselves as the *head* of the wait list, if there's
> other waiters. Seems like it could lead to the first element after the
> leader to be delayed longer than the others.
>
>
> FWIW, You can move the nextidx = part of out the loop,
> pgatomic_compare_exchange will update the nextidx value from memory; no
> need for another load afterwards.
>
>
> > + /*
> > + * If the list was not empty, the leader will update the status of our
> > + * XID. It is impossible to have followers without a leader because the
> > + * first process that has added itself to the list will always have
> > + * nextidx as INVALID_PGPROCNO.
> > + */
> > + if (nextidx != INVALID_PGPROCNO)
> > + {
> > + /* Sleep until the leader updates our XID status. */
> > + for (;;)
> > + {
> > + /* acts as a read barrier */
> > + PGSemaphoreLock(&proc->sem);
> > + if (!proc->clogGroupMember)
> > + break;
> > + extraWaits++;
> > + }
> > +
> > + Assert(pg_atomic_read_u32(&proc->clogGroupNext) == INVALID_PGPROCNO);
> > +
> > + /* Fix semaphore count for any absorbed wakeups */
> > + while (extraWaits-- > 0)
> > + PGSemaphoreUnlock(&proc->sem);
> > + return true;
> > + }
> > +
> > + /* We are the leader. Acquire the lock on behalf of everyone. */
> > + LWLockAcquire(CLogControlLock, LW_EXCLUSIVE);
> > +
> > + /*
> > + * Now that we've got the lock, clear the list of processes waiting for
> > + * group XID status update, saving a pointer to the head of the list.
> > + * Trying to pop elements one at a time could lead to an ABA problem.
> > + */
> > + while (true)
> > + {
> > + nextidx = pg_atomic_read_u32(&procglobal->clogGroupFirst);
> > + if (pg_atomic_compare_exchange_u32(&procglobal->clogGroupFirst,
> > + &nextidx,
> > + INVALID_PGPROCNO))
> > + break;
> > + }
>
> Hm. It seems like you should should simply use pg_atomic_exchange_u32(),
> rather than compare_exchange?
>
>
> > diff --git a/src/backend/access/transam/twophase.c b/src/backend/access/transam/twophase.c
> > index c4fd9ef..120b9c0 100644
> > --- a/src/backend/access/transam/twophase.c
> > +++ b/src/backend/access/transam/twophase.c
> > @@ -177,7 +177,7 @@ static TwoPhaseStateData *TwoPhaseState;
> > /*
> > * Global transaction entry currently locked by us, if any.
> > */
> > -static GlobalTransaction MyLockedGxact = NULL;
> > +GlobalTransaction MyLockedGxact = NULL;
>
> Hm, I'm doubtful it's worthwhile to expose this, just so we can use an
> inline function, but whatever.
>
>
> > +#include "access/clog.h"
> > #include "access/xlogdefs.h"
> > #include "lib/ilist.h"
> > #include "storage/latch.h"
> > @@ -154,6 +155,17 @@ struct PGPROC
> >
> > uint32 wait_event_info; /* proc's wait information */
> >
> > + /* Support for group transaction status update. */
> > + bool clogGroupMember; /* true, if member of clog group */
> > + pg_atomic_uint32 clogGroupNext; /* next clog group member */
> > + TransactionId clogGroupMemberXid; /* transaction id of clog group member */
> > + XidStatus clogGroupMemberXidStatus; /* transaction status of clog
> > + * group member */
> > + int clogGroupMemberPage; /* clog page corresponding to
> > + * transaction id of clog group member */
> > + XLogRecPtr clogGroupMemberLsn; /* WAL location of commit record for
> > + * clog group member */
> > +
>
> Man, we're surely bloating PGPROC at a prodigious rate.
>
>
> That's my first pass over the code itself.
>
>
> Hm. Details aside, what concerns me most is that the whole group
> mechanism, as implemented, only works als long as transactions only span
> a short and regular amount of time.
> If I understand correctly, without having followed the thread, the
> reason you came up with this batching on a per-page level is to bound
> the amount of effort spent by the leader; and thus bound the latency?
>
> I think it's worthwhile to create a benchmark that does something like
> BEGIN;SELECT ... FOR UPDATE; SELECT pg_sleep(random_time);
> INSERT;COMMIT; you'd find that if random is a bit larger (say 20-200ms,
> completely realistic values for network RTT + application computation),
> the success rate of group updates shrinks noticeably.
>
On 2016-03-22 18:19:48 +0530, Amit Kapila wrote:
> > I'm actually rather unconvinced that it's all that common that all
> > subtransactions are on one page. If you have concurrency - otherwise
> > there'd be not much point in this patch - they'll usually be heavily
> > interleaved, no?  You can argue that you don't care about subxacts,
> > because they're more often used in less concurrent scenarios, but if
> > that's the argument, it should actually be made.
> >
>
> Note, that we are doing it only when a transaction has less than equal to
> 64 sub transactions.

So?

> > This code is a bit arcane. I think it should be restructured to
> > a) Directly go for LWLockAcquire if !all_xact_same_page || nsubxids >
> >    PGPROC_MAX_CACHED_SUBXIDS || IsGXactActive(). Going for a conditional
> >    lock acquire first can be rather expensive.
>
> The previous version (v5 - [1]) has code that way, but that adds few extra
> instructions for single client case and I was seeing minor performance
> regression for single client case due to which it has been changed as per
> current code.

I don't believe that changing conditions here is likely to cause a
measurable regression.


> > So, we enqueue ourselves as the *head* of the wait list, if there's
> > other waiters. Seems like it could lead to the first element after the
> > leader to be delayed longer than the others.
> >
>
> It will not matter because we are waking the queued process only once we
> are done with xid status update.

If there's only N cores, process N+1 won't be run immediately. But yea,
it's probably not large.


> > FWIW, You can move the nextidx = part of out the loop,
> > pgatomic_compare_exchange will update the nextidx value from memory; no
> > need for another load afterwards.
> >
>
> Not sure, if I understood which statement you are referring here (are you
> referring to atomic read operation) and how can we save the load operation?

Yes, to the atomic read. And we can save it in the loop, because
compare_exchange returns the current value if it fails.


> > > +      * Now that we've got the lock, clear the list of processes
> waiting for
> > > +      * group XID status update, saving a pointer to the head of the
> list.
> > > +      * Trying to pop elements one at a time could lead to an ABA
> problem.
> > > +      */
> > > +     while (true)
> > > +     {
> > > +             nextidx = pg_atomic_read_u32(&procglobal->clogGroupFirst);
> > > +             if
> (pg_atomic_compare_exchange_u32(&procglobal->clogGroupFirst,
> > > +
>          &nextidx,
> > > +
>          INVALID_PGPROCNO))
> > > +                     break;
> > > +     }
> >
> > Hm. It seems like you should should simply use pg_atomic_exchange_u32(),
> > rather than compare_exchange?
> >
>
> We need to remember the head of list to wake up the processes due to which
> I think above loop is required.

exchange returns the old value? There's no need for a compare here.


> > I think it's worthwhile to create a benchmark that does something like
> > BEGIN;SELECT ... FOR UPDATE; SELECT pg_sleep(random_time);
> > INSERT;COMMIT; you'd find that if random is a bit larger (say 20-200ms,
> > completely realistic values for network RTT + application computation),
> > the success rate of group updates shrinks noticeably.
> >
>
> I think it will happen that way, but what do we want to see with that
> benchmark? I think the results will be that for such a workload either
> there is no benefit or will be very less as compare to short transactions.

Because we want our performance improvements to matter in reality, not
just in unrealistic benchmarks where the benchmarking tool is running on
the same machine as the the database, and uses unix sockets. That not
actually an all that realistic workload.


Andres
>
> On 2016-03-22 18:19:48 +0530, Amit Kapila wrote:
> > > I'm actually rather unconvinced that it's all that common that all
> > > subtransactions are on one page. If you have concurrency - otherwise
> > > there'd be not much point in this patch - they'll usually be heavily
> > > interleaved, no? You can argue that you don't care about subxacts,
> > > because they're more often used in less concurrent scenarios, but if
> > > that's the argument, it should actually be made.
> > >
> >
> > Note, that we are doing it only when a transaction has less than equal to
> > 64 sub transactions.
>
> So?
On Tue, Mar 22, 2016 at 6:52 AM, Andres Freund <andres@anarazel.de> wrote:
> I'm actually rather unconvinced that it's all that common that all
> subtransactions are on one page. If you have concurrency - otherwise
> there'd be not much point in this patch - they'll usually be heavily
> interleaved, no?  You can argue that you don't care about subxacts,
> because they're more often used in less concurrent scenarios, but if
> that's the argument, it should actually be made.

But a single clog page holds a lot of transactions - I think it's
~32k.  If you have 100 backends running, and each one allocates an XID
in turn, and then each allocates a sub-XID in turn, and then they all
commit, and then you repeat this pattern, >99% of transactions will be
on a single CLOG page.  And that is a pretty pathological case.

It's true that if you have many short-running transactions interleaved
with occasional long-running transactions, and the latter use
subxacts, the optimization might fail to apply to the long-running
subxacts fairly often.  But who cares?  Those are, by definition, a
small percentage of the overall transaction stream.

--
Robert Haas
EnterpriseDB: http://www.enterprisedb.com
The Enterprise PostgreSQL Company
On 2016-03-22 10:40:28 -0400, Robert Haas wrote:
> On Tue, Mar 22, 2016 at 6:52 AM, Andres Freund <andres@anarazel.de> wrote:
> > I'm actually rather unconvinced that it's all that common that all
> > subtransactions are on one page. If you have concurrency - otherwise
> > there'd be not much point in this patch - they'll usually be heavily
> > interleaved, no?  You can argue that you don't care about subxacts,
> > because they're more often used in less concurrent scenarios, but if
> > that's the argument, it should actually be made.
>
> But a single clog page holds a lot of transactions - I think it's
> ~32k.

At 30-40k TPS/sec that's not actually all that much.


> If you have 100 backends running, and each one allocates an XID
> in turn, and then each allocates a sub-XID in turn, and then they all
> commit, and then you repeat this pattern, >99% of transactions will be
> on a single CLOG page.  And that is a pretty pathological case.

I think it's much more likely that some backends will immediately
allocate and others won't for a short while.


> It's true that if you have many short-running transactions interleaved
> with occasional long-running transactions, and the latter use
> subxacts, the optimization might fail to apply to the long-running
> subxacts fairly often.  But who cares?  Those are, by definition, a
> small percentage of the overall transaction stream.

Leaving subtransactions aside, I think the problem is that if you're
having slightly longer running transactions on a regular basis (and I'm
thinking 100-200ms, very common on OLTP systems due to network and
client processing), the effectiveness of the batching will be greatly
reduced.

I'll play around with the updated patch Amit promised, and see how high
the batching rate is over time, depending on the type of transaction
processed.


Andres
On 3/22/16 9:36 AM, Amit Kapila wrote:
>  > > Note, that we are doing it only when a transaction has less than
> equal to
>  > > 64 sub transactions.
>  >
>  > So?
>  >
>
> They should fall on one page, unless they are heavily interleaved as
> pointed by you.  I think either subtransactions are present or not, this
> patch won't help for bigger transactions.

FWIW, the use case that comes to mind here is the "upsert" example in
the docs. AFAIK that's going to create a subtransaction every time it's
called, regardless if whether it performs actual DML. I've used that in
places that would probably have moderately high concurrency, and I
suspect I'm not alone in that.

That said, it wouldn't surprise me if plpgsql overhead swamps an effect
this patch has, so perhaps it's a moot point.
--
Jim Nasby, Data Architect, Blue Treble Consulting, Austin TX
Experts in Analytics, Data Architecture and PostgreSQL
Data in Trouble? Get it in Treble! http://BlueTreble.com
>
> Hi,
>
> On 2016-03-15 10:47:12 +0530, Amit Kapila wrote:
> > @@ -248,12 +256,67 @@ set_status_by_pages(int nsubxids, TransactionId *subxids,
> > * Record the final state of transaction entries in the commit log for
> > * all entries on a single page. Atomic only on this page.
> > *
> > + * Group the status update for transactions. This improves the efficiency
> > + * of the transaction status update by reducing the number of lock
> > + * acquisitions required for it. To achieve the group transaction status
> > + * update, we need to populate the transaction status related information
> > + * in shared memory and doing it for overflowed sub-transactions would need
> > + * a big chunk of shared memory, so we are not doing this optimization for
> > + * such cases. This optimization is only applicable if the transaction and
> > + * all child sub-transactions belong to same page which we presume to be the
> > + * most common case, we might be able to apply this when they are not on same
> > + * page, but that needs us to map sub-transactions in proc's XidCache based
> > + * on pageno for which each time a group leader needs to set the transaction
> > + * status and that can lead to some performance penalty as well because it
> > + * needs to be done after acquiring CLogControlLock, so let's leave that
> > + * case for now. We don't do this optimization for prepared transactions
> > + * as the dummy proc associated with such transactions doesn't have a
> > + * semaphore associated with it and the same is required for group status
> > + * update. We choose not to create a semaphore for dummy procs for this
> > + * purpose as the advantage of using this optimization for prepared transactions
> > + * is not clear.
> > + *
>
> I think you should try to break up some of the sentences, one of them
> spans 7 lines.
>
Okay, I have simplified the sentences in the comment.
>
>
> > * Otherwise API is same as TransactionIdSetTreeStatus()
> > */
> > static void
> > TransactionIdSetPageStatus(TransactionId xid, int nsubxids,
> > TransactionId *subxids, XidStatus status,
> > - XLogRecPtr lsn, int pageno)
> > + XLogRecPtr lsn, int pageno,
> > + bool all_xact_same_page)
> > +{
> > + /*
> > + * If we can immediately acquire CLogControlLock, we update the status
> > + * of our own XID and release the lock. If not, use group XID status
> > + * update to improve efficiency and if still not able to update, then
> > + * acquire CLogControlLock and update it.
> > + */
> > + if (LWLockConditionalAcquire(CLogControlLock, LW_EXCLUSIVE))
> > + {
> > + TransactionIdSetPageStatusInternal(xid, nsubxids, subxids, status, lsn, pageno);
> > + LWLockRelease(CLogControlLock);
> > + }
> > + else if (!all_xact_same_page ||
> > + nsubxids > PGPROC_MAX_CACHED_SUBXIDS ||
> > + IsGXactActive() ||
> > + !TransactionGroupUpdateXidStatus(xid, status, lsn, pageno))
> > + {
> > + LWLockAcquire(CLogControlLock, LW_EXCLUSIVE);
> > +
> > + TransactionIdSetPageStatusInternal(xid, nsubxids, subxids, status, lsn, pageno);
> > +
> > + LWLockRelease(CLogControlLock);
> > + }
> > +}
> >
>
> This code is a bit arcane. I think it should be restructured to
> a) Directly go for LWLockAcquire if !all_xact_same_page || nsubxids >
> PGPROC_MAX_CACHED_SUBXIDS || IsGXactActive(). Going for a conditional
> lock acquire first can be rather expensive.
> b) I'd rather see an explicit fallback for the
> !TransactionGroupUpdateXidStatus case, this way it's too hard to
> understand. It's also harder to add probes to detect whether that
>
>
>
> > The first process to add itself to the list will acquire
> > + * CLogControlLock in exclusive mode and perform TransactionIdSetPageStatusInternal
> > + * on behalf of all group members. This avoids a great deal of contention
> > + * around CLogControlLock when many processes are trying to commit at once,
> > + * since the lock need not be repeatedly handed off from one committing
> > + * process to the next.
> > + *
> > + * Returns true, if transaction status is updated in clog page, else return
> > + * false.
> > + */
> > +static bool
> > +TransactionGroupUpdateXidStatus(TransactionId xid, XidStatus status,
> > + XLogRecPtr lsn, int pageno)
> > +{
> > + volatile PROC_HDR *procglobal = ProcGlobal;
> > + PGPROC *proc = MyProc;
> > + uint32 nextidx;
> > + uint32 wakeidx;
> > + int extraWaits = -1;
> > +
> > + /* We should definitely have an XID whose status needs to be updated. */
> > + Assert(TransactionIdIsValid(xid));
> > +
> > + /*
> > + * Add ourselves to the list of processes needing a group XID status
> > + * update.
> > + */
> > + proc->clogGroupMember = true;
> > + proc->clogGroupMemberXid = xid;
> > + proc->clogGroupMemberXidStatus = status;
> > + proc->clogGroupMemberPage = pageno;
> > + proc->clogGroupMemberLsn = lsn;
> > + while (true)
> > + {
> > + nextidx = pg_atomic_read_u32(&procglobal->clogGroupFirst);
> > +
> > + /*
> > + * Add the proc to list, if the clog page where we need to update the
> > + * current transaction status is same as group leader's clog page.
> > + * There is a race condition here such that after doing the below
> > + * check and before adding this proc's clog update to a group, if the
> > + * group leader already finishes the group update for this page and
> > + * becomes group leader of another group which updates different clog
> > + * page, then it will lead to a situation where a single group can
> > + * have different clog page updates. Now the chances of such a race
> > + * condition are less and even if it happens, the only downside is
> > + * that it could lead to serial access of clog pages from disk if
> > + * those pages are not in memory. Tests doesn't indicate any
> > + * performance hit due to different clog page updates in same group,
> > + * however in future, if we want to improve the situation, then we can
> > + * detect the non-group leader transactions that tries to update the
> > + * different CLOG page after acquiring CLogControlLock and then mark
> > + * these transactions such that after waking they need to perform CLOG
> > + * update via normal path.
> > + */
>
> Needs a good portion of polishing.
>
>
> > + if (nextidx != INVALID_PGPROCNO &&
> > + ProcGlobal->allProcs[nextidx].clogGroupMemberPage != proc->clogGroupMemberPage)
> > + return false;
>
> I think we're returning with clogGroupMember = true - that doesn't look
> right.
>
>
> > + pg_atomic_write_u32(&proc->clogGroupNext, nextidx);
> > +
> > + if (pg_atomic_compare_exchange_u32(&procglobal->clogGroupFirst,
> > + &nextidx,
> > + (uint32) proc->pgprocno))
> > + break;
> > + }
>
> So this indeed has ABA type problems. And you appear to be arguing above
> that that's ok. Need to ponder that for a bit.
>
> So, we enqueue ourselves as the *head* of the wait list, if there's
> other waiters. Seems like it could lead to the first element after the
> leader to be delayed longer than the others.
>
>
> FWIW, You can move the nextidx = part of out the loop,
> pgatomic_compare_exchange will update the nextidx value from memory; no
> need for another load afterwards.
>
>
> > + /*
> > + * If the list was not empty, the leader will update the status of our
> > + * XID. It is impossible to have followers without a leader because the
> > + * first process that has added itself to the list will always have
> > + * nextidx as INVALID_PGPROCNO.
> > + */
> > + if (nextidx != INVALID_PGPROCNO)
> > + {
> > + /* Sleep until the leader updates our XID status. */
> > + for (;;)
> > + {
> > + /* acts as a read barrier */
> > + PGSemaphoreLock(&proc->sem);
> > + if (!proc->clogGroupMember)
> > + break;
> > + extraWaits++;
> > + }
> > +
> > + Assert(pg_atomic_read_u32(&proc->clogGroupNext) == INVALID_PGPROCNO);
> > +
> > + /* Fix semaphore count for any absorbed wakeups */
> > + while (extraWaits-- > 0)
> > + PGSemaphoreUnlock(&proc->sem);
> > + return true;
> > + }
> > +
> > + /* We are the leader. Acquire the lock on behalf of everyone. */
> > + LWLockAcquire(CLogControlLock, LW_EXCLUSIVE);
> > +
> > + /*
> > + * Now that we've got the lock, clear the list of processes waiting for
> > + * group XID status update, saving a pointer to the head of the list.
> > + * Trying to pop elements one at a time could lead to an ABA problem.
> > + */
> > + while (true)
> > + {
> > + nextidx = pg_atomic_read_u32(&procglobal->clogGroupFirst);
> > + if (pg_atomic_compare_exchange_u32(&procglobal->clogGroupFirst,
> > + &nextidx,
> > + INVALID_PGPROCNO))
> > + break;
> > + }
>
> Hm. It seems like you should should simply use pg_atomic_exchange_u32(),
> rather than compare_exchange?
>
>
> I think it's worthwhile to create a benchmark that does something like
> BEGIN;SELECT ... FOR UPDATE; SELECT pg_sleep(random_time);
> INSERT;COMMIT; you'd find that if random is a bit larger (say 20-200ms,
> completely realistic values for network RTT + application computation),
> the success rate of group updates shrinks noticeably.
>
Will do some tests based on above test and share results.
Вложения
>
> On Tue, Mar 22, 2016 at 4:22 PM, Andres Freund <andres@anarazel.de> wrote:
> >
> >
> > I think it's worthwhile to create a benchmark that does something like
> > BEGIN;SELECT ... FOR UPDATE; SELECT pg_sleep(random_time);
> > INSERT;COMMIT; you'd find that if random is a bit larger (say 20-200ms,
> > completely realistic values for network RTT + application computation),
> > the success rate of group updates shrinks noticeably.
> >
>
> Will do some tests based on above test and share results.
>
>
>
> On Thu, Mar 17, 2016 at 11:39 AM, Amit Kapila <amit.kapila16@gmail.com> wrote:
>
> I have reviewed the patch.. here are some review comments, I will continue to review..
>
> 1.
>
> +
> + /*
> + * Add the proc to list, if the clog page where we need to update the
>
> + */
> + if (nextidx != INVALID_PGPROCNO &&
> + ProcGlobal->allProcs[nextidx].clogGroupMemberPage != proc->clogGroupMemberPage)
> + return false;
>
> Should we clear all these structure variable what we set above in case we are not adding our self to group, I can see it will not have any problem even if we don't clear them,
> I think if we don't want to clear we can add some comment mentioning the same.
>
>
> 2.
>
> Here we are updating in our own proc, I think we don't need atomic operation here, we are not yet added to the list.
>
> + if (nextidx != INVALID_PGPROCNO &&
> + ProcGlobal->allProcs[nextidx].clogGroupMemberPage != proc->clogGroupMemberPage)
> + return false;
> +
> + pg_atomic_write_u32(&proc->clogGroupNext, nextidx);
>
>
On 2016-03-23 12:33:22 +0530, Amit Kapila wrote:
> On Wed, Mar 23, 2016 at 12:26 PM, Amit Kapila <amit.kapila16@gmail.com>
> wrote:
> >
> > On Tue, Mar 22, 2016 at 4:22 PM, Andres Freund <andres@anarazel.de> wrote:
> > >
> > >
> > > I think it's worthwhile to create a benchmark that does something like
> > > BEGIN;SELECT ... FOR UPDATE; SELECT pg_sleep(random_time);
> > > INSERT;COMMIT; you'd find that if random is a bit larger (say 20-200ms,
> > > completely realistic values for network RTT + application computation),
> > > the success rate of group updates shrinks noticeably.
> > >
> >
> > Will do some tests based on above test and share results.
> >
>
> Forgot to mention that the effect of patch is better visible with unlogged
> tables, so will do the test with those and request you to use same if you
> yourself is also planning to perform some tests.

I'm playing around with SELECT txid_current(); right now - that should
be about the most specific load for setting clog bits.

Andres
On 2016-03-23 21:43:41 +0100, Andres Freund wrote:
> I'm playing around with SELECT txid_current(); right now - that should
> be about the most specific load for setting clog bits.

Or so I thought.

In my testing that showed just about zero performance difference between
the patch and master. And more surprisingly, profiling showed very
little contention on the control lock. Hacking
TransactionIdSetPageStatus() to return without doing anything, actually
only showed minor performance benefits.

[there's also the fact that txid_current() indirectly acquires two
lwlock twice, which showed up more prominently than control lock, but
that I could easily hack around by adding a xid_current().]

Similar with an INSERT only workload. And a small scale pgbench.


Looking through the thread showed that the positive results you'd posted
all were with relativey big scale factors. Which made me think. Running
a bigger pgbench showed that most the interesting (i.e. long) lock waits
were both via TransactionIdSetPageStatus *and* TransactionIdGetStatus().


So I think what happens is that once you have a big enough table, the
UPDATEs standard pgbench does start to often hit *old* xids (in unhinted
rows). Thus old pages have to be read in, potentially displacing slru
content needed very shortly after.


Have you, in your evaluation of the performance of this patch, done
profiles over time? I.e. whether the performance benefits are the
immediately, or only after a significant amount of test time? Comparing
TPS over time, for both patched/unpatched looks relevant.


Even after changing to scale 500, the performance benefits on this,
older 2 socket, machine were minor; even though contention on the
ClogControlLock was the second most severe (after ProcArrayLock).

Afaics that squares with Jesper's result, which basically also didn't
show a difference either way?


I'm afraid that this patch might be putting bandaid on some of the
absolutely worst cases, without actually addressing the core
problem. Simon's patch in [1] seems to come closer addressing that
(which I don't believe it's safe without going doing every status
manipulation atomically, as individual status bits are smaller than 4
bytes).  Now it's possibly to argue that the bandaid might slow the
bleeding to a survivable level, but I have to admit I'm doubtful.

Here's the stats for a -s 500 run btw:Performance counter stats for 'system wide':           18,747
probe_postgres:TransactionIdSetTreeStatus          68,884      probe_postgres:TransactionIdGetStatus            9,718
  probe_postgres:PGSemaphoreLock

(the PGSemaphoreLock is over 50% ProcArrayLock, followed by ~15%
SimpleLruReadPage_ReadOnly)


My suspicion is that a better approach for now would be to take Simon's
patch, but add a (per-page?) 'ClogModificationLock'; to avoid the need
of doing something fancier in TransactionIdSetStatusBit().

Andres

[1]:
http://archives.postgresql.org/message-id/CANP8%2Bj%2BimQfHxkChFyfnXDyi6k-arAzRV%2BZG-V_OFxEtJjOL2Q%40mail.gmail.com
Hi,

On 2016-03-24 01:10:55 +0100, Andres Freund wrote:
> I'm afraid that this patch might be putting bandaid on some of the
> absolutely worst cases, without actually addressing the core
> problem. Simon's patch in [1] seems to come closer addressing that
> (which I don't believe it's safe without going doing every status
> manipulation atomically, as individual status bits are smaller than 4
> bytes).  Now it's possibly to argue that the bandaid might slow the
> bleeding to a survivable level, but I have to admit I'm doubtful.
>
> Here's the stats for a -s 500 run btw:
>  Performance counter stats for 'system wide':
>             18,747      probe_postgres:TransactionIdSetTreeStatus
>             68,884      probe_postgres:TransactionIdGetStatus
>              9,718      probe_postgres:PGSemaphoreLock
> (the PGSemaphoreLock is over 50% ProcArrayLock, followed by ~15%
> SimpleLruReadPage_ReadOnly)
>
>
> My suspicion is that a better approach for now would be to take Simon's
> patch, but add a (per-page?) 'ClogModificationLock'; to avoid the need
> of doing something fancier in TransactionIdSetStatusBit().
>
> Andres
>
> [1]:
http://archives.postgresql.org/message-id/CANP8%2Bj%2BimQfHxkChFyfnXDyi6k-arAzRV%2BZG-V_OFxEtJjOL2Q%40mail.gmail.com

Simon, would you mind if I took your patch for a spin like roughly
suggested above?


Andres
>
> On 2016-03-23 21:43:41 +0100, Andres Freund wrote:
> > I'm playing around with SELECT txid_current(); right now - that should
> > be about the most specific load for setting clog bits.
>
> Or so I thought.
>
> In my testing that showed just about zero performance difference between
> the patch and master. And more surprisingly, profiling showed very
> little contention on the control lock. Hacking
> TransactionIdSetPageStatus() to return without doing anything, actually
> only showed minor performance benefits.
>
> [there's also the fact that txid_current() indirectly acquires two
> lwlock twice, which showed up more prominently than control lock, but
> that I could easily hack around by adding a xid_current().]
>
> Similar with an INSERT only workload. And a small scale pgbench.
>
>
> Looking through the thread showed that the positive results you'd posted
> all were with relativey big scale factors.
>
I have seen smaller benefits at 300 scale factor and somewhat larger benefits at 1000 scale factor. Also Mithun has done similar testing with unlogged tables and the results of same [1] also looks good.
>
> Which made me think. Running
> a bigger pgbench showed that most the interesting (i.e. long) lock waits
> were both via TransactionIdSetPageStatus *and* TransactionIdGetStatus().
>
>
> So I think what happens is that once you have a big enough table, the
> UPDATEs standard pgbench does start to often hit *old* xids (in unhinted
> rows). Thus old pages have to be read in, potentially displacing slru
> content needed very shortly after.
>
>
> Have you, in your evaluation of the performance of this patch, done
> profiles over time? I.e. whether the performance benefits are the
> immediately, or only after a significant amount of test time? Comparing
> TPS over time, for both patched/unpatched looks relevant.
>
>
> Even after changing to scale 500, the performance benefits on this,
> older 2 socket, machine were minor; even though contention on the
> ClogControlLock was the second most severe (after ProcArrayLock).
>
> Afaics that squares with Jesper's result, which basically also didn't
> show a difference either way?
>
>
> I'm afraid that this patch might be putting bandaid on some of the
> absolutely worst cases, without actually addressing the core
> problem. Simon's patch in [1] seems to come closer addressing that
> (which I don't believe it's safe without going doing every status
> manipulation atomically, as individual status bits are smaller than 4
> bytes). Now it's possibly to argue that the bandaid might slow the
> bleeding to a survivable level, but I have to admit I'm doubtful.
>
> Here's the stats for a -s 500 run btw:
> Performance counter stats for 'system wide':
> 18,747 probe_postgres:TransactionIdSetTreeStatus
> 68,884 probe_postgres:TransactionIdGetStatus
> 9,718 probe_postgres:PGSemaphoreLock
> (the PGSemaphoreLock is over 50% ProcArrayLock, followed by ~15%
> SimpleLruReadPage_ReadOnly)
>
>
> My suspicion is that a better approach for now would be to take Simon's
> patch, but add a (per-page?) 'ClogModificationLock'; to avoid the need
> of doing something fancier in TransactionIdSetStatusBit().
>
>
> On Thu, Mar 24, 2016 at 5:40 AM, Andres Freund <andres@anarazel.de> wrote:
> >
> > Even after changing to scale 500, the performance benefits on this,
> > older 2 socket, machine were minor; even though contention on the
> > ClogControlLock was the second most severe (after ProcArrayLock).
> >
>
>
> On Thu, Mar 24, 2016 at 5:40 AM, Andres Freund <andres@anarazel.de> wrote:
> >
> > Have you, in your evaluation of the performance of this patch, done
> > profiles over time? I.e. whether the performance benefits are the
> > immediately, or only after a significant amount of test time? Comparing
> > TPS over time, for both patched/unpatched looks relevant.
> >
>
> I have mainly done it with half-hour read-write tests. What do you want to observe via smaller tests, sometimes it gives inconsistent data for read-write tests?
>
I have done some tests on both intel and power m/c (configuration of which are mentioned at end-of-mail) to see the results at different time-intervals and it is always showing greater than 50% improvement in power m/c at 128 client-count and greater than 29% improvement in Intel m/c at 88 client-count.
| Time (minutes) | Base | Patch | % |
| 5 | 39978 | 51858 | 29.71 |
| 10 | 38169 | 52195 | 36.74 |
| 20 | 36992 | 52173 | 41.03 |
| 30 | 37042 | 52149 | 40.78 |
| Time (minutes) | Base | Patch | % |
| 5 | 42479 | 65655 | 54.55 |
| 10 | 41876 | 66050 | 57.72 |
| 20 | 38099 | 65200 | 71.13 |
| 30 | 37838 | 61908 | 63.61 |
> >
> > Even after changing to scale 500, the performance benefits on this,
> > older 2 socket, machine were minor; even though contention on the
> > ClogControlLock was the second most severe (after ProcArrayLock).
> >
>
> I have tried this patch on mainly 8 socket machine with 300 & 1000 scale factor. I am hoping that you have tried this test on unlogged tables and by the way at what client count, you have seen these results.
>
>
> On Thu, Mar 24, 2016 at 5:40 AM, Andres Freund <andres@anarazel.de> wrote:
> >
> > Even after changing to scale 500, the performance benefits on this,
> > older 2 socket, machine were minor; even though contention on the
> > ClogControlLock was the second most severe (after ProcArrayLock).
> >
>
> I have tried this patch on mainly 8 socket machine with 300 & 1000 scale factor. I am hoping that you have tried this test on unlogged tables and by the way at what client count, you have seen these results.
>
> > Afaics that squares with Jesper's result, which basically also didn't
> > show a difference either way?
> >
>
> One difference was that I think Jesper has done testing with synchronous_commit mode as off whereas my tests were with synchronous commit mode on.
>
>
> On Thu, Sep 3, 2015 at 5:11 PM, Andres Freund <andres@anarazel.de> wrote:
> >
>
> Updated comments and the patch (increate_clog_bufs_v2.patch)
> containing the same is attached.
>
| Patch_Ver/Client_Count | 1 | 64 |
| HEAD | 12677 | 57470 |
| Patch-1 | 12305 | 58079 |
| Patch-2 | 12761 | 58637 |
Вложения
On 2016-03-28 22:50:49 +0530, Amit Kapila wrote:
> On Fri, Sep 11, 2015 at 8:01 PM, Amit Kapila <amit.kapila16@gmail.com>
> wrote:
> >
> > On Thu, Sep 3, 2015 at 5:11 PM, Andres Freund <andres@anarazel.de> wrote:
> > >
> >
> > Updated comments and the patch (increate_clog_bufs_v2.patch)
> > containing the same is attached.
> >
>
> Andres mentioned to me in off-list discussion, that he thinks we should
> first try to fix the clog buffers problem as he sees in his tests that clog
> buffer replacement is one of the bottlenecks. He also suggested me a test
> to see if the increase in buffers could lead to regression.  The basic idea
> of test was to ensure every access on clog access to be a disk one.  Based
> on his suggestion, I have written a SQL statement which will allow every
> access of CLOG to be a disk access and the query used for same is as below:
> With ins AS (INSERT INTO test_clog_access values(default) RETURNING c1)
> Select * from test_clog_access where c1 = (Select c1 from ins) - 32768 *
> :client_id;
>
> Test Results
> ---------------------
> HEAD - commit d12e5bb7 Clog Buffers - 32
> Patch-1 - Clog Buffers - 64
> Patch-2 - Clog Buffers - 128
>
>
> Patch_Ver/Client_Count 1 64
> HEAD 12677 57470
> Patch-1 12305 58079
> Patch-2 12761 58637
>
> Above data is a median of 3 10-min runs.  Above data indicates that there
> is no substantial dip in increasing clog buffers.
>
> Test scripts used in testing are attached with this mail.  In
> perf_clog_access.sh, you need to change data_directory path as per your
> m/c, also you might want to change the binary name, if you want to create
> postgres binaries with different names.
>
> Andres, Is this test inline with what you have in mind?

Yes. That looks good. My testing shows that increasing the number of
buffers can increase both throughput and reduce latency variance. The
former is a smaller effect with one of the discussed patches applied,
the latter seems to actually increase in scale (with increased
throughput).


I've attached patches to:
0001: Increase the max number of clog buffers
0002: Implement 64bit atomics fallback and optimize read/write
0003: Edited version of Simon's clog scalability patch

WRT 0003 - still clearly WIP - I've:
- made group_lsn pg_atomic_u64*, to allow for tear-free reads
- split content from IO lock
- made SimpleLruReadPage_optShared always return with only share lock
  held
- Implement a different, experimental, concurrency model for
  SetStatusBit using cmpxchg. A define USE_CONTENT_LOCK controls which
  bit is used.

I've tested this and saw this outperform Amit's approach. Especially so
when using a read/write mix, rather then only reads. I saw over 30%
increase on a large EC2 instance with -btpcb-like@1 -bselect-only@3. But
that's in a virtualized environment, not very good for reproducability.

Amit, could you run benchmarks on your bigger hardware? Both with
USE_CONTENT_LOCK commented out and in?

I think we should go for 1) and 2) unconditionally. And then evaluate
whether to go with your, or 3) from above. If the latter, we've to do
some cleanup :)

Greetings,

Andres Freund
Вложения
>
> On 2016-03-28 22:50:49 +0530, Amit Kapila wrote:
> > On Fri, Sep 11, 2015 at 8:01 PM, Amit Kapila <amit.kapila16@gmail.com>
> > wrote:
> > >
>
> Amit, could you run benchmarks on your bigger hardware? Both with
> USE_CONTENT_LOCK commented out and in?
>
> I think we should go for 1) and 2) unconditionally.
Size
CLOGShmemBuffers(void)
{
- return Min(32, Max(4, NBuffers / 512));
+ return Min(128, Max(4, NBuffers / 512));
}
> whether to go with your, or 3) from above. If the latter, we've to do
> some cleanup :)
>
Вложения
On 2016-03-31 15:07:22 +0530, Amit Kapila wrote:
> On Thu, Mar 31, 2016 at 4:39 AM, Andres Freund <andres@anarazel.de> wrote:
> >
> > On 2016-03-28 22:50:49 +0530, Amit Kapila wrote:
> > > On Fri, Sep 11, 2015 at 8:01 PM, Amit Kapila <amit.kapila16@gmail.com>
> > > wrote:
> > > >
> >
> > Amit, could you run benchmarks on your bigger hardware? Both with
> > USE_CONTENT_LOCK commented out and in?
> >
>
> Yes.

Cool.


> > I think we should go for 1) and 2) unconditionally.

> Yes, that makes sense.  On 20 min read-write pgbench --unlogged-tables
> benchmark, I see that with HEAD Tps is 36241 and with increase the clog
> buffers patch, Tps is 69340 at 128 client count (very good performance
> boost) which indicates that we should go ahead with 1) and 2) patches.

Especially considering the line count... I do wonder about going crazy
and increasing to 256 immediately. It otherwise seems likely that we'll
have the the same issue in a year.  Could you perhaps run your test
against that as well?


> I think we should change comments on top of this function.

Yes, definitely.


> 0001-Improve-64bit-atomics-support
>
> +#if 0
> +#ifndef PG_HAVE_ATOMIC_READ_U64
> +#define PG_HAVE_ATOMIC_READ_U64
> +static inline uint64
>
> What the purpose of above #if 0?  Other than that patch looks good to me.

I think I was investigating something. Other than that obviously there's
no point. Sorry for that.

Greetings,

Andres Freund
>
> On 2016-03-31 15:07:22 +0530, Amit Kapila wrote:
> > On Thu, Mar 31, 2016 at 4:39 AM, Andres Freund <andres@anarazel.de> wrote:
> > >
> > > On 2016-03-28 22:50:49 +0530, Amit Kapila wrote:
> > > > On Fri, Sep 11, 2015 at 8:01 PM, Amit Kapila <amit.kapila16@gmail.com>
> > > > wrote:
> > > > >
> > >
> > > Amit, could you run benchmarks on your bigger hardware? Both with
> > > USE_CONTENT_LOCK commented out and in?
> > >
> >
> > Yes.
>
> Cool.
>
>
> > > I think we should go for 1) and 2) unconditionally.
>
> > Yes, that makes sense. On 20 min read-write pgbench --unlogged-tables
> > benchmark, I see that with HEAD Tps is 36241 and with increase the clog
> > buffers patch, Tps is 69340 at 128 client count (very good performance
> > boost) which indicates that we should go ahead with 1) and 2) patches.
>
> Especially considering the line count... I do wonder about going crazy
> and increasing to 256 immediately. It otherwise seems likely that we'll
> have the the same issue in a year. Could you perhaps run your test
> against that as well?
>
On 2016-03-31 17:52:12 +0530, Amit Kapila wrote:
> On Thu, Mar 31, 2016 at 3:48 PM, Andres Freund <andres@anarazel.de> wrote:
> >
> > On 2016-03-31 15:07:22 +0530, Amit Kapila wrote:
> > > On Thu, Mar 31, 2016 at 4:39 AM, Andres Freund <andres@anarazel.de>
> wrote:
> > > >
> > > > On 2016-03-28 22:50:49 +0530, Amit Kapila wrote:
> > > > > On Fri, Sep 11, 2015 at 8:01 PM, Amit Kapila <
> amit.kapila16@gmail.com>
> > > > > wrote:
> > > > > >
> > > >
> > > > Amit, could you run benchmarks on your bigger hardware? Both with
> > > > USE_CONTENT_LOCK commented out and in?
> > > >
> > >
> > > Yes.
> >
> > Cool.
> >
> >
> > > > I think we should go for 1) and 2) unconditionally.
> >
> > > Yes, that makes sense.  On 20 min read-write pgbench --unlogged-tables
> > > benchmark, I see that with HEAD Tps is 36241 and with increase the clog
> > > buffers patch, Tps is 69340 at 128 client count (very good performance
> > > boost) which indicates that we should go ahead with 1) and 2) patches.
> >
> > Especially considering the line count... I do wonder about going crazy
> > and increasing to 256 immediately. It otherwise seems likely that we'll
> > have the the same issue in a year.  Could you perhaps run your test
> > against that as well?
> >
>
> Unfortunately, it dipped to 65005 with 256 clog bufs.  So I think 128 is
> appropriate number.

Ah, interesting. Then let's go with that.
Hi,

On 03/30/2016 07:09 PM, Andres Freund wrote:
> Yes. That looks good. My testing shows that increasing the number of
> buffers can increase both throughput and reduce latency variance. The
> former is a smaller effect with one of the discussed patches applied,
> the latter seems to actually increase in scale (with increased
> throughput).
>
>
> I've attached patches to:
> 0001: Increase the max number of clog buffers
> 0002: Implement 64bit atomics fallback and optimize read/write
> 0003: Edited version of Simon's clog scalability patch
>
> WRT 0003 - still clearly WIP - I've:
> - made group_lsn pg_atomic_u64*, to allow for tear-free reads
> - split content from IO lock
> - made SimpleLruReadPage_optShared always return with only share lock
>    held
> - Implement a different, experimental, concurrency model for
>    SetStatusBit using cmpxchg. A define USE_CONTENT_LOCK controls which
>    bit is used.
>
> I've tested this and saw this outperform Amit's approach. Especially so
> when using a read/write mix, rather then only reads. I saw over 30%
> increase on a large EC2 instance with -btpcb-like@1 -bselect-only@3. But
> that's in a virtualized environment, not very good for reproducability.
>
> Amit, could you run benchmarks on your bigger hardware? Both with
> USE_CONTENT_LOCK commented out and in?
>
> I think we should go for 1) and 2) unconditionally. And then evaluate
> whether to go with your, or 3) from above. If the latter, we've to do
> some cleanup :)
>

I have been testing Amit's patch in various setups and work loads, with
up to 400 connections on a 2 x Xeon E5-2683 (28C/56T @ 2 GHz), not
seeing an improvement, but no regression either.

Testing with 0001 and 0002 do show up to a 5% improvement when using a
HDD for data + wal - about 1% when using 2 x RAID10 SSD - unlogged.

I can do a USE_CONTENT_LOCK run on 0003 if it is something for 9.6.

Thanks for your work on this !

Best regards, Jesper
On March 31, 2016 11:13:46 PM GMT+02:00, Jesper Pedersen <jesper.pedersen@redhat.com> wrote:

>I can do a USE_CONTENT_LOCK run on 0003 if it is something for 9.6.

Yes please. I think the lock variant is realistic, the lockless did isn't.
--
Sent from my Android device with K-9 Mail. Please excuse my brevity.
Hi,

On 03/31/2016 06:21 PM, Andres Freund wrote:
> On March 31, 2016 11:13:46 PM GMT+02:00, Jesper Pedersen <jesper.pedersen@redhat.com> wrote:
>
>> I can do a USE_CONTENT_LOCK run on 0003 if it is something for 9.6.
>
> Yes please. I think the lock variant is realistic, the lockless did isn't.
>

I have done a run with -M prepared on unlogged running 10min per data
point, up to 300 connections. Using data + wal on HDD.

I'm not seeing a difference between with and without USE_CONTENT_LOCK --
all points are within +/- 0.5%.

Let me know if there are other tests I can perform.

Best regards, Jesper
On April 1, 2016 10:25:51 PM GMT+02:00, Jesper Pedersen <jesper.pedersen@redhat.com> wrote:
>Hi,
>
>On 03/31/2016 06:21 PM, Andres Freund wrote:
>> On March 31, 2016 11:13:46 PM GMT+02:00, Jesper Pedersen
><jesper.pedersen@redhat.com> wrote:
>>
>>> I can do a USE_CONTENT_LOCK run on 0003 if it is something for 9.6.
>>
>> Yes please. I think the lock variant is realistic, the lockless did
>isn't.
>>
>
>I have done a run with -M prepared on unlogged running 10min per data
>point, up to 300 connections. Using data + wal on HDD.
>
>I'm not seeing a difference between with and without USE_CONTENT_LOCK
>--
>all points are within +/- 0.5%.
>
>Let me know if there are other tests I can perform

How do either compare to just 0002 applied?

Thanks!
--
Sent from my Android device with K-9 Mail. Please excuse my brevity.
>
> On 2016-03-31 15:07:22 +0530, Amit Kapila wrote:
> > On Thu, Mar 31, 2016 at 4:39 AM, Andres Freund <andres@anarazel.de> wrote:
> > >
> > > On 2016-03-28 22:50:49 +0530, Amit Kapila wrote:
> > > > On Fri, Sep 11, 2015 at 8:01 PM, Amit Kapila <amit.kapila16@gmail.com>
> > > > wrote:
> > > > >
> > >
> > > Amit, could you run benchmarks on your bigger hardware? Both with
> > > USE_CONTENT_LOCK commented out and in?
> > >
> >
> > Yes.
>
> Cool.
>
| Client Count/No. Of Runs (tps) | 2 | 64 | 128 |
| HEAD+clog_buf_128 | 4930 | 66754 | 68818 |
| group_clog_v8 | 5753 | 69002 | 78843 |
| content_lock | 5668 | 70134 | 70501 |
| nocontent_lock | 4787 | 69531 | 70663 |
On 04/01/2016 04:39 PM, Andres Freund wrote:
> On April 1, 2016 10:25:51 PM GMT+02:00, Jesper Pedersen <jesper.pedersen@redhat.com> wrote:
>> Hi,
>>
>> On 03/31/2016 06:21 PM, Andres Freund wrote:
>>> On March 31, 2016 11:13:46 PM GMT+02:00, Jesper Pedersen
>> <jesper.pedersen@redhat.com> wrote:
>>>
>>>> I can do a USE_CONTENT_LOCK run on 0003 if it is something for 9.6.
>>>
>>> Yes please. I think the lock variant is realistic, the lockless did
>> isn't.
>>>
>>
>> I have done a run with -M prepared on unlogged running 10min per data
>> point, up to 300 connections. Using data + wal on HDD.
>>
>> I'm not seeing a difference between with and without USE_CONTENT_LOCK
>> --
>> all points are within +/- 0.5%.
>>
>> Let me know if there are other tests I can perform
>
> How do either compare to just 0002 applied?
>

0001 + 0002 compared to 0001 + 0002 + 0003 (either way) were pretty much
the same +/- 0.5% on the HDD run.

Best regards, Jesper
On 04/01/2016 04:39 PM, Andres Freund wrote:On April 1, 2016 10:25:51 PM GMT+02:00, Jesper Pedersen <jesper.pedersen@redhat.com> wrote:Hi,
On 03/31/2016 06:21 PM, Andres Freund wrote:On March 31, 2016 11:13:46 PM GMT+02:00, Jesper Pedersen<jesper.pedersen@redhat.com> wrote:isn't.I can do a USE_CONTENT_LOCK run on 0003 if it is something for 9.6.
Yes please. I think the lock variant is realistic, the lockless did
I have done a run with -M prepared on unlogged running 10min per data
point, up to 300 connections. Using data + wal on HDD.
I'm not seeing a difference between with and without USE_CONTENT_LOCK
--
all points are within +/- 0.5%.
Let me know if there are other tests I can perform
How do either compare to just 0002 applied?
0001 + 0002 compared to 0001 + 0002 + 0003 (either way) were pretty much the same +/- 0.5% on the HDD run.
On Thu, Mar 31, 2016 at 3:48 PM, Andres Freund <andres@anarazel.de> wrote:Here is the performance data (configuration of machine used to perform this test is mentioned at end of mail):Non-default parameters------------------------------------max_connections = 300shared_buffers=8GBmin_wal_size=10GBmax_wal_size=15GBcheckpoint_timeout =35minmaintenance_work_mem = 1GBcheckpoint_completion_target = 0.9wal_buffers = 256MBmedian of 3, 20-min pgbench tpc-b results for --unlogged-tables
| Client Count/Patch_ver (tps) | 2 | 128 | 256 |
| HEAD – Commit 2143f5e1 | 2832 | 35001 | 26756 |
| clog_buf_128 | 2909 | 50685 | 40998 |
| clog_buf_128 +group_update_clog_v8 | 2981 | 53043 | 50779 |
| clog_buf_128 +content_lock | 2843 | 56261 | 54059 |
| clog_buf_128 +nocontent_lock | 2630 | 56554 | 54429 |
Hi,

On 2016-04-07 09:14:00 +0530, Amit Kapila wrote:
> On Sat, Apr 2, 2016 at 5:25 PM, Amit Kapila <amit.kapila16@gmail.com> wrote:
> I have ran exactly same test on intel x86 m/c and the results are as below:

Thanks for running these tests!

> Client Count/Patch_ver (tps) 2 128 256
> HEAD – Commit 2143f5e1 2832 35001 26756
> clog_buf_128 2909 50685 40998
> clog_buf_128 +group_update_clog_v8 2981 53043 50779
> clog_buf_128 +content_lock 2843 56261 54059
> clog_buf_128 +nocontent_lock 2630 56554 54429

Interesting.

could you perhaps also run a test with -btpcb-like@1 -bselect-only@3?
That much represents real world loads, and it's where I saw simon's
approach outshining yours considerably...

Greetings,

Andres Freund
>
> Hi,
>
> On 2016-04-07 09:14:00 +0530, Amit Kapila wrote:
> > On Sat, Apr 2, 2016 at 5:25 PM, Amit Kapila <amit.kapila16@gmail.com> wrote:
> > I have ran exactly same test on intel x86 m/c and the results are as below:
>
> Thanks for running these tests!
>
> > Client Count/Patch_ver (tps) 2 128 256
> > HEAD – Commit 2143f5e1 2832 35001 26756
> > clog_buf_128 2909 50685 40998
> > clog_buf_128 +group_update_clog_v8 2981 53043 50779
> > clog_buf_128 +content_lock 2843 56261 54059
> > clog_buf_128 +nocontent_lock 2630 56554 54429
>
> Interesting.
>
> could you perhaps also run a test with -btpcb-like@1 -bselect-only@3?
>
| Client Count/Patch_ver (tps) | 256 |
| clog_buf_128 | 40617 |
| clog_buf_128 +group_clog_v8 | 51137 |
| clog_buf_128 +content_lock | 54188 |
For -b select-only@3, I have done quicktest for each version and number is same 62K~63K for all version, why do you think this will improve select-only workload?
On 2016-04-07 18:40:14 +0530, Amit Kapila wrote:
> On Thu, Apr 7, 2016 at 10:16 AM, Andres Freund <andres@anarazel.de> wrote:
> >
> > Hi,
> >
> > On 2016-04-07 09:14:00 +0530, Amit Kapila wrote:
> > > On Sat, Apr 2, 2016 at 5:25 PM, Amit Kapila <amit.kapila16@gmail.com>
> wrote:
> > > I have ran exactly same test on intel x86 m/c and the results are as
> below:
> >
> > Thanks for running these tests!
> >
> > > Client Count/Patch_ver (tps) 2 128 256
> > > HEAD – Commit 2143f5e1 2832 35001 26756
> > > clog_buf_128 2909 50685 40998
> > > clog_buf_128 +group_update_clog_v8 2981 53043 50779
> > > clog_buf_128 +content_lock 2843 56261 54059
> > > clog_buf_128 +nocontent_lock 2630 56554 54429
> >
> > Interesting.
> >
> > could you perhaps also run a test with -btpcb-like@1 -bselect-only@3?

> This is the data with -b tpcb-like@1 with 20-min run for each version and I
> could see almost similar results as the data posted in previous e-mail.
>
> Client Count/Patch_ver (tps) 256
> clog_buf_128 40617
> clog_buf_128 +group_clog_v8 51137
> clog_buf_128 +content_lock 54188
>
> For -b select-only@3,  I have done quicktest for each version and number is
> same 62K~63K for all version, why do you think this will improve
> select-only workload?

What I was looking for was pgbench with both -btpcb-like@1
-bselect-only@3 specified; i.e. a mixed read/write test. In my
measurement that's where Simon's approach shines (not surprising if you
look at the way it works), and it's of immense practical importance -
most workloads are mixed.

Regards,

Andres
>
> On 2016-04-07 18:40:14 +0530, Amit Kapila wrote:
> > This is the data with -b tpcb-like@1 with 20-min run for each version and I
> > could see almost similar results as the data posted in previous e-mail.
> >
> > Client Count/Patch_ver (tps) 256
> > clog_buf_128 40617
> > clog_buf_128 +group_clog_v8 51137
> > clog_buf_128 +content_lock 54188
> >
> > For -b select-only@3, I have done quicktest for each version and number is
> > same 62K~63K for all version, why do you think this will improve
> > select-only workload?
>
> What I was looking for was pgbench with both -btpcb-like@1
> -bselect-only@3 specified; i.e. a mixed read/write test.
>
What I was looking for was pgbench with both -btpcb-like@1On 2016-04-07 18:40:14 +0530, Amit Kapila wrote:
> This is the data with -b tpcb-like@1 with 20-min run for each version and I
> could see almost similar results as the data posted in previous e-mail.
>
> Client Count/Patch_ver (tps) 256
> clog_buf_128 40617
> clog_buf_128 +group_clog_v8 51137
> clog_buf_128 +content_lock 54188
>
> For -b select-only@3, I have done quicktest for each version and number is
> same 62K~63K for all version, why do you think this will improve
> select-only workload?
-bselect-only@3 specified; i.e. a mixed read/write test.
| Client Count/Patch_ver (tps) | 256 |
| clog_buf_128 | 110630 |
| clog_buf_128 +group_clog_v8 | 111575 |
| clog_buf_128 +content_lock | 96581 |
In my
measurement that's where Simon's approach shines (not surprising if you
look at the way it works), and it's of immense practical importance -
most workloads are mixed.
Вложения
On 2016-03-31 15:07:22 +0530, Amit Kapila wrote:
> I think we should change comments on top of this function.  I have changed
> the comments as per my previous patch and attached the modified patch with
> this mail, see if that makes sense.

I've applied this patch.

Regards,

Andres
On 2016-04-08 13:07:05 +0530, Amit Kapila wrote:
> I think by now, we have done many tests with both approaches and we find
> that in some cases, it is slightly better and in most cases it is neutral
> and in some cases it is worse than group clog approach.  I feel we should
> go with group clog approach now as that has been tested and reviewed
> multiple times and in future if we find that other approach is giving
> substantial gain, then we can anyway change it.

I think that's a discussion for the 9.7 cycle unfortunately. I've now
pushed the #clog-buffers patch; that's going to help the worst cases.

Greetings,

Andres Freund
>
> On 2016-03-31 15:07:22 +0530, Amit Kapila wrote:
> > I think we should change comments on top of this function. I have changed
> > the comments as per my previous patch and attached the modified patch with
> > this mail, see if that makes sense.
>
> I've applied this patch.
>
Thanks!
Hi,

This thread started a year ago, different people contributed various
patches, some of which already got committed. Can someone please post a
summary of this thread, so that it's a bit more clear what needs
review/testing, what are the main open questions and so on?

I'm interested in doing some tests on the hardware I have available, but
I'm not willing spending my time untangling the discussion.

thanks

--
Tomas Vondra                  http://www.2ndQuadrant.com
PostgreSQL Development, 24x7 Support, Remote DBA, Training & Services
On Mon, Sep 5, 2016 at 3:18 AM, Tomas Vondra
<tomas.vondra@2ndquadrant.com> wrote:
> Hi,
>
> This thread started a year ago, different people contributed various
> patches, some of which already got committed. Can someone please post a
> summary of this thread, so that it's a bit more clear what needs
> review/testing, what are the main open questions and so on?
>

Okay, let me try to summarize this thread.  This thread started off to
ameliorate the CLOGControlLock contention with a patch to increase the
clog buffers to 128 (which got committed in 9.6).   Then the second
patch was developed to use Group mode to further reduce the
CLOGControlLock contention, latest version of which is upthread [1] (I
have checked that version still gets applied).  Then Andres suggested
to compare the Group lock mode approach with an alternative (more
granular) locking model approach for which he has posted patches
upthread [2].  There are three patches on that link, the patches of
interest are 0001-Improve-64bit-atomics-support and
0003-Use-a-much-more-granular-locking-model-for-the-clog-.  I have
checked that second one of those doesn't get applied, so I have
rebased it and attached it with this mail.  In the more granular
locking approach, actually, you can comment USE_CONTENT_LOCK to make
it use atomic operations (I could not compile it by disabling
USE_CONTENT_LOCK on my windows box, you can try by commenting that as
well, if it works for you).  So, in short we have to compare three
approaches here.

1) Group mode to reduce CLOGControlLock contention
2) Use granular locking model
3) Use atomic operations

For approach-1, you can use patch [1].  For approach-2, you can use
0001-Improve-64bit-atomics-support patch[2] and the patch attached
with this mail.  For approach-3, you can use
0001-Improve-64bit-atomics-support patch[2] and the patch attached
with this mail by commenting USE_CONTENT_LOCK.  If the third doesn't
work for you then for now we can compare approach-1 and approach-2.

I have done some testing of these patches for read-write pgbench
workload and doesn't find big difference.  Now the interesting test
case could be to use few sub-transactions (may be 4-8) for each
transaction as with that we can see more contention for
CLOGControlLock.

Few points to note for performance testing, one should use --unlogged
tables, else the WAL writing and WALWriteLock contention masks the
impact of this patch.  The impact of this patch is visible at
higher-client counts (say at 64~128).

> I'm interested in doing some tests on the hardware I have available, but
> I'm not willing spending my time untangling the discussion.
>

Thanks for showing the interest and let me know if something is still
un-clear or you need more information to proceed.


[1] - https://www.postgresql.org/message-id/CAA4eK1%2B8gQTyGSZLe1Rb7jeM1Beh4FqA4VNjtpZcmvwizDQ0hw%40mail.gmail.com
[2] - https://www.postgresql.org/message-id/20160330230914.GH13305%40awork2.anarazel.de

--
With Regards,
Amit Kapila.
EnterpriseDB: http://www.enterprisedb.com
Вложения
Hi,
This thread started a year ago, different people contributed various
patches, some of which already got committed. Can someone please post a
summary of this thread, so that it's a bit more clear what needs
review/testing, what are the main open questions and so on?
I'm interested in doing some tests on the hardware I have available, but
I'm not willing spending my time untangling the discussion.
Does that sound correct? Or do we already know which implementation is more likely to be pursued, in which case I can start reviewing that patch.
PostgreSQL Development, 24x7 Support, Training & Services
On Mon, Sep 5, 2016 at 2:00 PM, Pavan Deolasee <pavan.deolasee@gmail.com> wrote:
>
>
> On Mon, Sep 5, 2016 at 3:18 AM, Tomas Vondra <tomas.vondra@2ndquadrant.com>
> wrote:
>>
>> Hi,
>>
>> This thread started a year ago, different people contributed various
>> patches, some of which already got committed. Can someone please post a
>> summary of this thread, so that it's a bit more clear what needs
>> review/testing, what are the main open questions and so on?
>>
>> I'm interested in doing some tests on the hardware I have available, but
>> I'm not willing spending my time untangling the discussion.
>>
>
> I signed up for reviewing this patch. But as Amit explained later, there are
> two different and independent implementations to solve the problem. Since
> Tomas has volunteered to do some benchmarking, I guess I should wait for the
> results because that might influence which approach we choose.
>
> Does that sound correct?
>

Sounds correct to me.

--
With Regards,
Amit Kapila.
EnterpriseDB: http://www.enterprisedb.com
On 09/05/2016 06:03 AM, Amit Kapila wrote:
> On Mon, Sep 5, 2016 at 3:18 AM, Tomas Vondra
> <tomas.vondra@2ndquadrant.com> wrote:
>> Hi,
>>
>> This thread started a year ago, different people contributed various
>> patches, some of which already got committed. Can someone please post a
>> summary of this thread, so that it's a bit more clear what needs
>> review/testing, what are the main open questions and so on?
>>
>
> Okay, let me try to summarize this thread.  This thread started off to
> ameliorate the CLOGControlLock contention with a patch to increase the
> clog buffers to 128 (which got committed in 9.6).   Then the second
> patch was developed to use Group mode to further reduce the
> CLOGControlLock contention, latest version of which is upthread [1] (I
> have checked that version still gets applied).  Then Andres suggested
> to compare the Group lock mode approach with an alternative (more
> granular) locking model approach for which he has posted patches
> upthread [2].  There are three patches on that link, the patches of
> interest are 0001-Improve-64bit-atomics-support and
> 0003-Use-a-much-more-granular-locking-model-for-the-clog-.  I have
> checked that second one of those doesn't get applied, so I have
> rebased it and attached it with this mail.  In the more granular
> locking approach, actually, you can comment USE_CONTENT_LOCK to make
> it use atomic operations (I could not compile it by disabling
> USE_CONTENT_LOCK on my windows box, you can try by commenting that as
> well, if it works for you).  So, in short we have to compare three
> approaches here.
>
> 1) Group mode to reduce CLOGControlLock contention
> 2) Use granular locking model
> 3) Use atomic operations
>
> For approach-1, you can use patch [1].  For approach-2, you can use
> 0001-Improve-64bit-atomics-support patch[2] and the patch attached
> with this mail.  For approach-3, you can use
> 0001-Improve-64bit-atomics-support patch[2] and the patch attached
> with this mail by commenting USE_CONTENT_LOCK.  If the third doesn't
> work for you then for now we can compare approach-1 and approach-2.
>

OK, I can compile all three cases - but onl with gcc 4.7 or newer. Sadly
the 4-socket 64-core machine runs Debian Jessie with just gcc 4.6 and my
attempts to update to a newer version were unsuccessful so far.

> I have done some testing of these patches for read-write pgbench
> workload and doesn't find big difference.  Now the interesting test
> case could be to use few sub-transactions (may be 4-8) for each
> transaction as with that we can see more contention for
> CLOGControlLock.

Understood. So a bunch of inserts/updates interleaved by savepoints?

I presume you started looking into this based on a real-world
performance issue, right? Would that be a good test case?

>
> Few points to note for performance testing, one should use --unlogged
> tables, else the WAL writing and WALWriteLock contention masks the
> impact of this patch.  The impact of this patch is visible at
> higher-client counts (say at 64~128).
>

Even on good hardware (say, PCIe SSD storage that can do thousands of
fsyncs per second)? Does it then make sense to try optimizing this if
the effect can only be observed without the WAL overhead (so almost
never in practice)?

regards

--
Tomas Vondra                  http://www.2ndQuadrant.com
PostgreSQL Development, 24x7 Support, Remote DBA, Training & Services
On Mon, Sep 5, 2016 at 11:34 PM, Tomas Vondra
<tomas.vondra@2ndquadrant.com> wrote:
>
>
> On 09/05/2016 06:03 AM, Amit Kapila wrote:
>>  So, in short we have to compare three
>> approaches here.
>>
>> 1) Group mode to reduce CLOGControlLock contention
>> 2) Use granular locking model
>> 3) Use atomic operations
>>
>> For approach-1, you can use patch [1].  For approach-2, you can use
>> 0001-Improve-64bit-atomics-support patch[2] and the patch attached
>> with this mail.  For approach-3, you can use
>> 0001-Improve-64bit-atomics-support patch[2] and the patch attached
>> with this mail by commenting USE_CONTENT_LOCK.  If the third doesn't
>> work for you then for now we can compare approach-1 and approach-2.
>>
>
> OK, I can compile all three cases - but onl with gcc 4.7 or newer. Sadly
> the 4-socket 64-core machine runs Debian Jessie with just gcc 4.6 and my
> attempts to update to a newer version were unsuccessful so far.
>

So which all patches your are able to compile on 4-socket m/c?  I
think it is better to measure the performance on bigger machine.

>> I have done some testing of these patches for read-write pgbench
>> workload and doesn't find big difference.  Now the interesting test
>> case could be to use few sub-transactions (may be 4-8) for each
>> transaction as with that we can see more contention for
>> CLOGControlLock.
>
> Understood. So a bunch of inserts/updates interleaved by savepoints?
>

Yes.

> I presume you started looking into this based on a real-world
> performance issue, right? Would that be a good test case?
>

I had started looking into it based on LWLOCK_STATS data for
read-write workload (pgbench tpc-b).  I think it will depict many of
the real-world read-write workloads.

>>
>> Few points to note for performance testing, one should use --unlogged
>> tables, else the WAL writing and WALWriteLock contention masks the
>> impact of this patch.  The impact of this patch is visible at
>> higher-client counts (say at 64~128).
>>
>
> Even on good hardware (say, PCIe SSD storage that can do thousands of
> fsyncs per second)?

Not sure, because it could be masked by WALWriteLock contention.

> Does it then make sense to try optimizing this if
> the effect can only be observed without the WAL overhead (so almost
> never in practice)?
>

It is not that there is no improvement with WAL overhead (like one can
observe that via LWLOCK_STATS apart from TPS), but it is clearly
visible with unlogged tables.  The situation is not that simple,
because let us say we don't do anything for the remaining contention
for CLOGControlLock, then when we try to reduce the contention around
other locks like WALWriteLock or may be ProcArrayLock, there is a
chance that contention will shift to CLOGControlLock.  So, the basic
idea is to get the big benefits, we need to eliminate contention
around each of the locks.


--
With Regards,
Amit Kapila.
EnterpriseDB: http://www.enterprisedb.com
On 09/06/2016 04:49 AM, Amit Kapila wrote:
> On Mon, Sep 5, 2016 at 11:34 PM, Tomas Vondra
> <tomas.vondra@2ndquadrant.com> wrote:
>>
>>
>> On 09/05/2016 06:03 AM, Amit Kapila wrote:
>>>  So, in short we have to compare three
>>> approaches here.
>>>
>>> 1) Group mode to reduce CLOGControlLock contention
>>> 2) Use granular locking model
>>> 3) Use atomic operations
>>>
>>> For approach-1, you can use patch [1].  For approach-2, you can use
>>> 0001-Improve-64bit-atomics-support patch[2] and the patch attached
>>> with this mail.  For approach-3, you can use
>>> 0001-Improve-64bit-atomics-support patch[2] and the patch attached
>>> with this mail by commenting USE_CONTENT_LOCK.  If the third doesn't
>>> work for you then for now we can compare approach-1 and approach-2.
>>>
>>
>> OK, I can compile all three cases - but onl with gcc 4.7 or newer. Sadly
>> the 4-socket 64-core machine runs Debian Jessie with just gcc 4.6 and my
>> attempts to update to a newer version were unsuccessful so far.
>>
>
> So which all patches your are able to compile on 4-socket m/c?  I
> think it is better to measure the performance on bigger machine.

Oh, sorry - I forgot to mention that only the last test (with
USE_CONTENT_LOCK commented out) fails to compile, because the functions
for atomics were added in gcc-4.7.


regards

--
Tomas Vondra                  http://www.2ndQuadrant.com
PostgreSQL Development, 24x7 Support, Remote DBA, Training & Services
On Wed, Sep 7, 2016 at 1:08 AM, Tomas Vondra
<tomas.vondra@2ndquadrant.com> wrote:
> On 09/06/2016 04:49 AM, Amit Kapila wrote:
>> On Mon, Sep 5, 2016 at 11:34 PM, Tomas Vondra
>> <tomas.vondra@2ndquadrant.com> wrote:
>>>
>>>
>>> On 09/05/2016 06:03 AM, Amit Kapila wrote:
>>>>  So, in short we have to compare three
>>>> approaches here.
>>>>
>>>> 1) Group mode to reduce CLOGControlLock contention
>>>> 2) Use granular locking model
>>>> 3) Use atomic operations
>>>>
>>>> For approach-1, you can use patch [1].  For approach-2, you can use
>>>> 0001-Improve-64bit-atomics-support patch[2] and the patch attached
>>>> with this mail.  For approach-3, you can use
>>>> 0001-Improve-64bit-atomics-support patch[2] and the patch attached
>>>> with this mail by commenting USE_CONTENT_LOCK.  If the third doesn't
>>>> work for you then for now we can compare approach-1 and approach-2.
>>>>
>>>
>>> OK, I can compile all three cases - but onl with gcc 4.7 or newer. Sadly
>>> the 4-socket 64-core machine runs Debian Jessie with just gcc 4.6 and my
>>> attempts to update to a newer version were unsuccessful so far.
>>>
>>
>> So which all patches your are able to compile on 4-socket m/c?  I
>> think it is better to measure the performance on bigger machine.
>
> Oh, sorry - I forgot to mention that only the last test (with
> USE_CONTENT_LOCK commented out) fails to compile, because the functions
> for atomics were added in gcc-4.7.
>

No issues, in that case we can leave the last test for now and do it later.

--
With Regards,
Amit Kapila.
EnterpriseDB: http://www.enterprisedb.com
On 09/07/2016 01:13 PM, Amit Kapila wrote:
> On Wed, Sep 7, 2016 at 1:08 AM, Tomas Vondra
> <tomas.vondra@2ndquadrant.com> wrote:
>> On 09/06/2016 04:49 AM, Amit Kapila wrote:
>>> On Mon, Sep 5, 2016 at 11:34 PM, Tomas Vondra
>>> <tomas.vondra@2ndquadrant.com> wrote:
>>>>
>>>>
>>>> On 09/05/2016 06:03 AM, Amit Kapila wrote:
>>>>>  So, in short we have to compare three
>>>>> approaches here.
>>>>>
>>>>> 1) Group mode to reduce CLOGControlLock contention
>>>>> 2) Use granular locking model
>>>>> 3) Use atomic operations
>>>>>
>>>>> For approach-1, you can use patch [1].  For approach-2, you can use
>>>>> 0001-Improve-64bit-atomics-support patch[2] and the patch attached
>>>>> with this mail.  For approach-3, you can use
>>>>> 0001-Improve-64bit-atomics-support patch[2] and the patch attached
>>>>> with this mail by commenting USE_CONTENT_LOCK.  If the third doesn't
>>>>> work for you then for now we can compare approach-1 and approach-2.
>>>>>
>>>>
>>>> OK, I can compile all three cases - but onl with gcc 4.7 or newer. Sadly
>>>> the 4-socket 64-core machine runs Debian Jessie with just gcc 4.6 and my
>>>> attempts to update to a newer version were unsuccessful so far.
>>>>
>>>
>>> So which all patches your are able to compile on 4-socket m/c?  I
>>> think it is better to measure the performance on bigger machine.
>>
>> Oh, sorry - I forgot to mention that only the last test (with
>> USE_CONTENT_LOCK commented out) fails to compile, because the functions
>> for atomics were added in gcc-4.7.
>>
>
> No issues, in that case we can leave the last test for now and do it later.
>

FWIW I've managed to compile a new GCC on the system (all I had to do
was to actually read the damn manual), so I'm ready to do the test once
I get a bit of time.

regards

--
Tomas Vondra                  http://www.2ndQuadrant.com
PostgreSQL Development, 24x7 Support, Remote DBA, Training & Services
On Mon, Sep 5, 2016 at 9:33 AM, Amit Kapila <amit.kapila16@gmail.com> wrote:
> USE_CONTENT_LOCK on my windows box, you can try by commenting that as
> well, if it works for you).  So, in short we have to compare three
> approaches here.
>
> 1) Group mode to reduce CLOGControlLock contention
> 2) Use granular locking model
> 3) Use atomic operations

I have tested performance with approach 1 and approach 2.

1. Transaction (script.sql): I have used below transaction to run my
bench mark, We can argue that this may not be an ideal workload, but I
tested this to put more load on ClogControlLock during commit
transaction.

-----------
\set aid random (1,30000000)
\set tid random (1,3000)

BEGIN;
SELECT abalance FROM pgbench_accounts WHERE aid = :aid for UPDATE;
SAVEPOINT s1;
SELECT tbalance FROM pgbench_tellers WHERE tid = :tid for UPDATE;
SAVEPOINT s2;
SELECT abalance FROM pgbench_accounts WHERE aid = :aid for UPDATE;
END;
-----------

2. Results
./pgbench -c $threads -j $threads -T 10 -M prepared postgres -f script.sql
scale factor: 300
Clients   head(tps)        grouplock(tps)          granular(tps)
-------      ---------               ----------                   -------
128        29367                 39326                    37421
180        29777                 37810                    36469
256        28523                 37418                    35882


grouplock --> 1) Group mode to reduce CLOGControlLock contention
granular  --> 2) Use granular locking model

I will test with 3rd approach also, whenever I get time.

3. Summary:
1. I can see on head we are gaining almost ~30 % performance at higher
client count (128 and beyond).
2. group lock is ~5% better compared to granular lock.

--
Regards,
Dilip Kumar
EnterpriseDB: http://www.enterprisedb.com
On Wed, Sep 14, 2016 at 10:25 AM, Dilip Kumar <dilipbalaut@gmail.com> wrote:
> I have tested performance with approach 1 and approach 2.
>
> 1. Transaction (script.sql): I have used below transaction to run my
> bench mark, We can argue that this may not be an ideal workload, but I
> tested this to put more load on ClogControlLock during commit
> transaction.
>
> -----------
> \set aid random (1,30000000)
> \set tid random (1,3000)
>
> BEGIN;
> SELECT abalance FROM pgbench_accounts WHERE aid = :aid for UPDATE;
> SAVEPOINT s1;
> SELECT tbalance FROM pgbench_tellers WHERE tid = :tid for UPDATE;
> SAVEPOINT s2;
> SELECT abalance FROM pgbench_accounts WHERE aid = :aid for UPDATE;
> END;
> -----------
>
> 2. Results
> ./pgbench -c $threads -j $threads -T 10 -M prepared postgres -f script.sql
> scale factor: 300
> Clients   head(tps)        grouplock(tps)          granular(tps)
> -------      ---------               ----------                   -------
> 128        29367                 39326                    37421
> 180        29777                 37810                    36469
> 256        28523                 37418                    35882
>
>
> grouplock --> 1) Group mode to reduce CLOGControlLock contention
> granular  --> 2) Use granular locking model
>
> I will test with 3rd approach also, whenever I get time.
>
> 3. Summary:
> 1. I can see on head we are gaining almost ~30 % performance at higher
> client count (128 and beyond).
> 2. group lock is ~5% better compared to granular lock.

Forgot to mention that, this test is on unlogged tables.


--
Regards,
Dilip Kumar
EnterpriseDB: http://www.enterprisedb.com
On Wed, Sep 14, 2016 at 12:55 AM, Dilip Kumar <dilipbalaut@gmail.com> wrote:
> 2. Results
> ./pgbench -c $threads -j $threads -T 10 -M prepared postgres -f script.sql
> scale factor: 300
> Clients   head(tps)        grouplock(tps)          granular(tps)
> -------      ---------               ----------                   -------
> 128        29367                 39326                    37421
> 180        29777                 37810                    36469
> 256        28523                 37418                    35882
>
>
> grouplock --> 1) Group mode to reduce CLOGControlLock contention
> granular  --> 2) Use granular locking model
>
> I will test with 3rd approach also, whenever I get time.
>
> 3. Summary:
> 1. I can see on head we are gaining almost ~30 % performance at higher
> client count (128 and beyond).
> 2. group lock is ~5% better compared to granular lock.

Sure, but you're testing at *really* high client counts here.  Almost
nobody is going to benefit from a 5% improvement at 256 clients.  You
need to test 64 clients and 32 clients and 16 clients and 8 clients
and see what happens there.  Those cases are a lot more likely than
these stratospheric client counts.

--
Robert Haas
EnterpriseDB: http://www.enterprisedb.com
The Enterprise PostgreSQL Company
On Wed, Sep 14, 2016 at 8:59 PM, Robert Haas <robertmhaas@gmail.com> wrote:
> Sure, but you're testing at *really* high client counts here.  Almost
> nobody is going to benefit from a 5% improvement at 256 clients.

I agree with your point, but here we need to consider one more thing,
that on head we are gaining ~30% with both the approaches.

So for comparing these two patches we can consider..

A.  Other workloads (one can be as below)  -> Load on CLogControlLock at commit (exclusive mode) + Load on
CLogControlLock at Transaction status (shared mode).  I think we can mix (savepoint + updates)

B. Simplicity of the patch (if both are performing almost equal in all
practical scenarios).

C. Bases on algorithm whichever seems winner.

I will try to test these patches with other workloads...

>  You
> need to test 64 clients and 32 clients and 16 clients and 8 clients
> and see what happens there.  Those cases are a lot more likely than
> these stratospheric client counts.

I tested with 64 clients as well..
1. On head we are gaining ~15% with both the patches.
2. But group lock vs granular lock is almost same.

--
Regards,
Dilip Kumar
EnterpriseDB: http://www.enterprisedb.com
On 09/14/2016 06:04 PM, Dilip Kumar wrote:
> On Wed, Sep 14, 2016 at 8:59 PM, Robert Haas <robertmhaas@gmail.com> wrote:
>> Sure, but you're testing at *really* high client counts here.  Almost
>> nobody is going to benefit from a 5% improvement at 256 clients.
>
> I agree with your point, but here we need to consider one more thing,
> that on head we are gaining ~30% with both the approaches.
>
> So for comparing these two patches we can consider..
>
> A.  Other workloads (one can be as below)
>    -> Load on CLogControlLock at commit (exclusive mode) + Load on
> CLogControlLock at Transaction status (shared mode).
>    I think we can mix (savepoint + updates)
>
> B. Simplicity of the patch (if both are performing almost equal in all
> practical scenarios).
>
> C. Bases on algorithm whichever seems winner.
>
> I will try to test these patches with other workloads...
>
>>  You
>> need to test 64 clients and 32 clients and 16 clients and 8 clients
>> and see what happens there.  Those cases are a lot more likely than
>> these stratospheric client counts.
>
> I tested with 64 clients as well..
> 1. On head we are gaining ~15% with both the patches.
> 2. But group lock vs granular lock is almost same.
>

I've been doing some testing too, but I haven't managed to measure any
significant difference between master and any of the patches. Not sure
why, I've repeated the test from scratch to make sure I haven't done
anything stupid, but I got the same results (which is one of the main
reasons why the testing took me so long).

Attached is an archive with a script running the benchmark (including
SQL scripts generating the data and custom transaction for pgbench), and
results in a CSV format.

The benchmark is fairly simple - for each case (master + 3 different
patches) we do 10 runs, 5 minutes each, for 32, 64, 128 and 192 clients
(the machine has 32 physical cores).

The transaction is using a single unlogged table initialized like this:

     create unlogged table t(id int, val int);
     insert into t select i, i from generate_series(1,100000) s(i);
     vacuum t;
     create index on t(id);

(I've also ran it with 100M rows, called "large" in the results), and
pgbench is running this transaction:

     \set id random(1, 100000)

     BEGIN;
     UPDATE t SET val = val + 1 WHERE id = :id;
     SAVEPOINT s1;
     UPDATE t SET val = val + 1 WHERE id = :id;
     SAVEPOINT s2;
     UPDATE t SET val = val + 1 WHERE id = :id;
     SAVEPOINT s3;
     UPDATE t SET val = val + 1 WHERE id = :id;
     SAVEPOINT s4;
     UPDATE t SET val = val + 1 WHERE id = :id;
     SAVEPOINT s5;
     UPDATE t SET val = val + 1 WHERE id = :id;
     SAVEPOINT s6;
     UPDATE t SET val = val + 1 WHERE id = :id;
     SAVEPOINT s7;
     UPDATE t SET val = val + 1 WHERE id = :id;
     SAVEPOINT s8;
     COMMIT;

So 8 simple UPDATEs interleaved by savepoints. The benchmark was running
on a machine with 256GB of RAM, 32 cores (4x E5-4620) and a fairly large
SSD array. I'd done some basic tuning on the system, most importantly:

     effective_io_concurrency = 32
     work_mem = 512MB
     maintenance_work_mem = 512MB
     max_connections = 300
     checkpoint_completion_target = 0.9
     checkpoint_timeout = 3600
     max_wal_size = 128GB
     min_wal_size = 16GB
     shared_buffers = 16GB

Although most of the changes probably does not matter much for unlogged
tables (I planned to see how this affects regular tables, but as I see
no difference for unlogged ones, I haven't done that yet).

So the question is why Dilip sees +30% improvement, while my results are
almost exactly the same. Looking at Dilip's benchmark, I see he only ran
the test for 10 seconds, and I'm not sure how many runs he did, warmup
etc. Dilip, can you provide additional info?

I'll ask someone else to redo the benchmark after the weekend to make
sure it's not actually some stupid mistake of mine.

regards

--
Tomas Vondra                  http://www.2ndQuadrant.com
PostgreSQL Development, 24x7 Support, Remote DBA, Training & Services
Вложения
On Sat, Sep 17, 2016 at 6:54 AM, Tomas Vondra
<tomas.vondra@2ndquadrant.com> wrote:
> On 09/14/2016 06:04 PM, Dilip Kumar wrote:
>>
>> On Wed, Sep 14, 2016 at 8:59 PM, Robert Haas <robertmhaas@gmail.com>
>> wrote:
>>>
>>> Sure, but you're testing at *really* high client counts here.  Almost
>>> nobody is going to benefit from a 5% improvement at 256 clients.
>>
>>
>> I agree with your point, but here we need to consider one more thing,
>> that on head we are gaining ~30% with both the approaches.
>>
>> So for comparing these two patches we can consider..
>>
>> A.  Other workloads (one can be as below)
>>    -> Load on CLogControlLock at commit (exclusive mode) + Load on
>> CLogControlLock at Transaction status (shared mode).
>>    I think we can mix (savepoint + updates)
>>
>> B. Simplicity of the patch (if both are performing almost equal in all
>> practical scenarios).
>>
>> C. Bases on algorithm whichever seems winner.
>>
>> I will try to test these patches with other workloads...
>>
>>>  You
>>> need to test 64 clients and 32 clients and 16 clients and 8 clients
>>> and see what happens there.  Those cases are a lot more likely than
>>> these stratospheric client counts.
>>
>>
>> I tested with 64 clients as well..
>> 1. On head we are gaining ~15% with both the patches.
>> 2. But group lock vs granular lock is almost same.
>>
>
>
> The transaction is using a single unlogged table initialized like this:
>
>     create unlogged table t(id int, val int);
>     insert into t select i, i from generate_series(1,100000) s(i);
>     vacuum t;
>     create index on t(id);
>
> (I've also ran it with 100M rows, called "large" in the results), and
> pgbench is running this transaction:
>
>     \set id random(1, 100000)
>
>     BEGIN;
>     UPDATE t SET val = val + 1 WHERE id = :id;
>     SAVEPOINT s1;
>     UPDATE t SET val = val + 1 WHERE id = :id;
>     SAVEPOINT s2;
>     UPDATE t SET val = val + 1 WHERE id = :id;
>     SAVEPOINT s3;
>     UPDATE t SET val = val + 1 WHERE id = :id;
>     SAVEPOINT s4;
>     UPDATE t SET val = val + 1 WHERE id = :id;
>     SAVEPOINT s5;
>     UPDATE t SET val = val + 1 WHERE id = :id;
>     SAVEPOINT s6;
>     UPDATE t SET val = val + 1 WHERE id = :id;
>     SAVEPOINT s7;
>     UPDATE t SET val = val + 1 WHERE id = :id;
>     SAVEPOINT s8;
>     COMMIT;
>
> So 8 simple UPDATEs interleaved by savepoints.
>

The difference between these and tests performed by Dilip is that he
has lesser savepoints.  I think if you want to try it again, then can
you once do it with either no savepoint or 1~2 savepoints.  The other
thing you could try out is the same test as Dilip has done (with and
without 2 savepoints).

> The benchmark was running on
> a machine with 256GB of RAM, 32 cores (4x E5-4620) and a fairly large SSD
> array. I'd done some basic tuning on the system, most importantly:
>
>     effective_io_concurrency = 32
>     work_mem = 512MB
>     maintenance_work_mem = 512MB
>     max_connections = 300
>     checkpoint_completion_target = 0.9
>     checkpoint_timeout = 3600
>     max_wal_size = 128GB
>     min_wal_size = 16GB
>     shared_buffers = 16GB
>
> Although most of the changes probably does not matter much for unlogged
> tables (I planned to see how this affects regular tables, but as I see no
> difference for unlogged ones, I haven't done that yet).
>

You are right.  Unless, we don't see the benefit with unlogged tables,
there is no point in doing it for regular tables.

> So the question is why Dilip sees +30% improvement, while my results are
> almost exactly the same. Looking at Dilip's benchmark, I see he only ran the
> test for 10 seconds, and I'm not sure how many runs he did, warmup etc.
> Dilip, can you provide additional info?
>
> I'll ask someone else to redo the benchmark after the weekend to make sure
> it's not actually some stupid mistake of mine.
>

I think there is not much point in repeating the tests you have done,
rather it is better if we can try again the tests done by Dilip in
your environment to see the results.

Thanks for doing the tests.

--
With Regards,
Amit Kapila.
EnterpriseDB: http://www.enterprisedb.com
On 09/17/2016 05:23 AM, Amit Kapila wrote:
> On Sat, Sep 17, 2016 at 6:54 AM, Tomas Vondra
> <tomas.vondra@2ndquadrant.com> wrote:
>> On 09/14/2016 06:04 PM, Dilip Kumar wrote:
>>>
...
>>
>> (I've also ran it with 100M rows, called "large" in the results), and
>> pgbench is running this transaction:
>>
>>     \set id random(1, 100000)
>>
>>     BEGIN;
>>     UPDATE t SET val = val + 1 WHERE id = :id;
>>     SAVEPOINT s1;
>>     UPDATE t SET val = val + 1 WHERE id = :id;
>>     SAVEPOINT s2;
>>     UPDATE t SET val = val + 1 WHERE id = :id;
>>     SAVEPOINT s3;
>>     UPDATE t SET val = val + 1 WHERE id = :id;
>>     SAVEPOINT s4;
>>     UPDATE t SET val = val + 1 WHERE id = :id;
>>     SAVEPOINT s5;
>>     UPDATE t SET val = val + 1 WHERE id = :id;
>>     SAVEPOINT s6;
>>     UPDATE t SET val = val + 1 WHERE id = :id;
>>     SAVEPOINT s7;
>>     UPDATE t SET val = val + 1 WHERE id = :id;
>>     SAVEPOINT s8;
>>     COMMIT;
>>
>> So 8 simple UPDATEs interleaved by savepoints.
>>
>
> The difference between these and tests performed by Dilip is that he
> has lesser savepoints.  I think if you want to try it again, then can
> you once do it with either no savepoint or 1~2 savepoints.  The other
> thing you could try out is the same test as Dilip has done (with and
> without 2 savepoints).
>

I don't follow. My understanding is the patches should make savepoints
cheaper - so why would using fewer savepoints increase the effect of the
patches?

FWIW I've already done a quick test with 2 savepoints, no difference. I
can do a full test of course.

>> The benchmark was running on
>> a machine with 256GB of RAM, 32 cores (4x E5-4620) and a fairly large SSD
>> array. I'd done some basic tuning on the system, most importantly:
>>
>>     effective_io_concurrency = 32
>>     work_mem = 512MB
>>     maintenance_work_mem = 512MB
>>     max_connections = 300
>>     checkpoint_completion_target = 0.9
>>     checkpoint_timeout = 3600
>>     max_wal_size = 128GB
>>     min_wal_size = 16GB
>>     shared_buffers = 16GB
>>
>> Although most of the changes probably does not matter much for unlogged
>> tables (I planned to see how this affects regular tables, but as I see no
>> difference for unlogged ones, I haven't done that yet).
>>
>
> You are right.  Unless, we don't see the benefit with unlogged tables,
> there is no point in doing it for regular tables.
>
>> So the question is why Dilip sees +30% improvement, while my results are
>> almost exactly the same. Looking at Dilip's benchmark, I see he only ran the
>> test for 10 seconds, and I'm not sure how many runs he did, warmup etc.
>> Dilip, can you provide additional info?
>>
>> I'll ask someone else to redo the benchmark after the weekend to make sure
>> it's not actually some stupid mistake of mine.
>>
>
> I think there is not much point in repeating the tests you have
> done, rather it is better if we can try again the tests done by Dilip
> in your environment to see the results.
>

I'm OK with running Dilip's tests, but I'm not sure why there's not much
point in running the tests I've done. Or perhaps I'd like to understand
why "my tests" show no improvement whatsoever first - after all, they're
not that different from Dilip's.

regards

--
Tomas Vondra                  http://www.2ndQuadrant.com
PostgreSQL Development, 24x7 Support, Remote DBA, Training & Services
On 09/14/2016 05:29 PM, Robert Haas wrote:
> On Wed, Sep 14, 2016 at 12:55 AM, Dilip Kumar <dilipbalaut@gmail.com> wrote:
>> 2. Results
>> ./pgbench -c $threads -j $threads -T 10 -M prepared postgres -f script.sql
>> scale factor: 300
>> Clients   head(tps)        grouplock(tps)          granular(tps)
>> -------      ---------               ----------                   -------
>> 128        29367                 39326                    37421
>> 180        29777                 37810                    36469
>> 256        28523                 37418                    35882
>>
>>
>> grouplock --> 1) Group mode to reduce CLOGControlLock contention
>> granular  --> 2) Use granular locking model
>>
>> I will test with 3rd approach also, whenever I get time.
>>
>> 3. Summary:
>> 1. I can see on head we are gaining almost ~30 % performance at higher
>> client count (128 and beyond).
>> 2. group lock is ~5% better compared to granular lock.
>
> Sure, but you're testing at *really* high client counts here.  Almost
> nobody is going to benefit from a 5% improvement at 256 clients.  You
> need to test 64 clients and 32 clients and 16 clients and 8 clients
> and see what happens there.  Those cases are a lot more likely than
> these stratospheric client counts.
>

Right. My impression from the discussion so far is that the patches only
improve performance with very many concurrent clients - but as Robert
points out, almost no one is running with 256 active clients, unless
they have 128 cores or so. At least not if they value latency more than
throughput.

So while it's nice to improve throughput in those cases, it's a bit like
a tree falling in the forest without anyone around.

regards

--
Tomas Vondra                  http://www.2ndQuadrant.com
PostgreSQL Development, 24x7 Support, Remote DBA, Training & Services
On Sat, Sep 17, 2016 at 9:12 AM, Tomas Vondra
<tomas.vondra@2ndquadrant.com> wrote:
> On 09/17/2016 05:23 AM, Amit Kapila wrote:
>>
>> The difference between these and tests performed by Dilip is that he
>> has lesser savepoints.  I think if you want to try it again, then can
>> you once do it with either no savepoint or 1~2 savepoints.  The other
>> thing you could try out is the same test as Dilip has done (with and
>> without 2 savepoints).
>>
>
> I don't follow. My understanding is the patches should make savepoints
> cheaper - so why would using fewer savepoints increase the effect of the
> patches?
>

Oh, no the purpose of the patch is not to make savepoints cheaper (I
know I have earlier suggested to check by having few savepoints, but
that was not intended to mean that this patch makes savepoint cheaper,
rather it might show the difference between different approaches,
sorry if that was not clearly stated earlier).  The purpose of this
patch('es) is to make commits cheaper and in particular updating the
status in CLOG.  Let me try to explain in brief about the CLOG
contention and what these patches try to accomplish.  As of head, when
we try to update the status in CLOG (TransactionIdSetPageStatus), we
take CLOGControlLock in EXCLUSIVE mode for reading the appropriate
CLOG page (most of the time, it will be in memory, so it is cheap) and
then updating the transaction status in the same.  We take
CLOGControlLock in SHARED mode (if we the required clog page is in
memory, otherwise the lock is upgraded to Exclusive) while reading the
transaction status which happen when we access the tuple where hint
bit is not set.

So, we have two different type of contention around CLOGControlLock,
(a) all the transactions that try to commit at same time, each of them
have to do it almost serially (b) readers of transaction status
contend with writers.

Now with the patch that went in 9.6 (increasing the clog buffers), the
second type of contention is mostly reduced as most of the required
pages are in-memory and we are hoping that this patch will help in
reducing first type (a) of contention as well.

>>
>
> I'm OK with running Dilip's tests, but I'm not sure why there's not much
> point in running the tests I've done. Or perhaps I'd like to understand why
> "my tests" show no improvement whatsoever first - after all, they're not
> that different from Dilip's.
>

The test which Dilip is doing "Select ... For Update" is mainly aiming
at first type (a) of contention as it doesn't change the hint bits, so
mostly it should not go for reading the transaction status when
accessing the tuple.  Whereas, the tests you are doing is mainly
focussed on second type (b) of contention.

I think one point we have to keep in mind here is that this contention
is visible in bigger socket m/c, last time Jesper also tried these
patches, but didn't find much difference in his environment and on
further analyzing (IIRC) we found that the reason was that contention
was not visible in his environment.


--
With Regards,
Amit Kapila.
EnterpriseDB: http://www.enterprisedb.com
On Sat, Sep 17, 2016 at 9:17 AM, Tomas Vondra
<tomas.vondra@2ndquadrant.com> wrote:
> On 09/14/2016 05:29 PM, Robert Haas wrote:
>>
>> On Wed, Sep 14, 2016 at 12:55 AM, Dilip Kumar <dilipbalaut@gmail.com>
>> wrote:
>>>
>>> 2. Results
>>> ./pgbench -c $threads -j $threads -T 10 -M prepared postgres -f
>>> script.sql
>>> scale factor: 300
>>> Clients   head(tps)        grouplock(tps)          granular(tps)
>>> -------      ---------               ----------                   -------
>>> 128        29367                 39326                    37421
>>> 180        29777                 37810                    36469
>>> 256        28523                 37418                    35882
>>>
>>>
>>> grouplock --> 1) Group mode to reduce CLOGControlLock contention
>>> granular  --> 2) Use granular locking model
>>>
>>> I will test with 3rd approach also, whenever I get time.
>>>
>>> 3. Summary:
>>> 1. I can see on head we are gaining almost ~30 % performance at higher
>>> client count (128 and beyond).
>>> 2. group lock is ~5% better compared to granular lock.
>>
>>
>> Sure, but you're testing at *really* high client counts here.  Almost
>> nobody is going to benefit from a 5% improvement at 256 clients.  You
>> need to test 64 clients and 32 clients and 16 clients and 8 clients
>> and see what happens there.  Those cases are a lot more likely than
>> these stratospheric client counts.
>>
>
> Right. My impression from the discussion so far is that the patches only
> improve performance with very many concurrent clients - but as Robert points
> out, almost no one is running with 256 active clients, unless they have 128
> cores or so. At least not if they value latency more than throughput.
>

See, I am also not in favor of going with any of these patches, if
they doesn't help in reduction of contention.  However, I think it is
important to understand, under what kind of workload and which
environment it can show the benefit or regression whichever is
applicable.  Just FYI, couple of days back one of EDB's partner who
was doing the performance tests by using HammerDB (which is again OLTP
focussed workload) on 9.5 based code has found that CLogControlLock
has the significantly high contention.  They were using
synchronous_commit=off in their settings.  Now, it is quite possible
that with improvements done in 9.6, the contention they are seeing
will be eliminated, but we have yet to figure that out.  I just shared
this information to you with the intention that this seems to be a
real problem and we should try to work on it unless we are able to
convince ourselves that this is not a problem.

--
With Regards,
Amit Kapila.
EnterpriseDB: http://www.enterprisedb.com
On Sat, Sep 17, 2016 at 6:54 AM, Tomas Vondra
<tomas.vondra@2ndquadrant.com> wrote:
> Although most of the changes probably does not matter much for unlogged
> tables (I planned to see how this affects regular tables, but as I see no
> difference for unlogged ones, I haven't done that yet).
>
> So the question is why Dilip sees +30% improvement, while my results are
> almost exactly the same. Looking at Dilip's benchmark, I see he only ran the
> test for 10 seconds, and I'm not sure how many runs he did, warmup etc.
> Dilip, can you provide additional info?

Actually I ran test for 10 minutes.

Sorry for the confusion (I copy paste my script and manually replaced
the variable and made mistake )

My script is like this

scale_factor=300
shared_bufs=8GB
time_for_reading=600

./postgres -c shared_buffers=8GB -c checkpoint_timeout=40min -c
max_wal_size=20GB -c max_connections=300 -c maintenance_work_mem=1GB&
./pgbench -i -s $scale_factor --unlogged-tables postgres
./pgbench -c $threads -j $threads -T $time_for_reading -M prepared
postgres -f ../../script.sql >> test_results.txt

I am taking median of three readings..

with below script, I can repeat my results every time (64 client 15%
gain on head and 128+ client 30% gain on head).

I will repeat my test with 8,16 and 32 client and post the results soon.

> \set aid random (1,30000000)
> \set tid random (1,3000)
>
> BEGIN;
> SELECT abalance FROM pgbench_accounts WHERE aid = :aid for UPDATE;
> SAVEPOINT s1;
> SELECT tbalance FROM pgbench_tellers WHERE tid = :tid for UPDATE;
> SAVEPOINT s2;
> SELECT abalance FROM pgbench_accounts WHERE aid = :aid for UPDATE;
> END;
> -----------


--
Regards,
Dilip Kumar
EnterpriseDB: http://www.enterprisedb.com
On 09/17/2016 07:05 AM, Amit Kapila wrote:
> On Sat, Sep 17, 2016 at 9:17 AM, Tomas Vondra
> <tomas.vondra@2ndquadrant.com> wrote:
>> On 09/14/2016 05:29 PM, Robert Haas wrote:
...
>>> Sure, but you're testing at *really* high client counts here.
>>> Almost nobody is going to benefit from a 5% improvement at 256
>>> clients. You need to test 64 clients and 32 clients and 16
>>> clients and 8 clients and see what happens there. Those cases are
>>> a lot more likely than these stratospheric client counts.
>>>
>>
>> Right. My impression from the discussion so far is that the patches
>> only improve performance with very many concurrent clients - but as
>> Robert points out, almost no one is running with 256 active
>> clients, unless they have 128 cores or so. At least not if they
>> value latency more than throughput.
>>
>
> See, I am also not in favor of going with any of these patches, if
> they doesn't help in reduction of contention. However, I think it is
> important to understand, under what kind of workload and which
> environment it can show the benefit or regression whichever is
> applicable.

Sure. Which is why I initially asked what type of workload should I be
testing, and then done the testing with multiple savepoints as that's
what you suggested. But apparently that's not a workload that could
benefit from this patch, so I'm a bit confused.

> Just FYI, couple of days back one of EDB's partner who was doing the
> performance tests by using HammerDB (which is again OLTP focussed
> workload) on 9.5 based code has found that CLogControlLock has the
> significantly high contention. They were using synchronous_commit=off
> in their settings. Now, it is quite possible that with improvements
> done in 9.6, the contention they are seeing will be eliminated, but
> we have yet to figure that out. I just shared this information to you
> with the intention that this seems to be a real problem and we should
> try to work on it unless we are able to convince ourselves that this
> is not a problem.
>

So, can we approach the problem from this direction instead? That is,
instead of looking for workloads that might benefit from the patches,
look at real-world examples of CLOG lock contention and then evaluate
the impact on those?

Extracting the workload from benchmarks probably is not ideal, but it's
still better than constructing the workload on our own to fit the patch.

FWIW I'll do a simple pgbench test - first with synchronous_commit=on
and then with synchronous_commit=off. Probably the workloads we should
have started with anyway, I guess.

regards

--
Tomas Vondra                  http://www.2ndQuadrant.com
PostgreSQL Development, 24x7 Support, Remote DBA, Training & Services
On Sat, Sep 17, 2016 at 11:25 PM, Tomas Vondra
<tomas.vondra@2ndquadrant.com> wrote:
> On 09/17/2016 07:05 AM, Amit Kapila wrote:
>>
>> On Sat, Sep 17, 2016 at 9:17 AM, Tomas Vondra
>> <tomas.vondra@2ndquadrant.com> wrote:
>>>
>>> On 09/14/2016 05:29 PM, Robert Haas wrote:
>
> ...
>>>>
>>>> Sure, but you're testing at *really* high client counts here.
>>>> Almost nobody is going to benefit from a 5% improvement at 256
>>>> clients. You need to test 64 clients and 32 clients and 16
>>>> clients and 8 clients and see what happens there. Those cases are
>>>> a lot more likely than these stratospheric client counts.
>>>>
>>>
>>> Right. My impression from the discussion so far is that the patches
>>> only improve performance with very many concurrent clients - but as
>>> Robert points out, almost no one is running with 256 active
>>> clients, unless they have 128 cores or so. At least not if they
>>> value latency more than throughput.
>>>
>>
>> See, I am also not in favor of going with any of these patches, if
>> they doesn't help in reduction of contention. However, I think it is
>> important to understand, under what kind of workload and which
>> environment it can show the benefit or regression whichever is
>> applicable.
>
>
> Sure. Which is why I initially asked what type of workload should I be
> testing, and then done the testing with multiple savepoints as that's what
> you suggested. But apparently that's not a workload that could benefit from
> this patch, so I'm a bit confused.
>
>> Just FYI, couple of days back one of EDB's partner who was doing the
>> performance tests by using HammerDB (which is again OLTP focussed
>> workload) on 9.5 based code has found that CLogControlLock has the
>> significantly high contention. They were using synchronous_commit=off
>> in their settings. Now, it is quite possible that with improvements
>> done in 9.6, the contention they are seeing will be eliminated, but
>> we have yet to figure that out. I just shared this information to you
>> with the intention that this seems to be a real problem and we should
>> try to work on it unless we are able to convince ourselves that this
>> is not a problem.
>>
>
> So, can we approach the problem from this direction instead? That is,
> instead of looking for workloads that might benefit from the patches, look
> at real-world examples of CLOG lock contention and then evaluate the impact
> on those?
>

Sure, we can go that way as well, but I thought instead of testing
with a new benchmark kit (HammerDB), it is better to first get with
some simple statements.

> Extracting the workload from benchmarks probably is not ideal, but it's
> still better than constructing the workload on our own to fit the patch.
>
> FWIW I'll do a simple pgbench test - first with synchronous_commit=on and
> then with synchronous_commit=off. Probably the workloads we should have
> started with anyway, I guess.
>

Here, synchronous_commit = off case could be interesting.  Do you see
any problem with first trying a workload where Dilip is seeing
benefit?  I am not suggesting we should not do any other testing, but
just first lets try to reproduce the performance gain which is seen in
Dilip's tests.


--
With Regards,
Amit Kapila.
EnterpriseDB: http://www.enterprisedb.com
On 09/18/2016 06:08 AM, Amit Kapila wrote:
> On Sat, Sep 17, 2016 at 11:25 PM, Tomas Vondra
> <tomas.vondra@2ndquadrant.com> wrote:
>> On 09/17/2016 07:05 AM, Amit Kapila wrote:
>>>
>>> On Sat, Sep 17, 2016 at 9:17 AM, Tomas Vondra
>>> <tomas.vondra@2ndquadrant.com> wrote:
>>>>
>>>> On 09/14/2016 05:29 PM, Robert Haas wrote:
>>
>> ...
>>>>>
>>>>> Sure, but you're testing at *really* high client counts here.
>>>>> Almost nobody is going to benefit from a 5% improvement at 256
>>>>> clients. You need to test 64 clients and 32 clients and 16
>>>>> clients and 8 clients and see what happens there. Those cases are
>>>>> a lot more likely than these stratospheric client counts.
>>>>>
>>>>
>>>> Right. My impression from the discussion so far is that the patches
>>>> only improve performance with very many concurrent clients - but as
>>>> Robert points out, almost no one is running with 256 active
>>>> clients, unless they have 128 cores or so. At least not if they
>>>> value latency more than throughput.
>>>>
>>>
>>> See, I am also not in favor of going with any of these patches, if
>>> they doesn't help in reduction of contention. However, I think it is
>>> important to understand, under what kind of workload and which
>>> environment it can show the benefit or regression whichever is
>>> applicable.
>>
>>
>> Sure. Which is why I initially asked what type of workload should I be
>> testing, and then done the testing with multiple savepoints as that's what
>> you suggested. But apparently that's not a workload that could benefit from
>> this patch, so I'm a bit confused.
>>
>>> Just FYI, couple of days back one of EDB's partner who was doing the
>>> performance tests by using HammerDB (which is again OLTP focussed
>>> workload) on 9.5 based code has found that CLogControlLock has the
>>> significantly high contention. They were using synchronous_commit=off
>>> in their settings. Now, it is quite possible that with improvements
>>> done in 9.6, the contention they are seeing will be eliminated, but
>>> we have yet to figure that out. I just shared this information to you
>>> with the intention that this seems to be a real problem and we should
>>> try to work on it unless we are able to convince ourselves that this
>>> is not a problem.
>>>
>>
>> So, can we approach the problem from this direction instead? That is,
>> instead of looking for workloads that might benefit from the patches, look
>> at real-world examples of CLOG lock contention and then evaluate the impact
>> on those?
>>
>
> Sure, we can go that way as well, but I thought instead of testing
> with a new benchmark kit (HammerDB), it is better to first get with
> some simple statements.
>

IMHO in the ideal case the first message in this thread would provide a
test case, demonstrating the effect of the patch. Then we wouldn't have
the issue of looking for a good workload two years later.

But now that I look at the first post, I see it apparently used a plain
tpc-b pgbench (with synchronous_commit=on) to show the benefits, which
is the workload I'm running right now (results sometime tomorrow).

That workload clearly uses no savepoints at all, so I'm wondering why
you suggested to use several of them - I know you said that it's to show
differences between the approaches, but why should that matter to any of
the patches (and if it matters, why I got almost no differences in the
benchmarks)?

Pardon my ignorance, CLOG is not my area of expertise ...

>> Extracting the workload from benchmarks probably is not ideal, but
>> it's still better than constructing the workload on our own to fit
>> the patch.
>>
>> FWIW I'll do a simple pgbench test - first with
>> synchronous_commit=on and then with synchronous_commit=off.
>> Probably the workloads we should have started with anyway, I
>> guess.
>>
>
> Here, synchronous_commit = off case could be interesting. Do you see
> any problem with first trying a workload where Dilip is seeing
> benefit? I am not suggesting we should not do any other testing, but
> just first lets try to reproduce the performance gain which is seen
> in Dilip's tests.
>

I plan to run Dilip's workload once the current benchmarks complete.


regard

--
Tomas Vondra                  http://www.2ndQuadrant.com
PostgreSQL Development, 24x7 Support, Remote DBA, Training & Services
On Mon, Sep 19, 2016 at 2:41 AM, Tomas Vondra
<tomas.vondra@2ndquadrant.com> wrote:
> But now that I look at the first post, I see it apparently used a plain
> tpc-b pgbench (with synchronous_commit=on) to show the benefits, which is
> the workload I'm running right now (results sometime tomorrow).

Good option, We can test plain TPC-B also..

I have some more results.. I have got the result for "Update with no
savepoint"....

below is my script...

\set aid random (1,30000000)
\set tid random (1,3000)
\set delta random(-5000, 5000)
BEGIN;
UPDATE pgbench_accounts SET abalance = abalance + :delta WHERE aid = :aid;
UPDATE pgbench_tellers SET tbalance = tbalance + :delta WHERE tid = :tid;
UPDATE pgbench_accounts SET abalance = abalance + :delta WHERE aid = :aid;


Results: (median of three, 10 minutes run).

Clients   Head     GroupLock
16          21452    21589
32          42422    42688
64          42460    52590           ~ 23%
128        22683    56825           ~150%
256       18748     54867

With this workload I observed that gain is bigger than my previous
workload (select for update with 2 SP)..

Just to confirm that the gain what we are seeing is because of Clog
Lock contention removal or it's
something else, I ran 128 client with perf for 5 minutes and below is my result.

I can see that after applying group lock patch, LWLockAcquire become
28% to just 4%, and all because
of Clog Lock.

On Head:
------------
-   28.45%     0.24%  postgres  postgres           [.] LWLockAcquire  - LWLockAcquire     + 53.49%
TransactionIdSetPageStatus    + 40.83% SimpleLruReadPage_ReadOnly     + 1.16% BufferAlloc     + 0.92% GetSnapshotData
 + 0.89% GetNewTransactionId     + 0.72% LockBuffer     + 0.70% ProcArrayGroupClearXid


After Group Lock Patch:
-------------------------------
-    4.47%     0.26%  postgres  postgres           [.] LWLockAcquire  - LWLockAcquire     + 27.11% GetSnapshotData
+21.57% GetNewTransactionId     + 11.44% SimpleLruReadPage_ReadOnly     + 10.13% BufferAlloc     + 7.24%
ProcArrayGroupClearXid    + 4.74% LockBuffer     + 4.08% LockAcquireExtended     + 2.91%
TransactionGroupUpdateXidStatus    + 2.71% LockReleaseAll     + 1.90% WALInsertLockAcquire     + 0.94% LockRelease
+0.91% VirtualXactLockTableInsert     + 0.90% VirtualXactLockTableCleanup     + 0.72% MultiXactIdSetOldestMember     +
0.66%LockRefindAndRelease


Next I will test, "update with 2 savepoints", "select for update with
no savepoints"....
I will also test the granular lock and atomic lock patch in next run..

--
Regards,
Dilip Kumar
EnterpriseDB: http://www.enterprisedb.com
On Sun, Sep 18, 2016 at 5:11 PM, Tomas Vondra
<tomas.vondra@2ndquadrant.com> wrote:
> IMHO in the ideal case the first message in this thread would provide a test
> case, demonstrating the effect of the patch. Then we wouldn't have the issue
> of looking for a good workload two years later.
>
> But now that I look at the first post, I see it apparently used a plain
> tpc-b pgbench (with synchronous_commit=on) to show the benefits, which is
> the workload I'm running right now (results sometime tomorrow).
>
> That workload clearly uses no savepoints at all, so I'm wondering why you
> suggested to use several of them - I know you said that it's to show
> differences between the approaches, but why should that matter to any of the
> patches (and if it matters, why I got almost no differences in the
> benchmarks)?
>
> Pardon my ignorance, CLOG is not my area of expertise ...

It's possible that the effect of this patch depends on the number of
sockets.  EDB test machine cthulhu as 8 sockets, and power2 has 4
sockets.  I assume Dilip's tests were run on one of those two,
although he doesn't seem to have mentioned which one.  Your system is
probably 2 or 4 sockets, which might make a difference.  Results might
also depend on CPU architecture; power2 is, unsurprisingly, a POWER
system, whereas I assume you are testing x86.  Maybe somebody who has
access should test on hydra.pg.osuosl.org, which is a community POWER
resource.  (Send me a private email if you are a known community
member who wants access for benchmarking purposes.)

Personally, I find the results so far posted on this thread thoroughly
unimpressive.  I acknowledge that Dilip's results appear to show that
in a best-case scenario these patches produce a rather large gain.
However, that gain seems to happen in a completely contrived scenario:
astronomical client counts, unlogged tables, and a test script that
maximizes pressure on CLogControlLock.  If you have to work that hard
to find a big win, and tests under more reasonable conditions show no
benefit, it's not clear to me that it's really worth the time we're
all spending benchmarking and reviewing this, or the risk of bugs, or
the damage to the SLRU abstraction layer.  I think there's a very good
chance that we're better off moving on to projects that have a better
chance of helping in the real world.

--
Robert Haas
EnterpriseDB: http://www.enterprisedb.com
The Enterprise PostgreSQL Company
On 2016-09-19 15:10:58 -0400, Robert Haas wrote:
> Personally, I find the results so far posted on this thread thoroughly
> unimpressive.  I acknowledge that Dilip's results appear to show that
> in a best-case scenario these patches produce a rather large gain.
> However, that gain seems to happen in a completely contrived scenario:
> astronomical client counts, unlogged tables, and a test script that
> maximizes pressure on CLogControlLock.  If you have to work that hard
> to find a big win, and tests under more reasonable conditions show no
> benefit, it's not clear to me that it's really worth the time we're
> all spending benchmarking and reviewing this, or the risk of bugs, or
> the damage to the SLRU abstraction layer.  I think there's a very good
> chance that we're better off moving on to projects that have a better
> chance of helping in the real world.

+1
On Tue, Sep 20, 2016 at 12:40 AM, Robert Haas <robertmhaas@gmail.com> wrote:
> On Sun, Sep 18, 2016 at 5:11 PM, Tomas Vondra
> <tomas.vondra@2ndquadrant.com> wrote:
>> IMHO in the ideal case the first message in this thread would provide a test
>> case, demonstrating the effect of the patch. Then we wouldn't have the issue
>> of looking for a good workload two years later.
>>
>> But now that I look at the first post, I see it apparently used a plain
>> tpc-b pgbench (with synchronous_commit=on) to show the benefits, which is
>> the workload I'm running right now (results sometime tomorrow).
>>
>> That workload clearly uses no savepoints at all, so I'm wondering why you
>> suggested to use several of them - I know you said that it's to show
>> differences between the approaches, but why should that matter to any of the
>> patches (and if it matters, why I got almost no differences in the
>> benchmarks)?
>>
>> Pardon my ignorance, CLOG is not my area of expertise ...
>
> It's possible that the effect of this patch depends on the number of
> sockets.  EDB test machine cthulhu as 8 sockets, and power2 has 4
> sockets.  I assume Dilip's tests were run on one of those two,
>

I think it is former (8 socket machine).

> although he doesn't seem to have mentioned which one.  Your system is
> probably 2 or 4 sockets, which might make a difference.  Results might
> also depend on CPU architecture; power2 is, unsurprisingly, a POWER
> system, whereas I assume you are testing x86.  Maybe somebody who has
> access should test on hydra.pg.osuosl.org, which is a community POWER
> resource.  (Send me a private email if you are a known community
> member who wants access for benchmarking purposes.)
>
> Personally, I find the results so far posted on this thread thoroughly
> unimpressive.  I acknowledge that Dilip's results appear to show that
> in a best-case scenario these patches produce a rather large gain.
> However, that gain seems to happen in a completely contrived scenario:
> astronomical client counts, unlogged tables, and a test script that
> maximizes pressure on CLogControlLock.
>

You are right that the scenario is somewhat contrived, but I think he
hasn't posted the results for simple-update or tpc-b kind of scenarios
for pgbench, so we can't conclude that those won't show benefit.  I
think we can see benefits with synchronous_commit=off as well may not
be as good as with unlogged tables.  The other thing to keep in mind
is that reducing contention on one lock (assume in this case
CLOGControlLock) also gives benefits when we reduce contention on
other locks (like ProcArrayLock, WALWriteLock, ..).  Last time we have
verified this effect with Andres's patch (cache the snapshot) which
reduces the remaining contention on ProcArrayLock.  We have seen that
individually that patch gives some benefit, but by removing the
contention on CLOGControlLock with the patches (increase the clog
buffers and grouping stuff, each one helps) discussed in this thread,
it gives much bigger benefit.

You point related to high-client count is valid and I am sure it won't
give noticeable benefit at lower client-count as the the
CLOGControlLock contention starts impacting only at high-client count.
I am not sure if it is good idea to reject a patch which helps in
stabilising the performance (helps in falling off the cliff) when the
processes increases the number of cores (or hardware threads)

>  If you have to work that hard
> to find a big win, and tests under more reasonable conditions show no
> benefit, it's not clear to me that it's really worth the time we're
> all spending benchmarking and reviewing this, or the risk of bugs, or
> the damage to the SLRU abstraction layer.

I agree with you unless it shows benefit on somewhat more usual
scenario's, we should not accept it.  So shouldn't we wait for results
of other workloads like simple-update or tpc-b on bigger machines
before reaching to conclusion?


--
With Regards,
Amit Kapila.
EnterpriseDB: http://www.enterprisedb.com
On Tue, Sep 20, 2016 at 8:37 AM, Amit Kapila <amit.kapila16@gmail.com> wrote:
> I think it is former (8 socket machine).

I confirm this is 8 sockets machine(cthulhu)
>

>
> You point related to high-client count is valid and I am sure it won't
> give noticeable benefit at lower client-count as the the
> CLOGControlLock contention starts impacting only at high-client count.
> I am not sure if it is good idea to reject a patch which helps in
> stabilising the performance (helps in falling off the cliff) when the
> processes increases the number of cores (or hardware threads)
>
>>  If you have to work that hard
>> to find a big win, and tests under more reasonable conditions show no
>> benefit, it's not clear to me that it's really worth the time we're
>> all spending benchmarking and reviewing this, or the risk of bugs, or
>> the damage to the SLRU abstraction layer.
>
> I agree with you unless it shows benefit on somewhat more usual
> scenario's, we should not accept it.  So shouldn't we wait for results
> of other workloads like simple-update or tpc-b on bigger machines
> before reaching to conclusion?

+1

My test are under run, I will post it soon..


--
Regards,
Dilip Kumar
EnterpriseDB: http://www.enterprisedb.com
Hi,

On 09/19/2016 09:10 PM, Robert Haas wrote:
 >
> It's possible that the effect of this patch depends on the number of
> sockets. EDB test machine cthulhu as 8 sockets, and power2 has 4
> sockets. I assume Dilip's tests were run on one of those two,
> although he doesn't seem to have mentioned which one. Your system is
> probably 2 or 4 sockets, which might make a difference. Results
> might also depend on CPU architecture; power2 is, unsurprisingly, a
> POWER system, whereas I assume you are testing x86. Maybe somebody
> who has access should test on hydra.pg.osuosl.org, which is a
> community POWER resource. (Send me a private email if you are a known
> community member who wants access for benchmarking purposes.)
>

Yes, I'm using x86 machines:

1) large but slightly old
- 4 sockets, e5-4620 (so a bit old CPU, 32 cores in total)
- kernel 3.2.80

2) smaller but fresh
- 2 sockets, e5-2620 v4 (newest type of Xeons, 16 cores in total)
- kernel 4.8.0

> Personally, I find the results so far posted on this thread
> thoroughly unimpressive. I acknowledge that Dilip's results appear
> to show that in a best-case scenario these patches produce a rather
> large gain. However, that gain seems to happen in a completely
> contrived scenario: astronomical client counts, unlogged tables, and
> a test script that maximizes pressure on CLogControlLock. If you
> have to work that hard to find a big win, and tests under more
> reasonable conditions show no benefit, it's not clear to me that it's
> really worth the time we're all spending benchmarking and reviewing
> this, or the risk of bugs, or the damage to the SLRU abstraction
> layer. I think there's a very good chance that we're better off
> moving on to projects that have a better chance of helping in the
> real world.

I'm posting results from two types of workloads - traditional r/w
pgbench and Dilip's transaction. With synchronous_commit on/off.

Full results (including script driving the benchmark) are available
here, if needed:

     https://bitbucket.org/tvondra/group-clog-benchmark/src

It'd be good if someone could try reproduce this on a comparable
machine, to rule out my stupidity.


2 x e5-2620 v4 (16 cores, 32 with HT)
=====================================

On the "smaller" machine the results look like this - I have only tested
up to 64 clients, as higher values seem rather uninteresting on a
machine with only 16 physical cores.

These are averages of 5 runs, where the min/max for each group are
within ~5% in most cases (see the "spread" sheet). The "e5-2620" sheet
also shows the numbers as % compared to master.


  dilip / sync=off      1        4        8       16       32       64
----------------------------------------------------------------------
  master             4756    17672    35542    57303    74596    82138
  granular-locking   4745    17728    35078    56105    72983    77858
  no-content-lock    4646    17650    34887    55794    73273    79000
  group-update       4582    17757    35383    56974    74387    81794

  dilip / sync=on       1        4        8       16       32       64
----------------------------------------------------------------------
  master             4819    17583    35636    57437    74620    82036
  granular-locking   4568    17816    35122    56168    73192    78462
  no-content-lock    4540    17662    34747    55560    73508    79320
  group-update       4495    17612    35474    57095    74409    81874

  pgbench / sync=off    1        4        8       16       32       64
----------------------------------------------------------------------
  master             3791    14368    27806    43369    54472    62956
  granular-locking   3822    14462    27597    43173    56391    64669
  no-content-lock    3725    14212    27471    43041    55431    63589
  group-update       3895    14453    27574    43405    56783    62406

  pgbench / sync=on     1        4        8       16       32       64
----------------------------------------------------------------------
  master             3907    14289    27802    43717    56902    62916
  granular-locking   3770    14503    27636    44107    55205    63903
  no-content-lock    3772    14111    27388    43054    56424    64386
  group-update       3844    14334    27452    43621    55896    62498

There's pretty much no improvement at all - most of the results are
within 1-2% of master, in both directions. Hardly a win.

Actually, with 1 client there seems to be ~5% regression, but it might
also be noise and verifying it would require further testing.


4 x e5-4620 v1 (32 cores, 64 with HT)
=====================================

These are averages of 10 runs, and there are a few strange things here.

Firstly, for Dilip's workload the results get much (much) worse between
64 and 128 clients, for some reason. I suspect this might be due to
fairly old kernel (3.2.80), so I'll reboot the machine with 4.5.x kernel
and try again.

Secondly, the min/max differences get much larger than the ~5% on the
smaller machine - with 128 clients, the (max-min)/average is often
 >100%. See the "spread" or "spread2" sheets in the attached file.

But for some reason this only affects Dilip's workload, and apparently
the patches make it measurably worse (master is ~75%, patches ~120%). If
you look at tps for individual runs, there's usually 9 runs with almost
the same performance, and then one or two much faster runs. Again, the
pgbench seems not to have this issue.

I have no idea what's causing this - it might be related to the kernel,
but I'm not sure why it should affect the patches differently. Let's see
how the new kernel affects this.

  dilip / sync=off       16       32       64      128     192
--------------------------------------------------------------
  master              26198    37901    37211    14441    8315
  granular-locking    25829    38395    40626    14299    8160
  no-content-lock     25872    38994    41053    14058    8169
  group-update        26503    38911    42993    19474    8325

  dilip / sync=on        16       32       64      128     192
--------------------------------------------------------------
  master              26138    37790    38492    13653    8337
  granular-locking    25661    38586    40692    14535    8311
  no-content-lock     25653    39059    41169    14370    8373
  group-update        26472    39170    42126    18923    8366

  pgbench / sync=off     16       32       64      128     192
--------------------------------------------------------------
  master              23001    35762    41202    31789    8005
  granular-locking    23218    36130    42535    45850    8701
  no-content-lock     23322    36553    42772    47394    8204
  group-update        23129    36177    41788    46419    8163

  pgbench / sync=on      16       32       64      128     192
--------------------------------------------------------------
  master              22904    36077    41295    35574    8297
  granular-locking    23323    36254    42446    43909    8959
  no-content-lock     23304    36670    42606    48440    8813
  group-update        23127    36696    41859    46693    8345


So there is some improvement due to the patches for 128 clients (+30% in
some cases), but it's rather useless as 64 clients either give you
comparable performance (pgbench workload) or way better one (Dilip's
workload).

Also, pretty much no difference between synchronous_commit on/off,
probably thanks to running on unlogged tables.

I'll repeat the test on the 4-socket machine with a newer kernel, but
that's probably the last benchmark I'll do for this patch for now. I
agree with Robert that the cases the patch is supposed to improve are a
bit contrived because of the very high client counts.

IMHO to continue with the patch (or even with testing it), we really
need a credible / practical example of a real-world workload that
benefits from the patches. The closest we have to that is Amit's
suggestion someone hit the commit lock when running HammerDB, but we
have absolutely no idea what parameters they were using, except that
they were running with synchronous_commit=off. Pgbench shows no such
improvements (at least for me), at least with reasonable parameters.


regards

--
Tomas Vondra                  http://www.2ndQuadrant.com
PostgreSQL Development, 24x7 Support, Remote DBA, Training & Services
Вложения
On Tue, Sep 20, 2016 at 9:15 AM, Dilip Kumar <dilipbalaut@gmail.com> wrote:
> +1
>
> My test are under run, I will post it soon..

I have some more results now....

8 socket machine
10 min run(median of 3 run)
synchronous_commit=off
scal factor = 300
share buffer= 8GB

test1: Simple update(pgbench)

Clients         Head          GroupLock32               45702           4540264               46974           51627
128              35056           55362


test2: TPCB (pgbench)

Clients         Head           GroupLock32               27969           2776564               33140           34786
128              21555           38848

Summary:
--------------
At 32 clients no gain, I think at this workload Clog Lock is not a problem.
At 64 Clients we can see ~10% gain with simple update and ~5% with TPCB.
At 128 Clients we can see > 50% gain.

Currently I have tested with synchronous commit=off, later I can try
with on. I can also test at 80 client, I think we will see some
significant gain at this client count also, but as of now I haven't
yet tested.

With above results, what we think ? should we continue our testing ?

--
Regards,
Dilip Kumar
EnterpriseDB: http://www.enterprisedb.com
On Wed, Sep 21, 2016 at 3:48 AM, Tomas Vondra
<tomas.vondra@2ndquadrant.com> wrote:
>
> I have no idea what's causing this - it might be related to the kernel, but
> I'm not sure why it should affect the patches differently. Let's see how the
> new kernel affects this.
>
>  dilip / sync=off       16       32       64      128     192
> --------------------------------------------------------------
>  master              26198    37901    37211    14441    8315
>  granular-locking    25829    38395    40626    14299    8160
>  no-content-lock     25872    38994    41053    14058    8169
>  group-update        26503    38911    42993    19474    8325
>
>  dilip / sync=on        16       32       64      128     192
> --------------------------------------------------------------
>  master              26138    37790    38492    13653    8337
>  granular-locking    25661    38586    40692    14535    8311
>  no-content-lock     25653    39059    41169    14370    8373
>  group-update        26472    39170    42126    18923    8366
>
>  pgbench / sync=off     16       32       64      128     192
> --------------------------------------------------------------
>  master              23001    35762    41202    31789    8005
>  granular-locking    23218    36130    42535    45850    8701
>  no-content-lock     23322    36553    42772    47394    8204
>  group-update        23129    36177    41788    46419    8163
>
>  pgbench / sync=on      16       32       64      128     192
> --------------------------------------------------------------
>  master              22904    36077    41295    35574    8297
>  granular-locking    23323    36254    42446    43909    8959
>  no-content-lock     23304    36670    42606    48440    8813
>  group-update        23127    36696    41859    46693    8345
>
>
> So there is some improvement due to the patches for 128 clients (+30% in
> some cases), but it's rather useless as 64 clients either give you
> comparable performance (pgbench workload) or way better one (Dilip's
> workload).
>

I think these results are somewhat similar to what Dilip has reported.
Here, if you see in both cases, the performance improvement is seen
when the client count is greater than cores (including HT).  As far as
I know the m/c on which Dilip is running the tests also has 64 HT.
The point here is that the CLOGControlLock contention is noticeable
only at that client count, so it is not fault of patch that it is not
improving at lower client-count.  I guess that we will see performance
improvement between 64~128 client counts as well.


> Also, pretty much no difference between synchronous_commit on/off, probably
> thanks to running on unlogged tables.
>

Yeah.

> I'll repeat the test on the 4-socket machine with a newer kernel, but that's
> probably the last benchmark I'll do for this patch for now.
>

Okay, but I think it is better to see the results between 64~128
client count and may be greater than128 client counts, because it is
clear that patch won't improve performance below that.

> I agree with
> Robert that the cases the patch is supposed to improve are a bit contrived
> because of the very high client counts.
>

No issues, I have already explained why I think it is important to
reduce the remaining CLOGControlLock contention in yesterday's and
this mail.  If none of you is convinced, then I think we have no
choice but to drop this patch.


--
With Regards,
Amit Kapila.
EnterpriseDB: http://www.enterprisedb.com
On 09/21/2016 08:04 AM, Amit Kapila wrote:
> On Wed, Sep 21, 2016 at 3:48 AM, Tomas Vondra
> <tomas.vondra@2ndquadrant.com> wrote:
...
>
>> I'll repeat the test on the 4-socket machine with a newer kernel,
>> but that's probably the last benchmark I'll do for this patch for
>> now.
>>

Attached are results from benchmarks running on kernel 4.5 (instead of
the old 3.2.80). I've only done synchronous_commit=on, and I've added a
few client counts (mostly at the lower end). The data are pushed the
data to the git repository, see

     git push --set-upstream origin master

The summary looks like this (showing both the 3.2.80 and 4.5.5 results):

1) Dilip's workload

  3.2.80                             16     32     64    128    192
-------------------------------------------------------------------
  master                          26138  37790  38492  13653   8337
  granular-locking                25661  38586  40692  14535   8311
  no-content-lock                 25653  39059  41169  14370   8373
  group-update                    26472  39170  42126  18923   8366

  4.5.5                 1      8     16     32     64    128    192
-------------------------------------------------------------------
  granular-locking   4050  23048  27969  32076  34874  36555  37710
  no-content-lock    4025  23166  28430  33032  35214  37576  39191
  group-update       4002  23037  28008  32492  35161  36836  38850
  master             3968  22883  27437  32217  34823  36668  38073


2) pgbench

  3.2.80                             16     32     64    128    192
-------------------------------------------------------------------
  master                          22904  36077  41295  35574   8297
  granular-locking                23323  36254  42446  43909   8959
  no-content-lock                 23304  36670  42606  48440   8813
  group-update                    23127  36696  41859  46693   8345

  4.5.5                 1      8     16     32     64    128    192
-------------------------------------------------------------------
  granular-locking   3116  19235  27388  29150  31905  34105  36359
  no-content-lock    3206  19071  27492  29178  32009  34140  36321
  group-update       3195  19104  26888  29236  32140  33953  35901
  master             3136  18650  26249  28731  31515  33328  35243


The 4.5 kernel clearly changed the results significantly:

(a) Compared to the results from 3.2.80 kernel, some numbers improved,
some got worse. For example, on 3.2.80 pgbench did ~23k tps with 16
clients, on 4.5.5 it does 27k tps. With 64 clients the performance
dropped from 41k tps to ~34k (on master).

(b) The drop above 64 clients is gone - on 3.2.80 it dropped very
quickly to only ~8k with 192 clients. On 4.5 the tps actually continues
to increase, and we get ~35k with 192 clients.

(c) Although it's not visible in the results, 4.5.5 almost perfectly
eliminated the fluctuations in the results. For example when 3.2.80
produced this results (10 runs with the same parameters):

     12118 11610 27939 11771 18065
     12152 14375 10983 13614 11077

we get this on 4.5.5

     37354 37650 37371 37190 37233
     38498 37166 36862 37928 38509

Notice how much more even the 4.5.5 results are, compared to 3.2.80.

(d) There's no sign of any benefit from any of the patches (it was only
helpful >= 128 clients, but that's where the tps actually dropped on
3.2.80 - apparently 4.5.5 fixes that and the benefit is gone).

It's a bit annoying that after upgrading from 3.2.80 to 4.5.5, the
performance with 32 and 64 clients dropped quite noticeably (by more
than 10%). I believe that might be a kernel regression, but perhaps it's
a price for improved scalability for higher client counts.

It of course begs the question what kernel version is running on the
machine used by Dilip (i.e. cthulhu)? Although it's a Power machine, so
I'm not sure how much the kernel matters on it.

I'll ask someone else with access to this particular machine to repeat
the tests, as I have a nagging suspicion that I've missed something
important when compiling / running the benchmarks. I'll also retry the
benchmarks on 3.2.80 to see if I get the same numbers.

>
> Okay, but I think it is better to see the results between 64~128
> client count and may be greater than128 client counts, because it is
> clear that patch won't improve performance below that.
>

There are results for 64, 128 and 192 clients. Why should we care about
numbers in between? How likely (and useful) would it be to get
improvement with 96 clients, but no improvement for 64 or 128 clients?

 >>
>> I agree with Robert that the cases the patch is supposed to
>> improve are a bit contrived because of the very high client
>> counts.
>>
>
> No issues, I have already explained why I think it is important to
> reduce the remaining CLOGControlLock contention in yesterday's and
> this mail. If none of you is convinced, then I think we have no
> choice but to drop this patch.
>

I agree it's useful to reduce lock contention in general, but
considering the last set of benchmarks shows no benefit with recent
kernel, I think we really need a better understanding of what's going
on, what workloads / systems it's supposed to improve, etc.

I don't dare to suggest rejecting the patch, but I don't see how we
could commit any of the patches at this point. So perhaps "returned with
feedback" and resubmitting in the next CF (along with analysis of
improved workloads) would be appropriate.

regards

--
Tomas Vondra                  http://www.2ndQuadrant.com
PostgreSQL Development, 24x7 Support, Remote DBA, Training & Services
Вложения
On Thu, Sep 22, 2016 at 7:44 PM, Tomas Vondra
<tomas.vondra@2ndquadrant.com> wrote:
> I don't dare to suggest rejecting the patch, but I don't see how we could
> commit any of the patches at this point. So perhaps "returned with feedback"
> and resubmitting in the next CF (along with analysis of improved workloads)
> would be appropriate.

I think it would be useful to have some kind of theoretical analysis
of how much time we're spending waiting for various locks.  So, for
example, suppose we one run of these tests with various client counts
- say, 1, 8, 16, 32, 64, 96, 128, 192, 256 - and we run "select
wait_event from pg_stat_activity" once per second throughout the test.
Then we see how many times we get each wait event, including NULL (no
wait event).  Now, from this, we can compute the approximate
percentage of time we're spending waiting on CLogControlLock and every
other lock, too, as well as the percentage of time we're not waiting
for lock.  That, it seems to me, would give us a pretty clear idea
what the maximum benefit we could hope for from reducing contention on
any given lock might be.

Now, we could also try that experiment with various patches.  If we
can show that some patch reduces CLogControlLock contention without
increasing TPS, they might still be worth committing for that reason.
Otherwise, you could have a chicken-and-egg problem.  If reducing
contention on A doesn't help TPS because of lock B and visca-versa,
then does that mean we can never commit any patch to reduce contention
on either lock?  Hopefully not.  But I agree with you that there's
certainly not enough evidence to commit any of these patches now.  To
my mind, these numbers aren't convincing.

--
Robert Haas
EnterpriseDB: http://www.enterprisedb.com
The Enterprise PostgreSQL Company
On 09/23/2016 03:20 AM, Robert Haas wrote:
> On Thu, Sep 22, 2016 at 7:44 PM, Tomas Vondra
> <tomas.vondra@2ndquadrant.com> wrote:
>> I don't dare to suggest rejecting the patch, but I don't see how
>> we could commit any of the patches at this point. So perhaps
>> "returned with feedback" and resubmitting in the next CF (along
>> with analysis of improvedworkloads) would be appropriate.
>
> I think it would be useful to have some kind of theoretical analysis
> of how much time we're spending waiting for various locks. So, for
> example, suppose we one run of these tests with various client
> counts - say, 1, 8, 16, 32, 64, 96, 128, 192, 256 - and we run
> "select wait_event from pg_stat_activity" once per second throughout
> the test. Then we see how many times we get each wait event,
> including NULL (no wait event). Now, from this, we can compute the
> approximate percentage of time we're spending waiting on
> CLogControlLock and every other lock, too, as well as the percentage
> of time we're not waiting for lock. That, it seems to me, would give
> us a pretty clear idea what the maximum benefit we could hope for
> from reducing contention on any given lock might be.
>

Yeah, I think that might be a good way to analyze the locks in general,
not just got these patches. 24h run with per-second samples should give
us about 86400 samples (well, multiplied by number of clients), which is
probably good enough.

We also have LWLOCK_STATS, that might be interesting too, but I'm not
sure how much it affects the behavior (and AFAIK it also only dumps the
data to the server log).
>
> Now, we could also try that experiment with various patches. If we
> can show that some patch reduces CLogControlLock contention without
> increasing TPS, they might still be worth committing for that
> reason. Otherwise, you could have a chicken-and-egg problem. If
> reducing contention on A doesn't help TPS because of lock B and
> visca-versa, then does that mean we can never commit any patch to
> reduce contention on either lock? Hopefully not. But I agree with you
> that there's certainly not enough evidence to commit any of these
> patches now. To my mind, these numbers aren't convincing.
>

Yes, the chicken-and-egg problem is why the tests were done with
unlogged tables (to work around the WAL lock).

regards

--
Tomas Vondra                  http://www.2ndQuadrant.com
PostgreSQL Development, 24x7 Support, Remote DBA, Training & Services
On Fri, Sep 23, 2016 at 7:17 AM, Tomas Vondra
<tomas.vondra@2ndquadrant.com> wrote:
> On 09/23/2016 03:20 AM, Robert Haas wrote:
>>
>> On Thu, Sep 22, 2016 at 7:44 PM, Tomas Vondra
>> <tomas.vondra@2ndquadrant.com> wrote:
>>>
>>> I don't dare to suggest rejecting the patch, but I don't see how
>>> we could commit any of the patches at this point. So perhaps
>>> "returned with feedback" and resubmitting in the next CF (along
>>> with analysis of improvedworkloads) would be appropriate.
>>
>>
>> I think it would be useful to have some kind of theoretical analysis
>> of how much time we're spending waiting for various locks. So, for
>> example, suppose we one run of these tests with various client
>> counts - say, 1, 8, 16, 32, 64, 96, 128, 192, 256 - and we run
>> "select wait_event from pg_stat_activity" once per second throughout
>> the test. Then we see how many times we get each wait event,
>> including NULL (no wait event). Now, from this, we can compute the
>> approximate percentage of time we're spending waiting on
>> CLogControlLock and every other lock, too, as well as the percentage
>> of time we're not waiting for lock. That, it seems to me, would give
>> us a pretty clear idea what the maximum benefit we could hope for
>> from reducing contention on any given lock might be.
>>
>
> Yeah, I think that might be a good way to analyze the locks in general, not
> just got these patches. 24h run with per-second samples should give us about
> 86400 samples (well, multiplied by number of clients), which is probably
> good enough.
>
> We also have LWLOCK_STATS, that might be interesting too, but I'm not sure
> how much it affects the behavior (and AFAIK it also only dumps the data to
> the server log).
>

Right, I think LWLOCK_STATS give us the count of how many time we have
blocked due to particular lock like below where *blk* gives that
number.

PID 164692 lwlock main 11: shacq 2734189 exacq 146304 blk 73808
spindelay 73 dequeue self 57241

I think doing some experiments with both the techniques can help us to
take a call on these patches.

Do we want these experiments on different kernel versions or are we
okay with the current version on cthulhu (3.10) or we want to only
consider the results with latest kernel?

>>
>>
>> Now, we could also try that experiment with various patches. If we
>> can show that some patch reduces CLogControlLock contention without
>> increasing TPS, they might still be worth committing for that
>> reason. Otherwise, you could have a chicken-and-egg problem. If
>> reducing contention on A doesn't help TPS because of lock B and
>> visca-versa, then does that mean we can never commit any patch to
>> reduce contention on either lock? Hopefully not. But I agree with you
>> that there's certainly not enough evidence to commit any of these
>> patches now. To my mind, these numbers aren't convincing.
>>
>
> Yes, the chicken-and-egg problem is why the tests were done with unlogged
> tables (to work around the WAL lock).
>

Yeah, but I suspect still there was a impact due to ProcArrayLock.


--
With Regards,
Amit Kapila.
EnterpriseDB: http://www.enterprisedb.com
On Fri, Sep 23, 2016 at 5:14 AM, Tomas Vondra
<tomas.vondra@2ndquadrant.com> wrote:
> On 09/21/2016 08:04 AM, Amit Kapila wrote:
>>
>
> (c) Although it's not visible in the results, 4.5.5 almost perfectly
> eliminated the fluctuations in the results. For example when 3.2.80 produced
> this results (10 runs with the same parameters):
>
>     12118 11610 27939 11771 18065
>     12152 14375 10983 13614 11077
>
> we get this on 4.5.5
>
>     37354 37650 37371 37190 37233
>     38498 37166 36862 37928 38509
>
> Notice how much more even the 4.5.5 results are, compared to 3.2.80.
>

how long each run was?  Generally, I do half-hour run to get stable results.

> (d) There's no sign of any benefit from any of the patches (it was only
> helpful >= 128 clients, but that's where the tps actually dropped on 3.2.80
> - apparently 4.5.5 fixes that and the benefit is gone).
>
> It's a bit annoying that after upgrading from 3.2.80 to 4.5.5, the
> performance with 32 and 64 clients dropped quite noticeably (by more than
> 10%). I believe that might be a kernel regression, but perhaps it's a price
> for improved scalability for higher client counts.
>
> It of course begs the question what kernel version is running on the machine
> used by Dilip (i.e. cthulhu)? Although it's a Power machine, so I'm not sure
> how much the kernel matters on it.
>

cthulhu is a x86 m/c and the kernel version is 3.10.  Seeing, the
above results I think kernel version do matter, but does that mean we
ignore the benefits we are seeing on somewhat older kernel version.  I
think right answer here is to do some experiments which can show the
actual contention as suggested by Robert and you.

> I'll ask someone else with access to this particular machine to repeat the
> tests, as I have a nagging suspicion that I've missed something important
> when compiling / running the benchmarks. I'll also retry the benchmarks on
> 3.2.80 to see if I get the same numbers.
>
>>
>> Okay, but I think it is better to see the results between 64~128
>> client count and may be greater than128 client counts, because it is
>> clear that patch won't improve performance below that.
>>
>
> There are results for 64, 128 and 192 clients. Why should we care about
> numbers in between? How likely (and useful) would it be to get improvement
> with 96 clients, but no improvement for 64 or 128 clients?
>

The only point to take was to see from where we have started seeing
improvement, saying that the TPS has improved from >=72 client count
is different from saying that it has improved from >=128.

>> No issues, I have already explained why I think it is important to
>> reduce the remaining CLOGControlLock contention in yesterday's and
>> this mail. If none of you is convinced, then I think we have no
>> choice but to drop this patch.
>>
>
> I agree it's useful to reduce lock contention in general, but considering
> the last set of benchmarks shows no benefit with recent kernel, I think we
> really need a better understanding of what's going on, what workloads /
> systems it's supposed to improve, etc.
>
> I don't dare to suggest rejecting the patch, but I don't see how we could
> commit any of the patches at this point. So perhaps "returned with feedback"
> and resubmitting in the next CF (along with analysis of improved workloads)
> would be appropriate.
>

Agreed with your conclusion and changed the status of patch in CF accordingly.

Many thanks for doing the tests.

--
With Regards,
Amit Kapila.
EnterpriseDB: http://www.enterprisedb.com
On 09/23/2016 05:10 AM, Amit Kapila wrote:
> On Fri, Sep 23, 2016 at 5:14 AM, Tomas Vondra
> <tomas.vondra@2ndquadrant.com> wrote:
>> On 09/21/2016 08:04 AM, Amit Kapila wrote:
>>>
>>
>> (c) Although it's not visible in the results, 4.5.5 almost perfectly
>> eliminated the fluctuations in the results. For example when 3.2.80 produced
>> this results (10 runs with the same parameters):
>>
>>     12118 11610 27939 11771 18065
>>     12152 14375 10983 13614 11077
>>
>> we get this on 4.5.5
>>
>>     37354 37650 37371 37190 37233
>>     38498 37166 36862 37928 38509
>>
>> Notice how much more even the 4.5.5 results are, compared to 3.2.80.
>>
>
> how long each run was?  Generally, I do half-hour run to get stable results.
>

10 x 5-minute runs for each client count. The full shell script driving
the benchmark is here: http://bit.ly/2doY6ID and in short it looks like
this:
    for r in `seq 1 $runs`; do        for c in 1 8 16 32 64 128 192; do            psql -c checkpoint
pgbench-j 8 -c $c ...        done    done


>>
>> It of course begs the question what kernel version is running on
>> the machine used by Dilip (i.e. cthulhu)? Although it's a Power
>> machine, so I'm not sure how much the kernel matters on it.
>>
>
> cthulhu is a x86 m/c and the kernel version is 3.10. Seeing, the
> above results I think kernel version do matter, but does that mean
> we ignore the benefits we are seeing on somewhat older kernel
> version. I think right answer here is to do some experiments which
> can show the actual contention as suggested by Robert and you.
>

Yes, I think it'd be useful to test a new kernel version. Perhaps try
4.5.x so that we can compare it to my results. Maybe even try using my
shell script

>>
>> There are results for 64, 128 and 192 clients. Why should we care
>> about numbers in between? How likely (and useful) would it be to
>> get improvement with 96 clients, but no improvement for 64 or 128
>> clients?>>
>
> The only point to take was to see from where we have started seeing
> improvement, saying that the TPS has improved from >=72 client count
> is different from saying that it has improved from >=128.
>

I find the exact client count rather uninteresting - it's going to be
quite dependent on hardware, workload etc.
>>
>> I don't dare to suggest rejecting the patch, but I don't see how
>> we could commit any of the patches at this point. So perhaps
>> "returned with feedback" and resubmitting in the next CF (along
>> with analysis of improvedworkloads) would be appropriate.
>>
>
> Agreed with your conclusion and changed the status of patch in CF
> accordingly.
>

+1


--
Tomas Vondra                  http://www.2ndQuadrant.com
PostgreSQL Development, 24x7 Support, Remote DBA, Training & Services
On 09/23/2016 01:44 AM, Tomas Vondra wrote:
>...
> The 4.5 kernel clearly changed the results significantly:
>
...>
> (c) Although it's not visible in the results, 4.5.5 almost perfectly
> eliminated the fluctuations in the results. For example when 3.2.80
> produced this results (10 runs with the same parameters):
>
>     12118 11610 27939 11771 18065
>     12152 14375 10983 13614 11077
>
> we get this on 4.5.5
>
>     37354 37650 37371 37190 37233
>     38498 37166 36862 37928 38509
>
> Notice how much more even the 4.5.5 results are, compared to 3.2.80.
>

The more I think about these random spikes in pgbench performance on
3.2.80, the more I find them intriguing. Let me show you another example
(from Dilip's workload and group-update patch on 64 clients).

This is on 3.2.80:
  44175  34619  51944  38384  49066  37004  47242  36296  46353  36180

and on 4.5.5 it looks like this:
  34400  35559  35436  34890  34626  35233  35756  34876  35347  35486

So the 4.5.5 results are much more even, but overall clearly below
3.2.80. How does 3.2.80 manage to do ~50k tps in some of the runs?
Clearly we randomly do something right, but what is it and why doesn't
it happen on the new kernel? And how could we do it every time?

regards

--
Tomas Vondra                  http://www.2ndQuadrant.com
PostgreSQL Development, 24x7 Support, Remote DBA, Training & Services
On 09/23/2016 05:10 AM, Amit Kapila wrote:On Fri, Sep 23, 2016 at 5:14 AM, Tomas Vondra
<tomas.vondra@2ndquadrant.com> wrote:On 09/21/2016 08:04 AM, Amit Kapila wrote:
(c) Although it's not visible in the results, 4.5.5 almost perfectly
eliminated the fluctuations in the results. For example when 3.2.80 produced
this results (10 runs with the same parameters):
12118 11610 27939 11771 18065
12152 14375 10983 13614 11077
we get this on 4.5.5
37354 37650 37371 37190 37233
38498 37166 36862 37928 38509
Notice how much more even the 4.5.5 results are, compared to 3.2.80.
how long each run was? Generally, I do half-hour run to get stable results.
10 x 5-minute runs for each client count. The full shell script driving the benchmark is here: http://bit.ly/2doY6ID and in short it looks like this:
for r in `seq 1 $runs`; do
for c in 1 8 16 32 64 128 192; do
psql -c checkpoint
pgbench -j 8 -c $c ...
done
done
PostgreSQL Development, 24x7 Support, Training & Services
On Fri, Sep 23, 2016 at 6:16 PM, Tomas Vondra
<tomas.vondra@2ndquadrant.com> wrote:
> On 09/23/2016 01:44 AM, Tomas Vondra wrote:
>>
>> ...
>> The 4.5 kernel clearly changed the results significantly:
>>
> ...
>>
>>
>> (c) Although it's not visible in the results, 4.5.5 almost perfectly
>> eliminated the fluctuations in the results. For example when 3.2.80
>> produced this results (10 runs with the same parameters):
>>
>>     12118 11610 27939 11771 18065
>>     12152 14375 10983 13614 11077
>>
>> we get this on 4.5.5
>>
>>     37354 37650 37371 37190 37233
>>     38498 37166 36862 37928 38509
>>
>> Notice how much more even the 4.5.5 results are, compared to 3.2.80.
>>
>
> The more I think about these random spikes in pgbench performance on 3.2.80,
> the more I find them intriguing. Let me show you another example (from
> Dilip's workload and group-update patch on 64 clients).
>
> This is on 3.2.80:
>
>   44175  34619  51944  38384  49066
>   37004  47242  36296  46353  36180
>
> and on 4.5.5 it looks like this:
>
>   34400  35559  35436  34890  34626
>   35233  35756  34876  35347  35486
>
> So the 4.5.5 results are much more even, but overall clearly below 3.2.80.
> How does 3.2.80 manage to do ~50k tps in some of the runs? Clearly we
> randomly do something right, but what is it and why doesn't it happen on the
> new kernel? And how could we do it every time?
>

As far as I can see you are using default values of min_wal_size,
max_wal_size, checkpoint related params, have you changed default
shared_buffer settings, because that can have a bigger impact.  Using
default values of mentioned parameters can lead to checkpoints in
between your runs. Also, I think instead of 5 mins, read-write runs
should be run for 15 mins to get consistent data.  For Dilip's
workload where he is using only Select ... For Update, i think it is
okay, but otherwise you need to drop and re-create the database
between each run, otherwise data bloat could impact the readings.

I think in general, the impact should be same for both the kernels
because you are using same parameters, but I think if use appropriate
parameters, then you can get consistent results for 3.2.80.  I have
also seen variation in read-write tests, but the variation you are
showing is really a matter of concern, because it will be difficult to
rely on final data.

--
With Regards,
Amit Kapila.
EnterpriseDB: http://www.enterprisedb.com
On Fri, Sep 23, 2016 at 6:29 PM, Pavan Deolasee
<pavan.deolasee@gmail.com> wrote:
> On Fri, Sep 23, 2016 at 6:05 PM, Tomas Vondra <tomas.vondra@2ndquadrant.com>
> wrote:
>>
>> On 09/23/2016 05:10 AM, Amit Kapila wrote:
>>>
>>> On Fri, Sep 23, 2016 at 5:14 AM, Tomas Vondra
>>> <tomas.vondra@2ndquadrant.com> wrote:
>>>>
>>>> On 09/21/2016 08:04 AM, Amit Kapila wrote:
>>>>>
>>>>>
>>>>
>>>> (c) Although it's not visible in the results, 4.5.5 almost perfectly
>>>> eliminated the fluctuations in the results. For example when 3.2.80
>>>> produced
>>>> this results (10 runs with the same parameters):
>>>>
>>>>     12118 11610 27939 11771 18065
>>>>     12152 14375 10983 13614 11077
>>>>
>>>> we get this on 4.5.5
>>>>
>>>>     37354 37650 37371 37190 37233
>>>>     38498 37166 36862 37928 38509
>>>>
>>>> Notice how much more even the 4.5.5 results are, compared to 3.2.80.
>>>>
>>>
>>> how long each run was?  Generally, I do half-hour run to get stable
>>> results.
>>>
>>
>> 10 x 5-minute runs for each client count. The full shell script driving
>> the benchmark is here: http://bit.ly/2doY6ID and in short it looks like
>> this:
>>
>>     for r in `seq 1 $runs`; do
>>         for c in 1 8 16 32 64 128 192; do
>>             psql -c checkpoint
>>             pgbench -j 8 -c $c ...
>>         done
>>     done
>
>
>
> I see couple of problems with the tests:
>
> 1. You're running regular pgbench, which also updates the small tables. At
> scale 300 and higher clients, there is going to heavy contention on the
> pgbench_branches table. Why not test with pgbench -N? As far as this patch
> is concerned, we are only interested in seeing contention on
> ClogControlLock. In fact, how about a test which only consumes an XID, but
> does not do any write activity at all? Complete artificial workload, but
> good enough to tell us if and how much the patch helps in the best case. We
> can probably do that with a simple txid_current() call, right?
>

Right, that is why in the initial tests done by Dilip, he has used
Select .. for Update.  I think using txid_current will generate lot of
contention on XidGenLock which will mask the contention around
CLOGControlLock, in-fact we have tried that.


--
With Regards,
Amit Kapila.
EnterpriseDB: http://www.enterprisedb.com
On Fri, Sep 23, 2016 at 6:50 AM, Robert Haas <robertmhaas@gmail.com> wrote:
> On Thu, Sep 22, 2016 at 7:44 PM, Tomas Vondra
> <tomas.vondra@2ndquadrant.com> wrote:
>> I don't dare to suggest rejecting the patch, but I don't see how we could
>> commit any of the patches at this point. So perhaps "returned with feedback"
>> and resubmitting in the next CF (along with analysis of improved workloads)
>> would be appropriate.
>
> I think it would be useful to have some kind of theoretical analysis
> of how much time we're spending waiting for various locks.  So, for
> example, suppose we one run of these tests with various client counts
> - say, 1, 8, 16, 32, 64, 96, 128, 192, 256 - and we run "select
> wait_event from pg_stat_activity" once per second throughout the test.
> Then we see how many times we get each wait event, including NULL (no
> wait event).  Now, from this, we can compute the approximate
> percentage of time we're spending waiting on CLogControlLock and every
> other lock, too, as well as the percentage of time we're not waiting
> for lock.  That, it seems to me, would give us a pretty clear idea
> what the maximum benefit we could hope for from reducing contention on
> any given lock might be.
>

As mentioned earlier, such an activity makes sense, however today,
again reading this thread, I noticed that Dilip has already posted
some analysis of lock contention upthread [1].  It is clear that patch
has reduced LWLock contention from ~28% to ~4% (where the major
contributor was TransactionIdSetPageStatus which has reduced from ~53%
to ~3%).  Isn't it inline with what you are looking for?


[1] - https://www.postgresql.org/message-id/CAFiTN-u-XEzhd%3DhNGW586fmQwdTy6Qy6_SXe09tNB%3DgBcVzZ_A%40mail.gmail.com

--
With Regards,
Amit Kapila.
EnterpriseDB: http://www.enterprisedb.com
On 09/23/2016 03:07 PM, Amit Kapila wrote:
> On Fri, Sep 23, 2016 at 6:16 PM, Tomas Vondra
> <tomas.vondra@2ndquadrant.com> wrote:
>> On 09/23/2016 01:44 AM, Tomas Vondra wrote:
>>>
>>> ...
>>> The 4.5 kernel clearly changed the results significantly:
>>>
>> ...
>>>
>>>
>>> (c) Although it's not visible in the results, 4.5.5 almost perfectly
>>> eliminated the fluctuations in the results. For example when 3.2.80
>>> produced this results (10 runs with the same parameters):
>>>
>>>     12118 11610 27939 11771 18065
>>>     12152 14375 10983 13614 11077
>>>
>>> we get this on 4.5.5
>>>
>>>     37354 37650 37371 37190 37233
>>>     38498 37166 36862 37928 38509
>>>
>>> Notice how much more even the 4.5.5 results are, compared to 3.2.80.
>>>
>>
>> The more I think about these random spikes in pgbench performance on 3.2.80,
>> the more I find them intriguing. Let me show you another example (from
>> Dilip's workload and group-update patch on 64 clients).
>>
>> This is on 3.2.80:
>>
>>   44175  34619  51944  38384  49066
>>   37004  47242  36296  46353  36180
>>
>> and on 4.5.5 it looks like this:
>>
>>   34400  35559  35436  34890  34626
>>   35233  35756  34876  35347  35486
>>
>> So the 4.5.5 results are much more even, but overall clearly below 3.2.80.
>> How does 3.2.80 manage to do ~50k tps in some of the runs? Clearly we
>> randomly do something right, but what is it and why doesn't it happen on the
>> new kernel? And how could we do it every time?
>>
>
> As far as I can see you are using default values of min_wal_size,
> max_wal_size, checkpoint related params, have you changed default
> shared_buffer settings, because that can have a bigger impact.

Huh? Where do you see me using default values? There are settings.log
with a dump of pg_settings data, and the modified values are

checkpoint_completion_target = 0.9
checkpoint_timeout = 3600
effective_io_concurrency = 32
log_autovacuum_min_duration = 100
log_checkpoints = on
log_line_prefix = %m
log_timezone = UTC
maintenance_work_mem = 524288
max_connections = 300
max_wal_size = 8192
min_wal_size = 1024
shared_buffers = 2097152
synchronous_commit = on
work_mem = 524288

(ignoring some irrelevant stuff like locales, timezone etc.).

> Using default values of mentioned parameters can lead to checkpoints in
> between your runs.

So I'm using 16GB shared buffers (so with scale 300 everything fits into
shared buffers), min_wal_size=16GB, max_wal_size=128GB, checkpoint
timeout 1h etc. So no, there are no checkpoints during the 5-minute
runs, only those triggered explicitly before each run.

> Also, I think instead of 5 mins, read-write runs should be run for 15
> mins to get consistent data.

Where does the inconsistency come from? Lack of warmup? Considering how
uniform the results from the 10 runs are (at least on 4.5.5), I claim
this is not an issue.

> For Dilip's workload where he is using only Select ... For Update, i
> think it is okay, but otherwise you need to drop and re-create the
> database between each run, otherwise data bloat could impact the
> readings.

And why should it affect 3.2.80 and 4.5.5 differently?

>
> I think in general, the impact should be same for both the kernels
> because you are using same parameters, but I think if use
> appropriate parameters, then you can get consistent results for
> 3.2.80. I have also seen variation in read-write tests, but the
> variation you are showing is really a matter of concern, because it
> will be difficult to rely on final data.
>

Both kernels use exactly the same parameters (fairly tuned, IMHO).


--
Tomas Vondra                  http://www.2ndQuadrant.com
PostgreSQL Development, 24x7 Support, Remote DBA, Training & Services
On 09/23/2016 02:59 PM, Pavan Deolasee wrote:
>
>
> On Fri, Sep 23, 2016 at 6:05 PM, Tomas Vondra
> <tomas.vondra@2ndquadrant.com <mailto:tomas.vondra@2ndquadrant.com>> wrote:
>
>     On 09/23/2016 05:10 AM, Amit Kapila wrote:
>
>         On Fri, Sep 23, 2016 at 5:14 AM, Tomas Vondra
>         <tomas.vondra@2ndquadrant.com
>         <mailto:tomas.vondra@2ndquadrant.com>> wrote:
>
>             On 09/21/2016 08:04 AM, Amit Kapila wrote:
>
>
>
>             (c) Although it's not visible in the results, 4.5.5 almost
>             perfectly
>             eliminated the fluctuations in the results. For example when
>             3.2.80 produced
>             this results (10 runs with the same parameters):
>
>                 12118 11610 27939 11771 18065
>                 12152 14375 10983 13614 11077
>
>             we get this on 4.5.5
>
>                 37354 37650 37371 37190 37233
>                 38498 37166 36862 37928 38509
>
>             Notice how much more even the 4.5.5 results are, compared to
>             3.2.80.
>
>
>         how long each run was?  Generally, I do half-hour run to get
>         stable results.
>
>
>     10 x 5-minute runs for each client count. The full shell script
>     driving the benchmark is here: http://bit.ly/2doY6ID and in short it
>     looks like this:
>
>         for r in `seq 1 $runs`; do
>             for c in 1 8 16 32 64 128 192; do
>                 psql -c checkpoint
>                 pgbench -j 8 -c $c ...
>             done
>         done
>
>
>
> I see couple of problems with the tests:
>
> 1. You're running regular pgbench, which also updates the small
> tables. At scale 300 and higher clients, there is going to heavy
> contention on the pgbench_branches table. Why not test with pgbench
> -N?

Sure, I can do a bunch of tests with pgbench -N. Good point.

But notice that I've also done the testing with Dilip's workload, and
the results are pretty much the same.

regards

--
Tomas Vondra                  http://www.2ndQuadrant.com
PostgreSQL Development, 24x7 Support, Remote DBA, Training & Services
On Fri, Sep 23, 2016 at 8:22 PM, Tomas Vondra
<tomas.vondra@2ndquadrant.com> wrote:
> On 09/23/2016 03:07 PM, Amit Kapila wrote:
>>
>> On Fri, Sep 23, 2016 at 6:16 PM, Tomas Vondra
>> <tomas.vondra@2ndquadrant.com> wrote:
>>>
>>> On 09/23/2016 01:44 AM, Tomas Vondra wrote:
>>>>
>>>>
>>>> ...
>>>> The 4.5 kernel clearly changed the results significantly:
>>>>
>>> ...
>>>>
>>>>
>>>>
>>>> (c) Although it's not visible in the results, 4.5.5 almost perfectly
>>>> eliminated the fluctuations in the results. For example when 3.2.80
>>>> produced this results (10 runs with the same parameters):
>>>>
>>>>     12118 11610 27939 11771 18065
>>>>     12152 14375 10983 13614 11077
>>>>
>>>> we get this on 4.5.5
>>>>
>>>>     37354 37650 37371 37190 37233
>>>>     38498 37166 36862 37928 38509
>>>>
>>>> Notice how much more even the 4.5.5 results are, compared to 3.2.80.
>>>>
>>>
>>> The more I think about these random spikes in pgbench performance on
>>> 3.2.80,
>>> the more I find them intriguing. Let me show you another example (from
>>> Dilip's workload and group-update patch on 64 clients).
>>>
>>> This is on 3.2.80:
>>>
>>>   44175  34619  51944  38384  49066
>>>   37004  47242  36296  46353  36180
>>>
>>> and on 4.5.5 it looks like this:
>>>
>>>   34400  35559  35436  34890  34626
>>>   35233  35756  34876  35347  35486
>>>
>>> So the 4.5.5 results are much more even, but overall clearly below
>>> 3.2.80.
>>> How does 3.2.80 manage to do ~50k tps in some of the runs? Clearly we
>>> randomly do something right, but what is it and why doesn't it happen on
>>> the
>>> new kernel? And how could we do it every time?
>>>
>>
>> As far as I can see you are using default values of min_wal_size,
>> max_wal_size, checkpoint related params, have you changed default
>> shared_buffer settings, because that can have a bigger impact.
>
>
> Huh? Where do you see me using default values?
>

I was referring to one of your script @ http://bit.ly/2doY6ID.  I
haven't noticed that you have changed default values in
postgresql.conf.

> There are settings.log with a
> dump of pg_settings data, and the modified values are
>
> checkpoint_completion_target = 0.9
> checkpoint_timeout = 3600
> effective_io_concurrency = 32
> log_autovacuum_min_duration = 100
> log_checkpoints = on
> log_line_prefix = %m
> log_timezone = UTC
> maintenance_work_mem = 524288
> max_connections = 300
> max_wal_size = 8192
> min_wal_size = 1024
> shared_buffers = 2097152
> synchronous_commit = on
> work_mem = 524288
>
> (ignoring some irrelevant stuff like locales, timezone etc.).
>
>> Using default values of mentioned parameters can lead to checkpoints in
>> between your runs.
>
>
> So I'm using 16GB shared buffers (so with scale 300 everything fits into
> shared buffers), min_wal_size=16GB, max_wal_size=128GB, checkpoint timeout
> 1h etc. So no, there are no checkpoints during the 5-minute runs, only those
> triggered explicitly before each run.
>

Thanks for clarification.  Do you think we should try some different
settings *_flush_after parameters as those can help in reducing spikes
in writes?

>> Also, I think instead of 5 mins, read-write runs should be run for 15
>> mins to get consistent data.
>
>
> Where does the inconsistency come from?

Thats what I am also curious to know.

> Lack of warmup?

Can't say, but at least we should try to rule out the possibilities.
I think one way to rule out is to do slightly longer runs for Dilip's
test cases and for pgbench we might need to drop and re-create
database after each reading.

> Considering how
> uniform the results from the 10 runs are (at least on 4.5.5), I claim this
> is not an issue.
>

It is quite possible that it is some kernel regression which might be
fixed in later version.  Like we are doing most tests in cthulhu which
has 3.10 version of kernel and we generally get consistent results.
I am not sure if later version of kernel say 4.5.5 is a net win,
because there is a considerable difference (dip) of performance in
that version, though it produces quite stable results.


--
With Regards,
Amit Kapila.
EnterpriseDB: http://www.enterprisedb.com
On 09/24/2016 06:06 AM, Amit Kapila wrote:
> On Fri, Sep 23, 2016 at 8:22 PM, Tomas Vondra
> <tomas.vondra@2ndquadrant.com> wrote:
>> ...>>
>> So I'm using 16GB shared buffers (so with scale 300 everything fits into
>> shared buffers), min_wal_size=16GB, max_wal_size=128GB, checkpoint timeout
>> 1h etc. So no, there are no checkpoints during the 5-minute runs, only those
>> triggered explicitly before each run.
>>
>
> Thanks for clarification.  Do you think we should try some different
> settings *_flush_after parameters as those can help in reducing spikes
> in writes?
>

I don't see why that settings would matter. The tests are on unlogged
tables, so there's almost no WAL traffic and checkpoints (triggered
explicitly before each run) look like this:

checkpoint complete: wrote 17 buffers (0.0%); 0 transaction log file(s)
added, 0 removed, 13 recycled; write=0.062 s, sync=0.006 s, total=0.092
s; sync files=10, longest=0.004 s, average=0.000 s; distance=309223 kB,
estimate=363742 kB

So I don't see how tuning the flushing would change anything, as we're
not doing any writes.

Moreover, the machine has a bunch of SSD drives (16 or 24, I don't
remember at the moment), behind a RAID controller with 2GB of write
cache on it.

>>> Also, I think instead of 5 mins, read-write runs should be run for 15
>>> mins to get consistent data.
>>
>>
>> Where does the inconsistency come from?
>
> Thats what I am also curious to know.
>
>> Lack of warmup?
>
> Can't say, but at least we should try to rule out the possibilities.
> I think one way to rule out is to do slightly longer runs for
> Dilip's test cases and for pgbench we might need to drop and
> re-create database after each reading.
>

My point is that it's unlikely to be due to insufficient warmup, because
the inconsistencies appear randomly - generally you get a bunch of slow
runs, one significantly faster one, then slow ones again.

I believe the runs to be sufficiently long. I don't see why recreating
the database would be useful - the whole point is to get the database
and shared buffers into a stable state, and then do measurements on it.

I don't think bloat is a major factor here - I'm collecting some
additional statistics during this run, including pg_database_size, and I
can see the size oscillates between 4.8GB and 5.4GB. That's pretty
negligible, I believe.

I'll let the current set of benchmarks complete - it's running on 4.5.5
now, I'll do tests on 3.2.80 too.

Then we can re-evaluate if longer runs are needed.

>> Considering how uniform the results from the 10 runs are (at least
>> on 4.5.5), I claim  this is not an issue.
>>
>
> It is quite possible that it is some kernel regression which might
> be fixed in later version. Like we are doing most tests in cthulhu
> which has 3.10 version of kernel and we generally get consistent
> results. I am not sure if later version of kernel say 4.5.5 is a net
> win, because there is a considerable difference (dip) of performance
> in that version, though it produces quite stable results.
>

Well, the thing is - the 4.5.5 behavior is much nicer in general. I'll
always prefer lower but more consistent performance (in most cases). In
any case, we're stuck with whatever kernel version the people are using,
and they're likely to use the newer ones.

regards

--
Tomas Vondra                  http://www.2ndQuadrant.com
PostgreSQL Development, 24x7 Support, Remote DBA, Training & Services
On 09/24/2016 08:28 PM, Tomas Vondra wrote:
> On 09/24/2016 06:06 AM, Amit Kapila wrote:
>> On Fri, Sep 23, 2016 at 8:22 PM, Tomas Vondra
>> <tomas.vondra@2ndquadrant.com> wrote:
>>> ...
>>>
>>> So I'm using 16GB shared buffers (so with scale 300 everything fits into
>>> shared buffers), min_wal_size=16GB, max_wal_size=128GB, checkpoint
>>> timeout
>>> 1h etc. So no, there are no checkpoints during the 5-minute runs,
>>> only those
>>> triggered explicitly before each run.
>>>
>>
>> Thanks for clarification.  Do you think we should try some different
>> settings *_flush_after parameters as those can help in reducing spikes
>> in writes?
>>
>
> I don't see why that settings would matter. The tests are on unlogged
> tables, so there's almost no WAL traffic and checkpoints (triggered
> explicitly before each run) look like this:
>
> checkpoint complete: wrote 17 buffers (0.0%); 0 transaction log file(s)
> added, 0 removed, 13 recycled; write=0.062 s, sync=0.006 s, total=0.092
> s; sync files=10, longest=0.004 s, average=0.000 s; distance=309223 kB,
> estimate=363742 kB
>
> So I don't see how tuning the flushing would change anything, as we're
> not doing any writes.
>
> Moreover, the machine has a bunch of SSD drives (16 or 24, I don't
> remember at the moment), behind a RAID controller with 2GB of write
> cache on it.
>
>>>> Also, I think instead of 5 mins, read-write runs should be run for 15
>>>> mins to get consistent data.
>>>
>>>
>>> Where does the inconsistency come from?
>>
>> Thats what I am also curious to know.
>>
>>> Lack of warmup?
>>
>> Can't say, but at least we should try to rule out the possibilities.
>> I think one way to rule out is to do slightly longer runs for
>> Dilip's test cases and for pgbench we might need to drop and
>> re-create database after each reading.
>>
>
> My point is that it's unlikely to be due to insufficient warmup, because
> the inconsistencies appear randomly - generally you get a bunch of slow
> runs, one significantly faster one, then slow ones again.
>
> I believe the runs to be sufficiently long. I don't see why recreating
> the database would be useful - the whole point is to get the database
> and shared buffers into a stable state, and then do measurements on it.
>
> I don't think bloat is a major factor here - I'm collecting some
> additional statistics during this run, including pg_database_size, and I
> can see the size oscillates between 4.8GB and 5.4GB. That's pretty
> negligible, I believe.
>
> I'll let the current set of benchmarks complete - it's running on 4.5.5
> now, I'll do tests on 3.2.80 too.
>
> Then we can re-evaluate if longer runs are needed.
>
>>> Considering how uniform the results from the 10 runs are (at least
>>> on 4.5.5), I claim  this is not an issue.
>>>
>>
>> It is quite possible that it is some kernel regression which might
>> be fixed in later version. Like we are doing most tests in cthulhu
>> which has 3.10 version of kernel and we generally get consistent
>> results. I am not sure if later version of kernel say 4.5.5 is a net
>> win, because there is a considerable difference (dip) of performance
>> in that version, though it produces quite stable results.
>>
>
> Well, the thing is - the 4.5.5 behavior is much nicer in general. I'll
> always prefer lower but more consistent performance (in most cases). In
> any case, we're stuck with whatever kernel version the people are using,
> and they're likely to use the newer ones.
>

So, I have the pgbench results from 3.2.80 and 4.5.5, and in general I
think it matches the previous results rather exactly, so it wasn't just
a fluke before.

The full results, including systat data and various database statistics
(pg_stat_* sampled every second) are available here:

     https://bitbucket.org/tvondra/group-clog-kernels

Attached are the per-run results. The averages (over the 10 runs, 5
minute each) look like this:

  3.2.80                 1      8     16     32     64    128    192
--------------------------------------------------------------------
  granular-locking    1567  12146  26341  44188  43263  49590  15042
  no-content-lock     1567  12180  25549  43787  43675  51800  16831
  group-update        1550  12018  26121  44451  42734  51455  15504
  master              1566  12057  25457  42299  42513  42562  10462

  4.5.5                  1      8     16     32     64    128    192
--------------------------------------------------------------------
  granular-locking    3018  19031  27394  29222  32032  34249  36191
  no-content-lock     2988  18871  27384  29260  32120  34456  36216
  group-update        2960  18848  26870  29025  32078  34259  35900
  master              2984  18917  26430  29065  32119  33924  35897

That is:

(1) The 3.2.80 performs a bit better than before, particularly for 128
and 256 clients - I'm not sure if it's thanks to the reboots or so.

(2) 4.5.5 performs measurably worse for >= 32 clients (by ~30%). That's
a pretty significant regression, on a fairly common workload.

(3) The patches somewhat help on 3.2.80, with 128 clients or more.

(4) There's no measurable improvement on 4.5.5.

As for the warmup, possible impact of database bloat etc. Attached are
two charts, illustrating how tps and database looks like over the whole
benchmark on 4.5.5 (~1440 minutes). Clearly, the behavior is very stable
- the database size oscillates around 5GB (which easily fits into
shared_buffers), and the tps is very stable over the 10 runs.  If the
warmup (or run duration) was insufficient, there'd be visible behavior
changes during the benchmark. So I believe the parameters are appropriate.

I've realized there actually is 3.10.101 kernel available on the
machine, so I'll repeat the pgbench on it too - perhaps that'll give us
some comparison to cthulhu, which is running 3.10 kernel too.

Then I'll run Dilip's workload on those three kernels (so far only the
simple pgbench was measured).

regards

--
Tomas Vondra                  http://www.2ndQuadrant.com
PostgreSQL Development, 24x7 Support, Remote DBA, Training & Services
Вложения
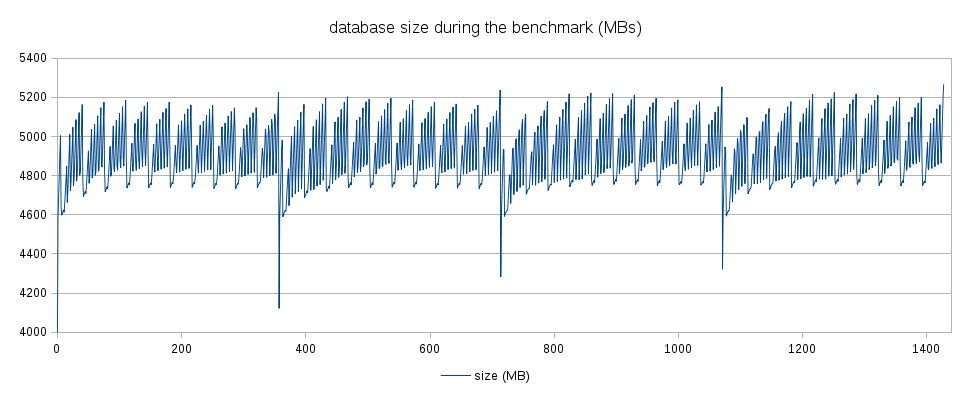
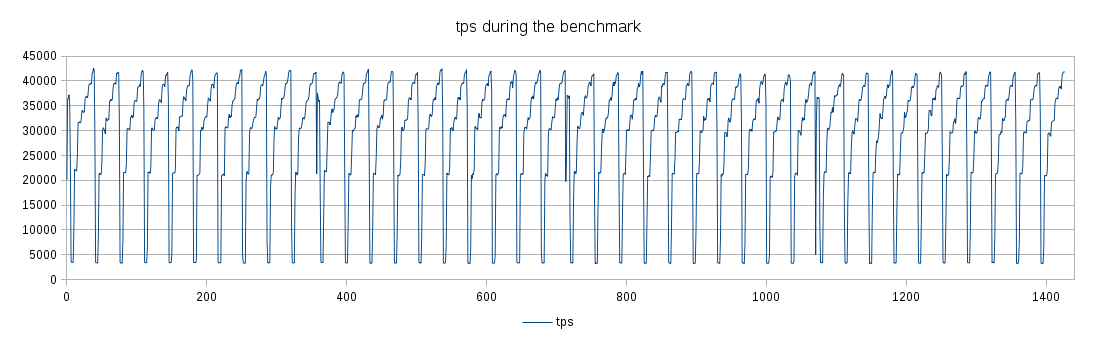
On Fri, Sep 23, 2016 at 9:20 AM, Amit Kapila <amit.kapila16@gmail.com> wrote:
> On Fri, Sep 23, 2016 at 6:50 AM, Robert Haas <robertmhaas@gmail.com> wrote:
>> On Thu, Sep 22, 2016 at 7:44 PM, Tomas Vondra
>> <tomas.vondra@2ndquadrant.com> wrote:
>>> I don't dare to suggest rejecting the patch, but I don't see how we could
>>> commit any of the patches at this point. So perhaps "returned with feedback"
>>> and resubmitting in the next CF (along with analysis of improved workloads)
>>> would be appropriate.
>>
>> I think it would be useful to have some kind of theoretical analysis
>> of how much time we're spending waiting for various locks.  So, for
>> example, suppose we one run of these tests with various client counts
>> - say, 1, 8, 16, 32, 64, 96, 128, 192, 256 - and we run "select
>> wait_event from pg_stat_activity" once per second throughout the test.
>> Then we see how many times we get each wait event, including NULL (no
>> wait event).  Now, from this, we can compute the approximate
>> percentage of time we're spending waiting on CLogControlLock and every
>> other lock, too, as well as the percentage of time we're not waiting
>> for lock.  That, it seems to me, would give us a pretty clear idea
>> what the maximum benefit we could hope for from reducing contention on
>> any given lock might be.
>>
> As mentioned earlier, such an activity makes sense, however today,
> again reading this thread, I noticed that Dilip has already posted
> some analysis of lock contention upthread [1].  It is clear that patch
> has reduced LWLock contention from ~28% to ~4% (where the major
> contributor was TransactionIdSetPageStatus which has reduced from ~53%
> to ~3%).  Isn't it inline with what you are looking for?

Hmm, yes.  But it's a little hard to interpret what that means; I
think the test I proposed in the quoted material above would provide
clearer data.

--
Robert Haas
EnterpriseDB: http://www.enterprisedb.com
The Enterprise PostgreSQL Company
On 09/26/2016 07:16 PM, Tomas Vondra wrote:
>
> The averages (over the 10 runs, 5 minute each) look like this:
>
>  3.2.80                 1      8     16     32     64    128    192
> --------------------------------------------------------------------
>  granular-locking    1567  12146  26341  44188  43263  49590  15042
>  no-content-lock     1567  12180  25549  43787  43675  51800  16831
>  group-update        1550  12018  26121  44451  42734  51455  15504
>  master              1566  12057  25457  42299  42513  42562  10462
>
>  4.5.5                  1      8     16     32     64    128    192
> --------------------------------------------------------------------
>  granular-locking    3018  19031  27394  29222  32032  34249  36191
>  no-content-lock     2988  18871  27384  29260  32120  34456  36216
>  group-update        2960  18848  26870  29025  32078  34259  35900
>  master              2984  18917  26430  29065  32119  33924  35897
>
> That is:
>
> (1) The 3.2.80 performs a bit better than before, particularly for 128
> and 256 clients - I'm not sure if it's thanks to the reboots or so.
>
> (2) 4.5.5 performs measurably worse for >= 32 clients (by ~30%). That's
> a pretty significant regression, on a fairly common workload.
>

FWIW, now that I think about this, the regression is roughly in line
with my findings presented in my recent blog post:
    http://blog.2ndquadrant.com/postgresql-vs-kernel-versions/

Those numbers were collected on a much smaller machine (2/4 cores only),
which might be why the difference observed on 32-core machine is much
more significant.

regards

--
Tomas Vondra                  http://www.2ndQuadrant.com
PostgreSQL Development, 24x7 Support, Remote DBA, Training & Services
On Wed, Sep 21, 2016 at 8:47 AM, Dilip Kumar <dilipbalaut@gmail.com> wrote:
> Summary:
> --------------
> At 32 clients no gain, I think at this workload Clog Lock is not a problem.
> At 64 Clients we can see ~10% gain with simple update and ~5% with TPCB.
> At 128 Clients we can see > 50% gain.
>
> Currently I have tested with synchronous commit=off, later I can try
> with on. I can also test at 80 client, I think we will see some
> significant gain at this client count also, but as of now I haven't
> yet tested.
>
> With above results, what we think ? should we continue our testing ?

I have done further testing with on TPCB workload to see the impact on
performance gain by increasing scale factor.

Again at 32 client there is no gain, but at 64 client gain is 12% and
at 128 client it's 75%, it shows that improvement with group lock is
better at higher scale factor (at 300 scale factor gain was 5% at 64
client and 50% at 128 clients).

8 socket machine (kernel 3.10)
10 min run(median of 3 run)
synchronous_commit=off
scal factor = 1000
share buffer= 40GB

Test results:
----------------

client      head         group lock
32          27496       27178
64          31275       35205
128        20656        34490


LWLOCK_STATS approx. block count on ClogControl Lock ("lwlock main 11")
--------------------------------------------------------------------------------------------------------
client      head      group lock
32          80000      60000
64        150000     100000
128      140000       70000

Note: These are approx. block count, I have detailed result of
LWLOCK_STAT, incase someone wants to look into.


LWLOCK_STATS shows that ClogControl lock block count reduced by 25% at
32 client, 33% at 64 client and 50% at 128 client.

Conclusion:
1. I think both  LWLOCK_STATS and performance data shows that we get
significant contention reduction on ClogControlLock with the patch.
2. It also shows that though we are not seeing any performance gain at
32 clients, but there is contention reduction with patch.

I am planning to do some more test with higher scale factor (3000 or more).

--
Regards,
Dilip Kumar
EnterpriseDB: http://www.enterprisedb.com
On 09/26/2016 08:48 PM, Tomas Vondra wrote:
> On 09/26/2016 07:16 PM, Tomas Vondra wrote:
>>
>> The averages (over the 10 runs, 5 minute each) look like this:
>>
>>  3.2.80                 1      8     16     32     64    128    192
>> --------------------------------------------------------------------
>>  granular-locking    1567  12146  26341  44188  43263  49590  15042
>>  no-content-lock     1567  12180  25549  43787  43675  51800  16831
>>  group-update        1550  12018  26121  44451  42734  51455  15504
>>  master              1566  12057  25457  42299  42513  42562  10462
>>
>>  4.5.5                  1      8     16     32     64    128    192
>> --------------------------------------------------------------------
>>  granular-locking    3018  19031  27394  29222  32032  34249  36191
>>  no-content-lock     2988  18871  27384  29260  32120  34456  36216
>>  group-update        2960  18848  26870  29025  32078  34259  35900
>>  master              2984  18917  26430  29065  32119  33924  35897
>>

So, I got the results from 3.10.101 (only the pgbench data), and it
looks like this:
 3.10.101               1      8     16     32     64    128    192
-------------------------------------------------------------------- granular-locking    2582  18492  33416  49583
53759 53572  51295 no-content-lock     2580  18666  33860  49976  54382  54012  51549 group-update        2635  18877
33806 49525  54787  54117  51718 master              2630  18783  33630  49451  54104  53199  50497


So 3.10.101 performs even better tnan 3.2.80 (and much better than
4.5.5), and there's no sign any of the patches making a difference.

It also seems there's a major regression in the kernel, somewhere
between 3.10 and 4.5. With 64 clients, 3.10 does ~54k transactions,
while 4.5 does only ~32k - that's helluva difference.

I wonder if this might be due to running the benchmark on unlogged
tables (and thus not waiting for WAL), but I don't see why that should
result in such drop on a new kernel.

In any case, this seems like an issue unrelated to the patch, so I'll
post further data into a new thread instead of hijacking this one.

regards

--
Tomas Vondra                  http://www.2ndQuadrant.com
PostgreSQL Development, 24x7 Support, Remote DBA, Training & Services
On Tue, Sep 27, 2016 at 5:15 PM, Tomas Vondra
<tomas.vondra@2ndquadrant.com> wrote:
> So, I got the results from 3.10.101 (only the pgbench data), and it looks
> like this:
>
>  3.10.101               1      8     16     32     64    128    192
> --------------------------------------------------------------------
>  granular-locking    2582  18492  33416  49583  53759  53572  51295
>  no-content-lock     2580  18666  33860  49976  54382  54012  51549
>  group-update        2635  18877  33806  49525  54787  54117  51718
>  master              2630  18783  33630  49451  54104  53199  50497
>
> So 3.10.101 performs even better tnan 3.2.80 (and much better than 4.5.5),
> and there's no sign any of the patches making a difference.

I'm sure that you mentioned this upthread somewhere, but I can't
immediately find it.  What scale factor are you testing here?

It strikes me that the larger the scale factor, the more
CLogControlLock contention we expect to have.  We'll pretty much do
one CLOG access per update, and the more rows there are, the more
chance there is that the next update hits an "old" row that hasn't
been updated in a long time.  So a larger scale factor also increases
the number of active CLOG pages and, presumably therefore, the amount
of CLOG paging activity.

--
Robert Haas
EnterpriseDB: http://www.enterprisedb.com
The Enterprise PostgreSQL Company
On 09/28/2016 05:39 PM, Robert Haas wrote:
> On Tue, Sep 27, 2016 at 5:15 PM, Tomas Vondra
> <tomas.vondra@2ndquadrant.com> wrote:
>> So, I got the results from 3.10.101 (only the pgbench data), and it looks
>> like this:
>>
>>  3.10.101               1      8     16     32     64    128    192
>> --------------------------------------------------------------------
>>  granular-locking    2582  18492  33416  49583  53759  53572  51295
>>  no-content-lock     2580  18666  33860  49976  54382  54012  51549
>>  group-update        2635  18877  33806  49525  54787  54117  51718
>>  master              2630  18783  33630  49451  54104  53199  50497
>>
>> So 3.10.101 performs even better tnan 3.2.80 (and much better than 4.5.5),
>> and there's no sign any of the patches making a difference.
>
> I'm sure that you mentioned this upthread somewhere, but I can't
> immediately find it.  What scale factor are you testing here?
>

300, the same scale factor as Dilip.

>
> It strikes me that the larger the scale factor, the more
> CLogControlLock contention we expect to have.  We'll pretty much do
> one CLOG access per update, and the more rows there are, the more
> chance there is that the next update hits an "old" row that hasn't
> been updated in a long time.  So a larger scale factor also
> increases the number of active CLOG pages and, presumably therefore,
> the amount of CLOG paging activity.>

So, is 300 too little? I don't think so, because Dilip saw some benefit
from that. Or what scale factor do we think is needed to reproduce the
benefit? My machine has 256GB of ram, so I can easily go up to 15000 and
still keep everything in RAM. But is it worth it?

regards

--
Tomas Vondra                  http://www.2ndQuadrant.com
PostgreSQL Development, 24x7 Support, Remote DBA, Training & Services
On Wed, Sep 28, 2016 at 6:45 PM, Tomas Vondra
<tomas.vondra@2ndquadrant.com> wrote:
> So, is 300 too little? I don't think so, because Dilip saw some benefit from
> that. Or what scale factor do we think is needed to reproduce the benefit?
> My machine has 256GB of ram, so I can easily go up to 15000 and still keep
> everything in RAM. But is it worth it?

Dunno.  But it might be worth a test or two at, say, 5000, just to see
if that makes any difference.

I feel like we must be missing something here.  If Dilip is seeing
huge speedups and you're seeing nothing, something is different, and
we don't know what it is.  Even if the test case is artificial, it
ought to be the same when one of you runs it as when the other runs
it.  Right?

--
Robert Haas
EnterpriseDB: http://www.enterprisedb.com
The Enterprise PostgreSQL Company
On 09/29/2016 01:59 AM, Robert Haas wrote:
> On Wed, Sep 28, 2016 at 6:45 PM, Tomas Vondra
> <tomas.vondra@2ndquadrant.com> wrote:
>> So, is 300 too little? I don't think so, because Dilip saw some benefit from
>> that. Or what scale factor do we think is needed to reproduce the benefit?
>> My machine has 256GB of ram, so I can easily go up to 15000 and still keep
>> everything in RAM. But is it worth it?
>
> Dunno. But it might be worth a test or two at, say, 5000, just to
> see if that makes any difference.
>

OK, I have some benchmarks to run on that machine, but I'll do a few
tests with scale 5000 - probably sometime next week. I don't think the
delay matters very much, as it's clear the patch will end up with RwF in
this CF round.

> I feel like we must be missing something here.  If Dilip is seeing
> huge speedups and you're seeing nothing, something is different, and
> we don't know what it is.  Even if the test case is artificial, it
> ought to be the same when one of you runs it as when the other runs
> it.  Right?
>

Yes, definitely - we're missing something important, I think. One
difference is that Dilip is using longer runs, but I don't think that's
a problem (as I demonstrated how stable the results are).

I wonder what CPU model is Dilip using - I know it's x86, but not which
generation it is. I'm using E5-4620 v1 Xeon, perhaps Dilip is using a
newer model and it makes a difference (although that seems unlikely).

regards

--
Tomas Vondra                  http://www.2ndQuadrant.com
PostgreSQL Development, 24x7 Support, Remote DBA, Training & Services
On Thu, Sep 29, 2016 at 6:40 AM, Tomas Vondra
<tomas.vondra@2ndquadrant.com> wrote:
> Yes, definitely - we're missing something important, I think. One difference
> is that Dilip is using longer runs, but I don't think that's a problem (as I
> demonstrated how stable the results are).
>
> I wonder what CPU model is Dilip using - I know it's x86, but not which
> generation it is. I'm using E5-4620 v1 Xeon, perhaps Dilip is using a newer
> model and it makes a difference (although that seems unlikely).

I am using "Intel(R) Xeon(R) CPU E7- 8830  @ 2.13GHz "


--
Regards,
Dilip Kumar
EnterpriseDB: http://www.enterprisedb.com
On Thu, Sep 29, 2016 at 12:56 PM, Dilip Kumar <dilipbalaut@gmail.com> wrote:
> On Thu, Sep 29, 2016 at 6:40 AM, Tomas Vondra
> <tomas.vondra@2ndquadrant.com> wrote:
>> Yes, definitely - we're missing something important, I think. One difference
>> is that Dilip is using longer runs, but I don't think that's a problem (as I
>> demonstrated how stable the results are).
>>
>> I wonder what CPU model is Dilip using - I know it's x86, but not which
>> generation it is. I'm using E5-4620 v1 Xeon, perhaps Dilip is using a newer
>> model and it makes a difference (although that seems unlikely).
>
> I am using "Intel(R) Xeon(R) CPU E7- 8830  @ 2.13GHz "
>

Another difference is that m/c on which Dilip is doing tests has 8 sockets.

--
With Regards,
Amit Kapila.
EnterpriseDB: http://www.enterprisedb.com
On Wed, Sep 28, 2016 at 9:10 PM, Tomas Vondra
<tomas.vondra@2ndquadrant.com> wrote:
>> I feel like we must be missing something here.  If Dilip is seeing
>> huge speedups and you're seeing nothing, something is different, and
>> we don't know what it is.  Even if the test case is artificial, it
>> ought to be the same when one of you runs it as when the other runs
>> it.  Right?
>>
> Yes, definitely - we're missing something important, I think. One difference
> is that Dilip is using longer runs, but I don't think that's a problem (as I
> demonstrated how stable the results are).

It's not impossible that the longer runs could matter - performance
isn't necessarily stable across time during a pgbench test, and the
longer the run the more CLOG pages it will fill.

> I wonder what CPU model is Dilip using - I know it's x86, but not which
> generation it is. I'm using E5-4620 v1 Xeon, perhaps Dilip is using a newer
> model and it makes a difference (although that seems unlikely).

The fact that he's using an 8-socket machine seems more likely to
matter than the CPU generation, which isn't much different.  Maybe
Dilip should try this on a 2-socket machine and see if he sees the
same kinds of results.

--
Robert Haas
EnterpriseDB: http://www.enterprisedb.com
The Enterprise PostgreSQL Company
On 09/29/2016 03:47 PM, Robert Haas wrote:
> On Wed, Sep 28, 2016 at 9:10 PM, Tomas Vondra
> <tomas.vondra@2ndquadrant.com> wrote:
>>> I feel like we must be missing something here.  If Dilip is seeing
>>> huge speedups and you're seeing nothing, something is different, and
>>> we don't know what it is.  Even if the test case is artificial, it
>>> ought to be the same when one of you runs it as when the other runs
>>> it.  Right?
>>>
>> Yes, definitely - we're missing something important, I think. One difference
>> is that Dilip is using longer runs, but I don't think that's a problem (as I
>> demonstrated how stable the results are).
>
> It's not impossible that the longer runs could matter - performance
> isn't necessarily stable across time during a pgbench test, and the
> longer the run the more CLOG pages it will fill.
>

Sure, but I'm not doing just a single pgbench run. I do a sequence of
pgbench runs, with different client counts, with ~6h of total runtime.
There's a checkpoint in between the runs, but as those benchmarks are on
unlogged tables, that flushes only very few buffers.

Also, the clog SLRU has 128 pages, which is ~1MB of clog data, i.e. ~4M
transactions. On some kernels (3.10 and 3.12) I can get >50k tps with 64
clients or more, which means we fill the 128 pages in less than 80 seconds.

So half-way through the run only 50% of clog pages fits into the SLRU,
and we have a data set with 30M tuples, with uniform random access - so
it seems rather unlikely we'll get transaction that's still in the SLRU.

But sure, I can do a run with larger data set to verify this.

>> I wonder what CPU model is Dilip using - I know it's x86, but not which
>> generation it is. I'm using E5-4620 v1 Xeon, perhaps Dilip is using a newer
>> model and it makes a difference (although that seems unlikely).
>
> The fact that he's using an 8-socket machine seems more likely to
> matter than the CPU generation, which isn't much different.  Maybe
> Dilip should try this on a 2-socket machine and see if he sees the
> same kinds of results.
>

Maybe. I wouldn't expect a major difference between 4 and 8 sockets, but
I may be wrong.

regards

--
Tomas Vondra                  http://www.2ndQuadrant.com
PostgreSQL Development, 24x7 Support, Remote DBA, Training & Services
On Thu, Sep 29, 2016 at 10:14 AM, Tomas Vondra
<tomas.vondra@2ndquadrant.com> wrote:
>> It's not impossible that the longer runs could matter - performance
>> isn't necessarily stable across time during a pgbench test, and the
>> longer the run the more CLOG pages it will fill.
>
> Sure, but I'm not doing just a single pgbench run. I do a sequence of
> pgbench runs, with different client counts, with ~6h of total runtime.
> There's a checkpoint in between the runs, but as those benchmarks are on
> unlogged tables, that flushes only very few buffers.
>
> Also, the clog SLRU has 128 pages, which is ~1MB of clog data, i.e. ~4M
> transactions. On some kernels (3.10 and 3.12) I can get >50k tps with 64
> clients or more, which means we fill the 128 pages in less than 80 seconds.
>
> So half-way through the run only 50% of clog pages fits into the SLRU, and
> we have a data set with 30M tuples, with uniform random access - so it seems
> rather unlikely we'll get transaction that's still in the SLRU.
>
> But sure, I can do a run with larger data set to verify this.

OK, another theory: Dilip is, I believe, reinitializing for each run,
and you are not.  Maybe somehow the effect Dilip is seeing only
happens with a newly-initialized set of pgbench tables.  For example,
maybe the patches cause a huge improvement when all rows have the same
XID, but the effect fades rapidly once the XIDs spread out...

I'm not saying any of what I'm throwing out here is worth the
electrons upon which it is printed, just that there has to be some
explanation.

--
Robert Haas
EnterpriseDB: http://www.enterprisedb.com
The Enterprise PostgreSQL Company
On Thu, Sep 29, 2016 at 8:05 PM, Robert Haas <robertmhaas@gmail.com> wrote:
> OK, another theory: Dilip is, I believe, reinitializing for each run,
> and you are not.

Yes, I am reinitializing for each run.


--
Regards,
Dilip Kumar
EnterpriseDB: http://www.enterprisedb.com
Hi,

After collecting a lot more results from multiple kernel versions, I can
confirm that I see a significant improvement with 128 and 192 clients,
roughly by 30%:
                           64        128        192    ------------------------------------------------     master
      62482      43181      50985     granular-locking   61701      59611      47483     no-content-lock    62650
59819     47895     group-update       63702      64758      62596


But I only see this with Dilip's workload, and only with pre-4.3.0
kernels (the results above are from kernel 3.19).

With 4.5.5, results for the same benchmark look like this:
                           64        128        192    ------------------------------------------------     master
      35693      39822      42151     granular-locking   35370      39409      41353     no-content-lock    36201
39848     42407     group-update       35697      39893      42667


That seems like a fairly bad regression in kernel, although I have not
identified the feature/commit causing it (and it's also possible the
issue lies somewhere else, of course).

With regular pgbench, I see no improvement on any kernel version. For
example on 3.19 the results look like this:
                           64        128        192    ------------------------------------------------     master
      54661      61014      59484     granular-locking   55904      62481      60711     no-content-lock    56182
62442     61234     group-update       55019      61587      60485


I haven't done much more testing (e.g. with -N to eliminate collisions
on branches) yet, let's see if it changes anything.

regards

--
Tomas Vondra                  http://www.2ndQuadrant.com
PostgreSQL Development, 24x7 Support, Remote DBA, Training & Services
On Wed, Oct 5, 2016 at 12:05 PM, Tomas Vondra
<tomas.vondra@2ndquadrant.com> wrote:
> Hi,
>
> After collecting a lot more results from multiple kernel versions, I can
> confirm that I see a significant improvement with 128 and 192 clients,
> roughly by 30%:
>
>                            64        128        192
>     ------------------------------------------------
>      master             62482      43181      50985
>      granular-locking   61701      59611      47483
>      no-content-lock    62650      59819      47895
>      group-update       63702      64758      62596
>
> But I only see this with Dilip's workload, and only with pre-4.3.0 kernels
> (the results above are from kernel 3.19).
>

That appears positive.

> With 4.5.5, results for the same benchmark look like this:
>
>                            64        128        192
>     ------------------------------------------------
>      master             35693      39822      42151
>      granular-locking   35370      39409      41353
>      no-content-lock    36201      39848      42407
>      group-update       35697      39893      42667
>
> That seems like a fairly bad regression in kernel, although I have not
> identified the feature/commit causing it (and it's also possible the issue
> lies somewhere else, of course).
>
> With regular pgbench, I see no improvement on any kernel version. For
> example on 3.19 the results look like this:
>
>                            64        128        192
>     ------------------------------------------------
>      master             54661      61014      59484
>      granular-locking   55904      62481      60711
>      no-content-lock    56182      62442      61234
>      group-update       55019      61587      60485
>

Are the above results with synchronous_commit=off?

> I haven't done much more testing (e.g. with -N to eliminate collisions on
> branches) yet, let's see if it changes anything.
>

Yeah, let us see how it behaves with -N.  Also, I think we could try
at higher scale factor?


--
With Regards,
Amit Kapila.
EnterpriseDB: http://www.enterprisedb.com
On 10/05/2016 10:03 AM, Amit Kapila wrote:
> On Wed, Oct 5, 2016 at 12:05 PM, Tomas Vondra
> <tomas.vondra@2ndquadrant.com> wrote:
>> Hi,
>>
>> After collecting a lot more results from multiple kernel versions, I can
>> confirm that I see a significant improvement with 128 and 192 clients,
>> roughly by 30%:
>>
>>                            64        128        192
>>     ------------------------------------------------
>>      master             62482      43181      50985
>>      granular-locking   61701      59611      47483
>>      no-content-lock    62650      59819      47895
>>      group-update       63702      64758      62596
>>
>> But I only see this with Dilip's workload, and only with pre-4.3.0 kernels
>> (the results above are from kernel 3.19).
>>
>
> That appears positive.
>

I got access to a large machine with 72/144 cores (thanks to Oleg and
Alexander from Postgres Professional), and I'm running the tests on that
machine too.

Results from Dilip's workload (with scale 300, unlogged tables) look
like this:
                        32      64    128     192    224     256    288  master            104943  128579  72167
100967 66631   97088  63767  granular-locking  103415  141689  83780  120480  71847  115201  67240  group-update
105343 144322  92229  130149  81247  126629  76638  no-content-lock   103153  140568  80101  119185  70004  115386
66199

So there's some 20-30% improvement for >= 128 clients.

But what I find much more intriguing is the zig-zag behavior. I mean, 64
clients give ~130k tps, 128 clients only give ~70k but 192 clients jump
up to >100k tps again, etc.

FWIW I don't see any such behavior on pgbench, and all those tests were
done on the same cluster.

>> With 4.5.5, results for the same benchmark look like this:
>>
>>                            64        128        192
>>     ------------------------------------------------
>>      master             35693      39822      42151
>>      granular-locking   35370      39409      41353
>>      no-content-lock    36201      39848      42407
>>      group-update       35697      39893      42667
>>
>> That seems like a fairly bad regression in kernel, although I have not
>> identified the feature/commit causing it (and it's also possible the issue
>> lies somewhere else, of course).
>>
>> With regular pgbench, I see no improvement on any kernel version. For
>> example on 3.19 the results look like this:
>>
>>                            64        128        192
>>     ------------------------------------------------
>>      master             54661      61014      59484
>>      granular-locking   55904      62481      60711
>>      no-content-lock    56182      62442      61234
>>      group-update       55019      61587      60485
>>
>
> Are the above results with synchronous_commit=off?
>

No, but I can do that.

>> I haven't done much more testing (e.g. with -N to eliminate
>> collisions on branches) yet, let's see if it changes anything.
>>
>
> Yeah, let us see how it behaves with -N. Also, I think we could try
> at higher scale factor?
>

Yes, I plan to do that. In total, I plan to test combinations of:

(a) Dilip's workload and pgbench (regular and -N)
(b) logged and unlogged tables
(c) scale 300 and scale 3000 (both fits into RAM)
(d) sync_commit=on/off

regards

--
Tomas Vondra                  http://www.2ndQuadrant.com
PostgreSQL Development, 24x7 Support, Remote DBA, Training & Services
On Fri, Oct 7, 2016 at 3:02 PM, Tomas Vondra
<tomas.vondra@2ndquadrant.com> wrote:
>
> I got access to a large machine with 72/144 cores (thanks to Oleg and
> Alexander from Postgres Professional), and I'm running the tests on that
> machine too.
>
> Results from Dilip's workload (with scale 300, unlogged tables) look like
> this:
>
>                         32      64    128     192    224     256    288
>   master            104943  128579  72167  100967  66631   97088  63767
>   granular-locking  103415  141689  83780  120480  71847  115201  67240
>   group-update      105343  144322  92229  130149  81247  126629  76638
>   no-content-lock   103153  140568  80101  119185  70004  115386  66199
>
> So there's some 20-30% improvement for >= 128 clients.
>

So here we see performance improvement starting at 64 clients, this is
somewhat similar to what Dilip saw in his tests.

> But what I find much more intriguing is the zig-zag behavior. I mean, 64
> clients give ~130k tps, 128 clients only give ~70k but 192 clients jump up
> to >100k tps again, etc.
>

No clear answer.

> FWIW I don't see any such behavior on pgbench, and all those tests were done
> on the same cluster.
>
>>> With 4.5.5, results for the same benchmark look like this:
>>>
>>>                            64        128        192
>>>     ------------------------------------------------
>>>      master             35693      39822      42151
>>>      granular-locking   35370      39409      41353
>>>      no-content-lock    36201      39848      42407
>>>      group-update       35697      39893      42667
>>>
>>> That seems like a fairly bad regression in kernel, although I have not
>>> identified the feature/commit causing it (and it's also possible the
>>> issue
>>> lies somewhere else, of course).
>>>
>>> With regular pgbench, I see no improvement on any kernel version. For
>>> example on 3.19 the results look like this:
>>>
>>>                            64        128        192
>>>     ------------------------------------------------
>>>      master             54661      61014      59484
>>>      granular-locking   55904      62481      60711
>>>      no-content-lock    56182      62442      61234
>>>      group-update       55019      61587      60485
>>>
>>
>> Are the above results with synchronous_commit=off?
>>
>
> No, but I can do that.
>
>>> I haven't done much more testing (e.g. with -N to eliminate
>>> collisions on branches) yet, let's see if it changes anything.
>>>
>>
>> Yeah, let us see how it behaves with -N. Also, I think we could try
>> at higher scale factor?
>>
>
> Yes, I plan to do that. In total, I plan to test combinations of:
>
> (a) Dilip's workload and pgbench (regular and -N)
> (b) logged and unlogged tables
> (c) scale 300 and scale 3000 (both fits into RAM)
> (d) sync_commit=on/off
>

sounds sensible.

Thanks for doing the tests.


--
With Regards,
Amit Kapila.
EnterpriseDB: http://www.enterprisedb.com
On 10/08/2016 07:47 AM, Amit Kapila wrote:
> On Fri, Oct 7, 2016 at 3:02 PM, Tomas Vondra
> <tomas.vondra@2ndquadrant.com> wrote:>> ...>
>> In total, I plan to test combinations of:
>>
>> (a) Dilip's workload and pgbench (regular and -N)
>> (b) logged and unlogged tables
>> (c) scale 300 and scale 3000 (both fits into RAM)
>> (d) sync_commit=on/off
>>
>
> sounds sensible.
>
> Thanks for doing the tests.
>

FWIW I've started those tests on the big machine provided by Oleg and
Alexander, an estimate to complete all the benchmarks is 9 days. The
results will be pushed
   to https://bitbucket.org/tvondra/hp05-results/src

after testing each combination (every ~9 hours). Inspired by Robert's
wait event post a few days ago, I've added wait event sampling so that
we can perform similar analysis. (Neat idea!)

While messing with the kernel on the other machine I've managed to
misconfigure it to the extent that it's not accessible anymore. I'll
start similar benchmarks once I find someone with console access who can
fix the boot.

regards

--
Tomas Vondra                  http://www.2ndQuadrant.com
PostgreSQL Development, 24x7 Support, Remote DBA, Training & Services
On Mon, Oct 10, 2016 at 2:17 AM, Tomas Vondra
<tomas.vondra@2ndquadrant.com> wrote:
> after testing each combination (every ~9 hours). Inspired by Robert's wait
> event post a few days ago, I've added wait event sampling so that we can
> perform similar analysis. (Neat idea!)

I have done wait event test on for head vs group lock patch.
I have used similar script what Robert has mentioned in below thread

https://www.postgresql.org/message-id/CA+Tgmoav9Q5v5ZGT3+wP_1tQjT6TGYXrwrDcTRrWimC+ZY7RRA@mail.gmail.com

Test details and Results:
--------------------------------
Machine, POWER, 4 socket machine (machine details are attached in file.)

30-minute pgbench runs with
configurations,
had max_connections = 200,
shared_buffers = 8GB,
maintenance_work_mem = 4GB,
synchronous_commit =off,
checkpoint_timeout = 15min,
checkpoint_completion_target = 0.9,
log_line_prefix = '%t [%p]
max_wal_size = 40GB,
log_checkpoints =on.

Test1: unlogged table, 192 clients
---------------------------------------------
On Head:
tps = 44898.862257 (including connections establishing)
tps = 44899.761934 (excluding connections establishing)

 262092  LWLockNamed     | CLogControlLock
 224396                  |
 114510  Lock            | transactionid
  42908  Client          | ClientRead
  20610  Lock            | tuple
  13700  LWLockTranche   | buffer_content
   3637
   2562  LWLockNamed     | XidGenLock
   2359  LWLockNamed     | ProcArrayLock
   1037  Lock            | extend
    948  LWLockTranche   | lock_manager
     46  LWLockTranche   | wal_insert
     12  BufferPin       | BufferPin
      4  LWLockTranche   | buffer_mapping

With Patch:

tps = 77846.622956 (including connections establishing)
tps = 77848.234046 (excluding connections establishing)

 101832  Lock            | transactionid
  91358  Client          | ClientRead
  16691  LWLockNamed     | XidGenLock
  12467  Lock            | tuple
   6007  LWLockNamed     | CLogControlLock
   3640
   3531  LWLockNamed     | ProcArrayLock
   3390  LWLockTranche   | lock_manager
   2683  Lock            | extend
   1112  LWLockTranche   | buffer_content
     72  LWLockTranche   | wal_insert
      8  LWLockTranche   | buffer_mapping
      2  LWLockTranche   | proc
      2  BufferPin       | BufferPin


Test2: unlogged table, 96 clients
------------------------------------------
On head:
tps = 58632.065563 (including connections establishing)
tps = 58632.767384 (excluding connections establishing)
  77039  LWLockNamed     | CLogControlLock
  39712  Client          | ClientRead
  18358  Lock            | transactionid
   4238  LWLockNamed     | XidGenLock
   3638
   3518  LWLockTranche   | buffer_content
   2717  LWLockNamed     | ProcArrayLock
   1410  Lock            | tuple
    792  Lock            | extend
    182  LWLockTranche   | lock_manager
     30  LWLockTranche   | wal_insert
      3  LWLockTranche   | buffer_mapping
      1 Tuples only is on.
      1  BufferPin       | BufferPin

With Patch:
tps = 75204.166640 (including connections establishing)
tps = 75204.922105 (excluding connections establishing)
[dilip.kumar@power2 bin]$ cat out_300_96_ul.txt
 261917                  |
  53407  Client          | ClientRead
  14994  Lock            | transactionid
   5258  LWLockNamed     | XidGenLock
   3660
   3604  LWLockNamed     | ProcArrayLock
   2096  LWLockNamed     | CLogControlLock
   1102  Lock            | tuple
    823  Lock            | extend
    481  LWLockTranche   | buffer_content
    372  LWLockTranche   | lock_manager
    192  Lock            | relation
     65  LWLockTranche   | wal_insert
      6  LWLockTranche   | buffer_mapping
      1 Tuples only is on.
      1  LWLockTranche   | proc


Test3: unlogged table, 64 clients
------------------------------------------
On Head:

tps = 66231.203018 (including connections establishing)
tps = 66231.664990 (excluding connections establishing)

  43446  Client          | ClientRead
   6992  LWLockNamed     | CLogControlLock
   4685  Lock            | transactionid
   3650
   3381  LWLockNamed     | ProcArrayLock
    810  LWLockNamed     | XidGenLock
    734  Lock            | extend
    439  LWLockTranche   | buffer_content
    247  Lock            | tuple
    136  LWLockTranche   | lock_manager
     64  Lock            | relation
     24  LWLockTranche   | wal_insert
      2  LWLockTranche   | buffer_mapping
      1 Tuples only is on.


With Patch:
tps = 67294.042602 (including connections establishing)
tps = 67294.532650 (excluding connections establishing)

  28186  Client          | ClientRead
   3655
   1172  LWLockNamed     | ProcArrayLock
    619  Lock            | transactionid
    289  LWLockNamed     | CLogControlLock
    237  Lock            | extend
     81  LWLockTranche   | buffer_content
     48  LWLockNamed     | XidGenLock
     28  LWLockTranche   | lock_manager
     23  Lock            | tuple
      6  LWLockTranche   | wal_insert


Test4:  unlogged table, 32 clients

Head:
tps = 52320.190549 (including connections establishing)
tps = 52320.442694 (excluding connections establishing)

  28564  Client          | ClientRead
   3663
   1320  LWLockNamed     | ProcArrayLock
    742  Lock            | transactionid
    534  LWLockNamed     | CLogControlLock
    255  Lock            | extend
    108  LWLockNamed     | XidGenLock
     81  LWLockTranche   | buffer_content
     44  LWLockTranche   | lock_manager
     29  Lock            | tuple
      6  LWLockTranche   | wal_insert
      1 Tuples only is on.
      1  LWLockTranche   | buffer_mapping

With Patch:
tps = 47505.582315 (including connections establishing)
tps = 47505.773351 (excluding connections establishing)

  28186  Client          | ClientRead
   3655
   1172  LWLockNamed     | ProcArrayLock
    619  Lock            | transactionid
    289  LWLockNamed     | CLogControlLock
    237  Lock            | extend
     81  LWLockTranche   | buffer_content
     48  LWLockNamed     | XidGenLock
     28  LWLockTranche   | lock_manager
     23  Lock            | tuple
      6  LWLockTranche   | wal_insert

I think at higher client count from client count 96 onwards contention
on CLogControlLock is clearly visible and which is completely solved
with group lock patch.

And at lower client count 32,64  contention on CLogControlLock is not
significant hence we can not see any gain with group lock patch.
(though we can see some contention on CLogControlLock is reduced at 64
clients.)

Note: Here I have taken only one set of reading, and at 32 client my
reading shows some regression with group lock patch, which may be run
to run variance (because earlier I never saw this regression, I can
confirm again with multiple runs).


--
Regards,
Dilip Kumar
EnterpriseDB: http://www.enterprisedb.com
Вложения
On Wed, Oct 12, 2016 at 3:21 AM, Dilip Kumar <dilipbalaut@gmail.com> wrote:
> I think at higher client count from client count 96 onwards contention
> on CLogControlLock is clearly visible and which is completely solved
> with group lock patch.
>
> And at lower client count 32,64  contention on CLogControlLock is not
> significant hence we can not see any gain with group lock patch.
> (though we can see some contention on CLogControlLock is reduced at 64
> clients.)

I agree with these conclusions.  I had a chance to talk with Andres
this morning at Postgres Vision and based on that conversation I'd
like to suggest a couple of additional tests:

1. Repeat this test on x86.  In particular, I think you should test on
the EnterpriseDB server cthulhu, which is an 8-socket x86 server.

2. Repeat this test with a mixed read-write workload, like -b
tpcb-like@1 -b select-only@9

--
Robert Haas
EnterpriseDB: http://www.enterprisedb.com
The Enterprise PostgreSQL Company
On 10/12/2016 08:55 PM, Robert Haas wrote:
> On Wed, Oct 12, 2016 at 3:21 AM, Dilip Kumar <dilipbalaut@gmail.com> wrote:
>> I think at higher client count from client count 96 onwards contention
>> on CLogControlLock is clearly visible and which is completely solved
>> with group lock patch.
>>
>> And at lower client count 32,64  contention on CLogControlLock is not
>> significant hence we can not see any gain with group lock patch.
>> (though we can see some contention on CLogControlLock is reduced at 64
>> clients.)
>
> I agree with these conclusions.  I had a chance to talk with Andres
> this morning at Postgres Vision and based on that conversation I'd
> like to suggest a couple of additional tests:
>
> 1. Repeat this test on x86.  In particular, I think you should test on
> the EnterpriseDB server cthulhu, which is an 8-socket x86 server.
>
> 2. Repeat this test with a mixed read-write workload, like -b
> tpcb-like@1 -b select-only@9
>

FWIW, I'm already running similar benchmarks on an x86 machine with 72
cores (144 with HT). It's "just" a 4-socket system, but the results I
got so far seem quite interesting. The tooling and results (pushed
incrementally) are available here:
   https://bitbucket.org/tvondra/hp05-results/overview

The tooling is completely automated, and it also collects various stats,
like for example the wait event. So perhaps we could simply run it on
ctulhu and get comparable results, and also more thorough data sets than
just snippets posted to the list?

There's also a bunch of reports for the 5 already completed runs
- dilip-300-logged-sync- dilip-300-unlogged-sync- pgbench-300-logged-sync-skip- pgbench-300-unlogged-sync-noskip-
pgbench-300-unlogged-sync-skip

The name identifies the workload type, scale and whether the tables are
wal-logged (for pgbench the "skip" means "-N" while "noskip" does
regular pgbench).

For example the "reports/wait-events-count-patches.txt" compares the
wait even stats with different patches applied (and master):


https://bitbucket.org/tvondra/hp05-results/src/506d0bee9e6557b015a31d72f6c3506e3f198c17/reports/wait-events-count-patches.txt?at=master&fileviewer=file-view-default

and average tps (from 3 runs, 5 minutes each):


https://bitbucket.org/tvondra/hp05-results/src/506d0bee9e6557b015a31d72f6c3506e3f198c17/reports/tps-avg-patches.txt?at=master&fileviewer=file-view-default

There are certainly interesting bits. For example while the "logged"
case is dominated y WALWriteLock for most client counts, for large
client counts that's no longer true.

Consider for example dilip-300-logged-sync results with 216 clients:
    wait_event      | master  | gran_lock | no_cont_lock |
group_upd--------------------+---------+-----------+--------------+-----------CLogControlLock    |  624566 |    474261
|      458599 |    225338WALWriteLock        |  431106 |    623142 |       619596 |    699224                    |
331542|    358220 |       371393 |    537076buffer_content      |  261308 |    134764 |       138664 |
102057ClientRead         |   59826 |    100883 |       103609 |    118379transactionid       |   26966 |     23155 |
   23815 |     31700ProcArrayLock       |    3967 |      3852 |         4070 |      4576wal_insert          |    3948 |
   10430 |         9513 |     12079clog                |    1710 |      4006 |         2443 |       925XidGenLock
  |    1689 |      3785 |         4229 |      3539tuple               |     965 |       617 |          655 |
840lock_manager       |     300 |       571 |          619 |       802WALBufMappingLock   |     168 |       140 |
  158 |       147SubtransControlLock |      60 |       115 |          124 |       105


Clearly, CLOG is an issue here, and it's (slightly) improved by all the
patches (group_update performing the best). And with 288 clients (which
is 2x the number of virtual cores in the machine, so not entirely crazy)
you get this:
    wait_event      | master  | gran_lock | no_cont_lock |
group_upd--------------------+---------+-----------+--------------+-----------CLogControlLock    |  901670 |    736822
|      728823 |    398111buffer_content      |  492637 |    318129 |       319251 |    270416WALWriteLock        |
414371|    593804 |       589809 |    656613                    |  380344 |    452936 |       470178 |
745790ClientRead         |   60261 |    111367 |       111391 |    126151transactionid       |   43627 |     34585 |
   35464 |     48679wal_insert          |    5423 |     29323 |        25898 |     30191ProcArrayLock       |    4379 |
    3918 |         4006 |      4582clog                |    2952 |      9135 |         5304 |      2514XidGenLock
  |    2182 |      9488 |         8894 |      8595tuple               |    2176 |      1288 |         1409 |
1821lock_manager       |     323 |       797 |          827 |      1006WALBufMappingLock   |     124 |       124 |
   146 |       206SubtransControlLock |      85 |       146 |          170 |       120


So even buffer_content gets ahead of the WALWriteLock. I wonder whether
this might be because of only having 128 buffers for clog pages, causing
contention on this system (surely, systems with 144 cores were not that
common when the 128 limit was introduced).

So the patch has positive impact even with WAL, as illustrated by tps
improvements (for large client counts):
 clients | master | gran_locking | no_content_lock |
group_update---------+--------+--------------+-----------------+--------------     36 |  39725 |        39627 |
 41203 |        39763      72 |  70533 |        65795 |           65602 |        66195     108 |  81664 |        87415
|          86896 |        87199     144 |  68950 |        98054 |           98266 |       102834     180 | 105741 |
 109827 |          109201 |       113911     216 |  62789 |        92193 |           90586 |        98995     252 |
94243|       102368 |          100663 |       107515     288 |  57895 |        83608 |           82556 |        91738


I find the tps fluctuation intriguing, and I'd like to see that fixed
before committing any of the patches.

For pgbench-300-logged-sync-skip (the other WAL-logging test already
completed), the CLOG contention is also reduced significantly, but the
tps did not improve this significantly.

For the the unlogged case (dilip-300-unlogged-sync), the results are
fairly similar - CLogControlLock and buffer_content dominating the wait
even profiles (WALWriteLock is missing, of course), and the average tps
fluctuates in almost exactly the same way.

Interestingly, no fluctuation for the pgbench tests. For example for
pgbench-300-unlogged-sync-ski (i.e. pgbench -N) the result is this:
 clients | master | gran_locking | no_content_lock |
group_update---------+--------+--------------+-----------------+--------------     36 | 147265 |       148663 |
148985 |       146559      72 | 162645 |       209070 |          207841 |       204588     108 | 135785 |       219982
|         218111 |       217588     144 | 113979 |       228683 |          228953 |       226934     180 |  96930 |
 230161 |          230316 |       227156     216 |  89068 |       224241 |          226524 |       225805     252 |
78203|       222507 |          225636 |       224810     288 |  63999 |       204524 |          225469 |       220098


That's a fairly significant improvement, and the behavior is very
smooth. Sadly, with WAL logging (pgbench-300-logged-sync-ski) the tps
drops back to master mostly thanks to WALWriteLock.

Another interesting aspect of the patches is impact on variability of
results - for example looking at dilip-300-unlogged-sync, the overall
average tps (for the three runs combined) and for each of the tree runs,
looks like this:
 clients | avg_tps |     tps_1 |     tps_2 |    tps_3---------+---------+-----------+-----------+-----------      36 |
117332|    115042 |    116125 |    120841      72 |   90917 |     72451 |    119915 |     80319     108 |   96070 |
106105|     73606 |    108580     144 |   81422 |     71094 |    102109 |     71063     180 |   88537 |     98871 |
67756|     99021     216 |   75962 |     65584 |     96365 |     66010     252 |   59941 |     57771 |     64756 |
57289    288 |   80851 |     93005 |     56454 |     93313


Notice the variability between the runs - the difference between min and
max is often more than 40%. Now compare it to results with the
"group-update" patch applied:
 clients | avg_tps |     tps_1 |     tps_2 |    tps_3---------+---------+-----------+-----------+-----------      36 |
116273|    117031 |    116005 |    115786      72 |  145273 |    147166 |    144839 |    143821     108 |   89892 |
89957|     89585 |     90133     144 |  130176 |    130310 |    130565 |    129655     180 |   81944 |     81927 |
81951|     81953     216 |  124415 |    124367 |    123228 |    125651     252 |   76723 |     76467 |     77266 |
76436    288 |  120072 |    121205 |    119731 |    119283


In this case there's pretty much no cross-run variability, the
differences are usually within 2%, so basically random noise. (There's
of course the variability depending on client count, but that was
already mentioned).


There's certainly much more interesting stuff in the results, but I
don't have time for more thorough analysis now - I only intended to do
some "quick benchmarking" on the patch, and I've already spent days on
this, and I have other things to do.

I'll take care of collecting data for the remaining cases on this
machine (and possibly running the same tests on the other one, if I
manage to get access to it again). But I'll leave further analysis of
the collected data up to the patch authors, or some volunteers.


regards

--
Tomas Vondra                  http://www.2ndQuadrant.com
PostgreSQL Development, 24x7 Support, Remote DBA, Training & Services
On Thu, Oct 13, 2016 at 7:53 AM, Tomas Vondra
<tomas.vondra@2ndquadrant.com> wrote:
> On 10/12/2016 08:55 PM, Robert Haas wrote:
>> On Wed, Oct 12, 2016 at 3:21 AM, Dilip Kumar <dilipbalaut@gmail.com> wrote:
>>> I think at higher client count from client count 96 onwards contention
>>> on CLogControlLock is clearly visible and which is completely solved
>>> with group lock patch.
>>>
>>> And at lower client count 32,64  contention on CLogControlLock is not
>>> significant hence we can not see any gain with group lock patch.
>>> (though we can see some contention on CLogControlLock is reduced at 64
>>> clients.)
>>
>> I agree with these conclusions.  I had a chance to talk with Andres
>> this morning at Postgres Vision and based on that conversation I'd
>> like to suggest a couple of additional tests:
>>
>> 1. Repeat this test on x86.  In particular, I think you should test on
>> the EnterpriseDB server cthulhu, which is an 8-socket x86 server.
>>
>> 2. Repeat this test with a mixed read-write workload, like -b
>> tpcb-like@1 -b select-only@9
>>
>
> FWIW, I'm already running similar benchmarks on an x86 machine with 72
> cores (144 with HT). It's "just" a 4-socket system, but the results I
> got so far seem quite interesting. The tooling and results (pushed
> incrementally) are available here:
>
>     https://bitbucket.org/tvondra/hp05-results/overview
>
> The tooling is completely automated, and it also collects various stats,
> like for example the wait event. So perhaps we could simply run it on
> ctulhu and get comparable results, and also more thorough data sets than
> just snippets posted to the list?
>
> There's also a bunch of reports for the 5 already completed runs
>
>  - dilip-300-logged-sync
>  - dilip-300-unlogged-sync
>  - pgbench-300-logged-sync-skip
>  - pgbench-300-unlogged-sync-noskip
>  - pgbench-300-unlogged-sync-skip
>
> The name identifies the workload type, scale and whether the tables are
> wal-logged (for pgbench the "skip" means "-N" while "noskip" does
> regular pgbench).
>
> For example the "reports/wait-events-count-patches.txt" compares the
> wait even stats with different patches applied (and master):
>
>
https://bitbucket.org/tvondra/hp05-results/src/506d0bee9e6557b015a31d72f6c3506e3f198c17/reports/wait-events-count-patches.txt?at=master&fileviewer=file-view-default
>
> and average tps (from 3 runs, 5 minutes each):
>
>
https://bitbucket.org/tvondra/hp05-results/src/506d0bee9e6557b015a31d72f6c3506e3f198c17/reports/tps-avg-patches.txt?at=master&fileviewer=file-view-default
>
> There are certainly interesting bits. For example while the "logged"
> case is dominated y WALWriteLock for most client counts, for large
> client counts that's no longer true.
>
> Consider for example dilip-300-logged-sync results with 216 clients:
>
>      wait_event      | master  | gran_lock | no_cont_lock | group_upd
>  --------------------+---------+-----------+--------------+-----------
>  CLogControlLock     |  624566 |    474261 |       458599 |    225338
>  WALWriteLock        |  431106 |    623142 |       619596 |    699224
>                      |  331542 |    358220 |       371393 |    537076
>  buffer_content      |  261308 |    134764 |       138664 |    102057
>  ClientRead          |   59826 |    100883 |       103609 |    118379
>  transactionid       |   26966 |     23155 |        23815 |     31700
>  ProcArrayLock       |    3967 |      3852 |         4070 |      4576
>  wal_insert          |    3948 |     10430 |         9513 |     12079
>  clog                |    1710 |      4006 |         2443 |       925
>  XidGenLock          |    1689 |      3785 |         4229 |      3539
>  tuple               |     965 |       617 |          655 |       840
>  lock_manager        |     300 |       571 |          619 |       802
>  WALBufMappingLock   |     168 |       140 |          158 |       147
>  SubtransControlLock |      60 |       115 |          124 |       105
>
> Clearly, CLOG is an issue here, and it's (slightly) improved by all the
> patches (group_update performing the best). And with 288 clients (which
> is 2x the number of virtual cores in the machine, so not entirely crazy)
> you get this:
>
>      wait_event      | master  | gran_lock | no_cont_lock | group_upd
>  --------------------+---------+-----------+--------------+-----------
>  CLogControlLock     |  901670 |    736822 |       728823 |    398111
>  buffer_content      |  492637 |    318129 |       319251 |    270416
>  WALWriteLock        |  414371 |    593804 |       589809 |    656613
>                      |  380344 |    452936 |       470178 |    745790
>  ClientRead          |   60261 |    111367 |       111391 |    126151
>  transactionid       |   43627 |     34585 |        35464 |     48679
>  wal_insert          |    5423 |     29323 |        25898 |     30191
>  ProcArrayLock       |    4379 |      3918 |         4006 |      4582
>  clog                |    2952 |      9135 |         5304 |      2514
>  XidGenLock          |    2182 |      9488 |         8894 |      8595
>  tuple               |    2176 |      1288 |         1409 |      1821
>  lock_manager        |     323 |       797 |          827 |      1006
>  WALBufMappingLock   |     124 |       124 |          146 |       206
>  SubtransControlLock |      85 |       146 |          170 |       120
>
> So even buffer_content gets ahead of the WALWriteLock. I wonder whether
> this might be because of only having 128 buffers for clog pages, causing
> contention on this system (surely, systems with 144 cores were not that
> common when the 128 limit was introduced).
>

Not sure, but I have checked if we increase clog buffers greater than
128, then it causes dip in performance on read-write workload in some
cases. Apart from that from above results, it is quite clear that
patches help in significantly reducing the CLOGControlLock contention
with group-update patch consistently better, probably because with
this workload is more contended on writing the transaction status.

> So the patch has positive impact even with WAL, as illustrated by tps
> improvements (for large client counts):
>
>   clients | master | gran_locking | no_content_lock | group_update
>  ---------+--------+--------------+-----------------+--------------
>        36 |  39725 |        39627 |           41203 |        39763
>        72 |  70533 |        65795 |           65602 |        66195
>       108 |  81664 |        87415 |           86896 |        87199
>       144 |  68950 |        98054 |           98266 |       102834
>       180 | 105741 |       109827 |          109201 |       113911
>       216 |  62789 |        92193 |           90586 |        98995
>       252 |  94243 |       102368 |          100663 |       107515
>       288 |  57895 |        83608 |           82556 |        91738
>
> I find the tps fluctuation intriguing, and I'd like to see that fixed
> before committing any of the patches.
>

I have checked the wait event results where there is more fluctuation:

test               | clients | wait_event_type |     wait_event      |
master  | granular_locking | no_content_lock | group_update

----------------------------------+---------+-----------------+---------------------+---------+------------------+-----------------+--------------
dilip-300-unlogged-sync          |     108 | LWLockNamed     |
CLogControlLock     |  343526 |           502127 |          479937 |   301381
dilip-300-unlogged-sync          |     180 | LWLockNamed     |
CLogControlLock     |  557639 |           835567 |          795403 |   512707


So, if I read above results correctly, then it shows that group-update
has helped slightly to reduce the contention and one probable reason
could be that we need to update clog status on different clog pages
more frequently on such a workload and may be need to perform disk
page reads for clog pages as well, so the benefit of grouping will
certainly be less.  This is because page read requests will get
serialized and only leader backend needs to perform all such requests.
Robert has pointed about somewhat similar case upthread [1] and I have
modified the patch as well to use multiple slots (groups) for group
transaction status update [2], but we didn't pursued, because on
pgbench workload, it didn't showed any benefit. However, may be here
it can show some benefit, if we could make above results reproducible
and you guys think that above theory sounds reasonable, then I can
again modify the patch based on that idea.

Now, the story with granular_locking and no_content_lock patches seems
to be worse, because they seem to be increasing the contention on
CLOGControlLock rather than reducing it.  I think one of the probable
reasons that could happen for both the approaches is that it
frequently needs to release the CLogControlLock acquired in Shared
mode and reacquire it in Exclusive mode as the clog page to modify is
not in buffer (different clog page update then the currently in
buffer) and then once again it needs to release the CLogControlLock
lock to read the clog page from disk and acquire it again in Exclusive
mode.  This frequent release-acquire of CLOGControlLock in different
modes could lead to significant increase in contention.  It is
slightly more for granular_locking patch as it needs one additional
lock (buffer_content_lock) in Exclusive mode after acquiring
CLogControlLock. Offhand, I could not see a way to reduce the
contention with granular_locking and no_content_lock patches.

So, the crux is that we are seeing more variability in some of the
results because of frequent different clog page accesses which is not
so easy to predict, but I think it is possible with ~100,000 tps.

>
> There's certainly much more interesting stuff in the results, but I
> don't have time for more thorough analysis now - I only intended to do
> some "quick benchmarking" on the patch, and I've already spent days on
> this, and I have other things to do.
>

Thanks a ton for doing such a detailed testing.


[1] -
https://www.postgresql.org/message-id/CA%2BTgmoahCx6XgprR%3Dp5%3D%3DcF0g9uhSHsJxVdWdUEHN9H2Mv0gkw%40mail.gmail.com
[2] - https://www.postgresql.org/message-id/CAA4eK1%2BSoW3FBrdZV%2B3m34uCByK3DMPy_9QQs34yvN8spByzyA%40mail.gmail.com

--
With Regards,
Amit Kapila.
EnterpriseDB: http://www.enterprisedb.com
On Thu, Oct 13, 2016 at 12:25 AM, Robert Haas <robertmhaas@gmail.com> wrote:
> I agree with these conclusions.  I had a chance to talk with Andres
> this morning at Postgres Vision and based on that conversation I'd
> like to suggest a couple of additional tests:
>
> 1. Repeat this test on x86.  In particular, I think you should test on
> the EnterpriseDB server cthulhu, which is an 8-socket x86 server.

I have done my test on cthulhu, basic difference is that In POWER we
saw ClogControlLock on top at 96 and more client with 300 scale
factor. But, on cthulhu at 300 scale factor transactionid lock is
always on top. So I repeated my test with 1000 scale factor as well on
cthulhu.

All configuration is same as my last test.

Test with 1000 scale factor
-------------------------------------

Test1: number of clients: 192

Head:
tps = 21206.108856 (including connections establishing)
tps = 21206.245441 (excluding connections establishing)
[dilip.kumar@cthulhu bin]$ cat 1000_192_ul.txt310489  LWLockNamed     | CLogControlLock296152                  | 35537
Lock           | transactionid 15821  LWLockTranche   | buffer_mapping 10342  LWLockTranche   | buffer_content  8427
LWLockTranche  | clog  3961  3165  Lock            | extend  2861  Lock            | tuple  2781  LWLockNamed     |
ProcArrayLock 1104  LWLockNamed     | XidGenLock   745  LWLockTranche   | lock_manager   371  LWLockNamed     |
CheckpointerCommLock   70  LWLockTranche   | wal_insert     5  BufferPin       | BufferPin     3  LWLockTranche   |
proc

Patch:
tps = 28725.038933 (including connections establishing)
tps = 28725.367102 (excluding connections establishing)
[dilip.kumar@cthulhu bin]$ cat 1000_192_ul.txt540061                  | 57810  LWLockNamed     | CLogControlLock 36264
LWLockTranche  | buffer_mapping 29976  Lock            | transactionid  4770  Lock            | extend  4735
LWLockTranche  | clog  4479  LWLockNamed     | ProcArrayLock  4006  3955  LWLockTranche   | buffer_content  2505
LWLockTranche  | lock_manager  2179  Lock            | tuple  1977  LWLockNamed     | XidGenLock   905  LWLockNamed
|CheckpointerCommLock   222  LWLockTranche   | wal_insert     8  LWLockTranche   | proc


Test2: number of clients: 96

Head:
tps = 25447.861572 (including connections establishing)
tps = 25448.012739 (excluding connections establishing)261611                  | 69604  LWLockNamed     |
CLogControlLock 6119  Lock            | transactionid  4008  2874  LWLockTranche   | buffer_mapping  2578
LWLockTranche  | buffer_content  2355  LWLockNamed     | ProcArrayLock  1245  Lock            | extend  1168
LWLockTranche  | clog   232  Lock            | tuple   217  LWLockNamed     | CheckpointerCommLock   160  LWLockNamed
 | XidGenLock   158  LWLockTranche   | lock_manager    78  LWLockTranche   | wal_insert     5  BufferPin       |
BufferPin

Patch:
tps = 32708.368938 (including connections establishing)
tps = 32708.765989 (excluding connections establishing)
[dilip.kumar@cthulhu bin]$ cat 1000_96_ul.txt326601                  |  7471  LWLockNamed     | CLogControlLock  5387
Lock           | transactionid  4018  3331  LWLockTranche   | buffer_mapping  3144  LWLockNamed     | ProcArrayLock
1372 Lock            | extend   722  LWLockTranche   | buffer_content   393  LWLockNamed     | XidGenLock   237
LWLockTranche  | lock_manager   234  Lock            | tuple   194  LWLockTranche   | clog    96  Lock            |
relation   88  LWLockTranche   | wal_insert    34  LWLockNamed     | CheckpointerCommLock


Test3: number of clients: 64

Head:

tps = 28264.194438 (including connections establishing)
tps = 28264.336270 (excluding connections establishing)
218264                  | 10314  LWLockNamed     | CLogControlLock  4019  2067  Lock            | transactionid  1950
LWLockTranche  | buffer_mapping  1879  LWLockNamed     | ProcArrayLock   592  Lock            | extend   565
LWLockTranche  | buffer_content   222  LWLockNamed     | XidGenLock   143  LWLockTranche   | clog   131  LWLockNamed
| CheckpointerCommLock    63  LWLockTranche   | lock_manager    52  Lock            | tuple    35  LWLockTranche   |
wal_insert

Patch:
tps = 27906.376194 (including connections establishing)
tps = 27906.531392 (excluding connections establishing)
[dilip.kumar@cthulhu bin]$ cat 1000_64_ul.txt228108                  |  4039  2294  Lock            | transactionid
2116 LWLockTranche   | buffer_mapping  1757  LWLockNamed     | ProcArrayLock  1553  LWLockNamed     | CLogControlLock
800 Lock            | extend   403  LWLockTranche   | buffer_content    92  LWLockNamed     | XidGenLock    74
LWLockTranche  | lock_manager    42  Lock            | tuple    35  LWLockTranche   | wal_insert    34  LWLockTranche
|clog    14  LWLockNamed     | CheckpointerCommLock


Test4: number of clients: 32

Head:
tps = 27587.999912 (including connections establishing)
tps = 27588.119611 (excluding connections establishing)
[dilip.kumar@cthulhu bin]$ cat 1000_32_ul.txt117762                  |  4031   614  LWLockNamed     | ProcArrayLock
379 LWLockNamed     | CLogControlLock   344  Lock            | transactionid   183  Lock            | extend   102
LWLockTranche  | buffer_mapping    71  LWLockTranche   | buffer_content    39  LWLockNamed     | XidGenLock    25
LWLockTranche  | lock_manager     3  LWLockTranche   | wal_insert     3  LWLockTranche   | clog     2  LWLockNamed
|CheckpointerCommLock     2  Lock            | tuple


Patch:
tps = 28291.428848 (including connections establishing)
tps = 28291.586435 (excluding connections establishing)
[dilip.kumar@cthulhu bin]$ cat 1000_32_ul.txt116596                  |  4041   757  LWLockNamed     | ProcArrayLock
407 LWLockNamed     | CLogControlLock   358  Lock            | transactionid   183  Lock            | extend   142
LWLockTranche  | buffer_mapping    77  LWLockTranche   | buffer_content    68  LWLockNamed     | XidGenLock    35
LWLockTranche  | lock_manager    15  LWLockTranche   | wal_insert     7  LWLockTranche   | clog     7  Lock
|tuple     4  LWLockNamed     | CheckpointerCommLock     1 Tuples only is on.


Summary:
- At 96 and more clients count we can see ClogControlLock at the top.
- With patch contention on ClogControlLock is reduced significantly.
I think these behaviours are same as we saw on power.

With 300 scale factor:
- Contention on ClogControlLock is significant only at 192 client
(still transaction id lock is on top), Which is completely removed
with group lock patch.

For 300 scale factor, I am posting data only at 192 client count (If
anyone interested in other data I can post).

Head:
scaling factor: 300
query mode: prepared
number of clients: 192
number of threads: 192
duration: 1800 s
number of transactions actually processed: 65930726
latency average: 5.242 ms
tps = 36621.827041 (including connections establishing)
tps = 36622.064081 (excluding connections establishing)
[dilip.kumar@cthulhu bin]$ cat 300_192_ul.txt437848                  |118966  Lock            | transactionid 88869
LWLockNamed    | CLogControlLock 18558  Lock            | tuple  6183  LWLockTranche   | buffer_content  5664
LWLockTranche  | lock_manager  3995  LWLockNamed     | ProcArrayLock  3646  1748  Lock            | extend  1635
LWLockNamed    | XidGenLock   401  LWLockTranche   | wal_insert    33  BufferPin       | BufferPin     5  LWLockTranche
 | proc     3  LWLockTranche   | buffer_mapping


Patch:
scaling factor: 300
query mode: prepared
number of clients: 192
number of threads: 192
duration: 1800 s
number of transactions actually processed: 82616270
latency average: 4.183 ms
tps = 45894.737813 (including connections establishing)
tps = 45894.995634 (excluding connections establishing)
120372  Lock            | transactionid 16346  Lock            | tuple  7489  LWLockTranche   | lock_manager  4514
LWLockNamed    | ProcArrayLock  3632  3310  LWLockNamed     | CLogControlLock  2287  LWLockNamed     | XidGenLock  2271
Lock            | extend   709  LWLockTranche   | buffer_content   490  LWLockTranche   | wal_insert    30  BufferPin
   | BufferPin    10  LWLockTranche   | proc     6  LWLockTranche   | buffer_mapping


--
Regards,
Dilip Kumar
EnterpriseDB: http://www.enterprisedb.com
On 10/20/2016 09:36 AM, Dilip Kumar wrote:
> On Thu, Oct 13, 2016 at 12:25 AM, Robert Haas <robertmhaas@gmail.com> wrote:
>> I agree with these conclusions.  I had a chance to talk with Andres
>> this morning at Postgres Vision and based on that conversation I'd
>> like to suggest a couple of additional tests:
>>
>> 1. Repeat this test on x86.  In particular, I think you should test on
>> the EnterpriseDB server cthulhu, which is an 8-socket x86 server.
>
> I have done my test on cthulhu, basic difference is that In POWER we
> saw ClogControlLock on top at 96 and more client with 300 scale
> factor. But, on cthulhu at 300 scale factor transactionid lock is
> always on top. So I repeated my test with 1000 scale factor as well on
> cthulhu.
>
> All configuration is same as my last test.
>
> Test with 1000 scale factor
> -------------------------------------
>
> Test1: number of clients: 192
>
> Head:
> tps = 21206.108856 (including connections establishing)
> tps = 21206.245441 (excluding connections establishing)
> [dilip.kumar@cthulhu bin]$ cat 1000_192_ul.txt
>  310489  LWLockNamed     | CLogControlLock
>  296152                  |
>   35537  Lock            | transactionid
>   15821  LWLockTranche   | buffer_mapping
>   10342  LWLockTranche   | buffer_content
>    8427  LWLockTranche   | clog
>    3961
>    3165  Lock            | extend
>    2861  Lock            | tuple
>    2781  LWLockNamed     | ProcArrayLock
>    1104  LWLockNamed     | XidGenLock
>     745  LWLockTranche   | lock_manager
>     371  LWLockNamed     | CheckpointerCommLock
>      70  LWLockTranche   | wal_insert
>       5  BufferPin       | BufferPin
>       3  LWLockTranche   | proc
>
> Patch:
> tps = 28725.038933 (including connections establishing)
> tps = 28725.367102 (excluding connections establishing)
> [dilip.kumar@cthulhu bin]$ cat 1000_192_ul.txt
>  540061                  |
>   57810  LWLockNamed     | CLogControlLock
>   36264  LWLockTranche   | buffer_mapping
>   29976  Lock            | transactionid
>    4770  Lock            | extend
>    4735  LWLockTranche   | clog
>    4479  LWLockNamed     | ProcArrayLock
>    4006
>    3955  LWLockTranche   | buffer_content
>    2505  LWLockTranche   | lock_manager
>    2179  Lock            | tuple
>    1977  LWLockNamed     | XidGenLock
>     905  LWLockNamed     | CheckpointerCommLock
>     222  LWLockTranche   | wal_insert
>       8  LWLockTranche   | proc
>
> Test2: number of clients: 96
>
> Head:
> tps = 25447.861572 (including connections establishing)
> tps = 25448.012739 (excluding connections establishing)
>  261611                  |
>   69604  LWLockNamed     | CLogControlLock
>    6119  Lock            | transactionid
>    4008
>    2874  LWLockTranche   | buffer_mapping
>    2578  LWLockTranche   | buffer_content
>    2355  LWLockNamed     | ProcArrayLock
>    1245  Lock            | extend
>    1168  LWLockTranche   | clog
>     232  Lock            | tuple
>     217  LWLockNamed     | CheckpointerCommLock
>     160  LWLockNamed     | XidGenLock
>     158  LWLockTranche   | lock_manager
>      78  LWLockTranche   | wal_insert
>       5  BufferPin       | BufferPin
>
> Patch:
> tps = 32708.368938 (including connections establishing)
> tps = 32708.765989 (excluding connections establishing)
> [dilip.kumar@cthulhu bin]$ cat 1000_96_ul.txt
>  326601                  |
>    7471  LWLockNamed     | CLogControlLock
>    5387  Lock            | transactionid
>    4018
>    3331  LWLockTranche   | buffer_mapping
>    3144  LWLockNamed     | ProcArrayLock
>    1372  Lock            | extend
>     722  LWLockTranche   | buffer_content
>     393  LWLockNamed     | XidGenLock
>     237  LWLockTranche   | lock_manager
>     234  Lock            | tuple
>     194  LWLockTranche   | clog
>      96  Lock            | relation
>      88  LWLockTranche   | wal_insert
>      34  LWLockNamed     | CheckpointerCommLock
>
> Test3: number of clients: 64
>
> Head:
>
> tps = 28264.194438 (including connections establishing)
> tps = 28264.336270 (excluding connections establishing)
>
>  218264                  |
>   10314  LWLockNamed     | CLogControlLock
>    4019
>    2067  Lock            | transactionid
>    1950  LWLockTranche   | buffer_mapping
>    1879  LWLockNamed     | ProcArrayLock
>     592  Lock            | extend
>     565  LWLockTranche   | buffer_content
>     222  LWLockNamed     | XidGenLock
>     143  LWLockTranche   | clog
>     131  LWLockNamed     | CheckpointerCommLock
>      63  LWLockTranche   | lock_manager
>      52  Lock            | tuple
>      35  LWLockTranche   | wal_insert
>
> Patch:
> tps = 27906.376194 (including connections establishing)
> tps = 27906.531392 (excluding connections establishing)
> [dilip.kumar@cthulhu bin]$ cat 1000_64_ul.txt
>  228108                  |
>    4039
>    2294  Lock            | transactionid
>    2116  LWLockTranche   | buffer_mapping
>    1757  LWLockNamed     | ProcArrayLock
>    1553  LWLockNamed     | CLogControlLock
>     800  Lock            | extend
>     403  LWLockTranche   | buffer_content
>      92  LWLockNamed     | XidGenLock
>      74  LWLockTranche   | lock_manager
>      42  Lock            | tuple
>      35  LWLockTranche   | wal_insert
>      34  LWLockTranche   | clog
>      14  LWLockNamed     | CheckpointerCommLock
>
> Test4: number of clients: 32
>
> Head:
> tps = 27587.999912 (including connections establishing)
> tps = 27588.119611 (excluding connections establishing)
> [dilip.kumar@cthulhu bin]$ cat 1000_32_ul.txt
>  117762                  |
>    4031
>     614  LWLockNamed     | ProcArrayLock
>     379  LWLockNamed     | CLogControlLock
>     344  Lock            | transactionid
>     183  Lock            | extend
>     102  LWLockTranche   | buffer_mapping
>      71  LWLockTranche   | buffer_content
>      39  LWLockNamed     | XidGenLock
>      25  LWLockTranche   | lock_manager
>       3  LWLockTranche   | wal_insert
>       3  LWLockTranche   | clog
>       2  LWLockNamed     | CheckpointerCommLock
>       2  Lock            | tuple
>
> Patch:
> tps = 28291.428848 (including connections establishing)
> tps = 28291.586435 (excluding connections establishing)
> [dilip.kumar@cthulhu bin]$ cat 1000_32_ul.txt
>  116596                  |
>    4041
>     757  LWLockNamed     | ProcArrayLock
>     407  LWLockNamed     | CLogControlLock
>     358  Lock            | transactionid
>     183  Lock            | extend
>     142  LWLockTranche   | buffer_mapping
>      77  LWLockTranche   | buffer_content
>      68  LWLockNamed     | XidGenLock
>      35  LWLockTranche   | lock_manager
>      15  LWLockTranche   | wal_insert
>       7  LWLockTranche   | clog
>       7  Lock            | tuple
>       4  LWLockNamed     | CheckpointerCommLock
>       1 Tuples only is on.
>
> Summary:
> - At 96 and more clients count we can see ClogControlLock at the top.
> - With patch contention on ClogControlLock is reduced significantly.
> I think these behaviours are same as we saw on power.
>
> With 300 scale factor:
> - Contention on ClogControlLock is significant only at 192 client
> (still transaction id lock is on top), Which is completely removed
> with group lock patch.
>
> For 300 scale factor, I am posting data only at 192 client count (If
> anyone interested in other data I can post).
>

In the results you've posted on 10/12, you've mentioned a regression
with 32 clients, where you got 52k tps on master but only 48k tps with
the patch (so ~10% difference). I have no idea what scale was used for
those tests, and I see no such regression in the current results (but
you only report results for some of the client counts).

Also, which of the proposed patches have you been testing?

Can you collect and share a more complete set of data, perhaps based on
the scripts I use to do tests on the large machine with 36/72 cores,
available at https://bitbucket.org/tvondra/hp05-results ?

I've taken some time to build a simple web-based reports from the
results collected so far (also included in the git repository), and
pushed them here:
    http://tvondra.bitbucket.org

For each of the completed runs, there's a report comparing tps for
different client counts with master and the three patches (average tps,
median and stddev), and it's possible to download a more thorough text
report with wait event stats, comparison of individual runs etc.

If you want to cooperate on this, I'm available - i.e. I can help you
get the tooling running, customize it etc.


Regarding the results collected on the "big machine" so far, I do have a
few observations:

pgbench / scale 300 (fits into 16GB shared buffers)
---------------------------------------------------
* in general, those results seem fine

* the results generally fall into 3 categories (I'll show results for
"pgbench -N" but regular pgbench behaves similarly):

(a) logged, sync_commit=on - no impact    http://tvondra.bitbucket.org/#pgbench-300-logged-sync-skip

(b) logged, sync_commit=off - improvement    http://tvondra.bitbucket.org/#pgbench-300-logged-async-skip
    The thoughput gets improved by ~20% with 72 clients, and then it    levels-off (but does not drop unlike on
master).With high client    counts the difference is up to 300%, but people who care about    throughput won't run with
suchclient counts anyway.

    And not only this improves throughput, it also significantly    reduces variability of the performance (i.e.
measurethroughput    each second and compute STDDEV of that). You can imagine this    as a much "smoother" chart of tps
overtime.


(c) unlogged, sync_commit=* - improvement    http://tvondra.bitbucket.org/#pgbench-300-unlogged-sync-skip
    This is actually quite similar to (b).


dilip / scale 300 (fits into 16GB shared buffers)
-------------------------------------------------

* those results seem less OK

* I haven't found any significant regressions (in the sense of
significant performance drop compared to master), but the behavior in
some cases seem fairly strange (and it's repeatable)

* consider for example these results:
  http://tvondra.bitbucket.org/#dilip-300-unlogged-async  http://tvondra.bitbucket.org/#dilip-300-logged-async

* the saw-like pattern is rather suspicious, and I don't think I've seen
anything like that before - I guess there's some feedback loop and we
better find it before committing any of the patches, because this is
something I don't want to see on any production machine (and I bet
neither do you)

* After looking into wait even details in the full text report at
  http://tvondra.bitbucket.org/by-test/dilip-300-unlogged-async.txt
  (section "wait events for dilip-300-unlogged-async (runs combined)")
  I see that for pg-9.6-group-update, the statistics for 72, 108 and  144 clients (low - high - low), the summary looks
likethis

   clients | wait_event_type |     wait_event  | wait_count | wait_pct
---------+-----------------+-----------------+------------+----------       72 |                 |                 |
374845 |    62.87        72 | Client          | ClientRead      |     136320 |    22.86        72 | LWLockNamed     |
CLogControlLock|      52804 |     8.86        72 | LWLockTranche   | buffer_content  |      15337 |     2.57        72
|LWLockNamed     | XidGenLock      |       7352 |     1.23        72 | LWLockNamed     | ProcArrayLock   |       6630 |
   1.11

       108 |                 |                 |     407179 |    46.01       108 | LWLockNamed     | CLogControlLock |
  300452 |    33.95       108 | LWLockTranche   | buffer_content  |      87597 |     9.90       108 | Client          |
ClientRead     |      80901 |     9.14       108 | LWLockNamed     | ProcArrayLock   |       3290 |     0.37

       144 |                 |                 |     623057 |    53.44       144 | LWLockNamed     | CLogControlLock |
  175072 |    15.02       144 | Client          | ClientRead      |     163451 |    14.02       144 | LWLockTranche   |
buffer_content |     147963 |    12.69       144 | LWLockNamed     | XidGenLock      |      38361 |     3.29       144
|Lock            | transactionid   |       8821 |     0.76

  That is, there's sudden jump on CLogControlLock from 22% to 33% and  then back to 15% (and for 180 clients it jumps
backto ~35%). That's  pretty strange, and all the patches behave exactly the same.


scale 3000 (45GB), shared_buffers=16GB
---------------------------------------

For the small scale, the whole data set fits into 16GB shared buffers,
so there were pretty much no writes except for WAL and CLOG. For scale
3000 that's no longer true - the backends will compete for buffers and
will constantly write dirty buffers to page cache.

I haven't realized this initially and the kernel was using the default
vm.dirty_* limits, i.e. 10% and 20%. As the machine has 3TB of RAM, this
resulted in rather excessive threshold (or "insane" if you want), so the
kernel regularly accumulated up to ~15GB of dirty data and then wrote it
out in very short period of time. Even though the machine has fairly
powerful storage (4GB write cache on controller, 10 x 12Gbps SAS SSDs),
this lead to pretty bad latency spikes / drops in throughput.

I've only done two runs with this configuration before realizing what's
happening, the results are illustrated here"

* http://tvondra.bitbucket.org/#dilip-3000-unlogged-sync-high-dirty-bytes
*
http://tvondra.bitbucket.org/#pgbench-3000-unlogged-sync-skip-high-dirty-bytes

I'm not sure how important those results are (if throughput and smooth
behavior matters, tuning the kernel thresholds is a must), but what I
find interesting is that while the patches manage to improve throughput
by 10-20%, they also (quite significantly) increase variability of the
results (jitter in the tps over time). It's particularly visible on the
pgbench results. I'm not sure that's a good tradeoff.

After fixing the kernel page cache thresholds (by setting
background_bytes to 256MB to perform smooth write-out), the effect
differs depending on the workload:

(a) dilip    http://tvondra.bitbucket.org/#dilip-3000-unlogged-sync
    - eliminates any impact of all the patches

(b) pgbench (-N)    http://tvondra.bitbucket.org/#pgbench-3000-unlogged-sync-skip
    - By far the most severe regression observed during the testing.    With 36 clients the throughput drops by ~40%,
whichI think is    pretty bad. Also the results are much more variable with the    patches (compared to master).


scale 3000 (45GB), shared_buffers=64GB
---------------------------------------

I've also done some tests with increased shared buffers, so that even
the large data set fits into them. Again, the results slightly depend on
the workload:

(a) dilip
  * http://tvondra.bitbucket.org/#dilip-3000-unlogged-sync-64  *
http://tvondra.bitbucket.org/#dilip-3000-unlogged-async-64
  Pretty much no impact on throughput or variability. Unlike on the  small data set, it the patches don't even
eliminatethe performance  drop above 72 clients - the performance closely matches master.


(b) pgbench
  * http://tvondra.bitbucket.org/#pgbench-3000-unlogged-sync-skip-64  *
http://tvondra.bitbucket.org/#pgbench-3000-unlogged-sync-noskip-64
  There's a small benefit (~20% on the same client count), and the  performance drop only happens after 72 clients. The
patchesalso  significantly increase variability of the results, particularly for  large client counts.


regards

--
Tomas Vondra                  http://www.2ndQuadrant.com
PostgreSQL Development, 24x7 Support, Remote DBA, Training & Services
On Thu, Oct 20, 2016 at 3:36 AM, Dilip Kumar <dilipbalaut@gmail.com> wrote:
> On Thu, Oct 13, 2016 at 12:25 AM, Robert Haas <robertmhaas@gmail.com> wrote:
>> I agree with these conclusions.  I had a chance to talk with Andres
>> this morning at Postgres Vision and based on that conversation I'd
>> like to suggest a couple of additional tests:
>>
>> 1. Repeat this test on x86.  In particular, I think you should test on
>> the EnterpriseDB server cthulhu, which is an 8-socket x86 server.
>
> I have done my test on cthulhu, basic difference is that In POWER we
> saw ClogControlLock on top at 96 and more client with 300 scale
> factor. But, on cthulhu at 300 scale factor transactionid lock is
> always on top. So I repeated my test with 1000 scale factor as well on
> cthulhu.

So the upshot appears to be that this problem is a lot worse on power2
than cthulhu, which suggests that this is architecture-dependent.  I
guess it could also be kernel-dependent, but it doesn't seem likely,
because:

power2: Red Hat Enterprise Linux Server release 7.1 (Maipo),
3.10.0-229.14.1.ael7b.ppc64le
cthulhu: CentOS Linux release 7.2.1511 (Core), 3.10.0-229.7.2.el7.x86_64

So here's my theory.  The whole reason why Tomas is having difficulty
seeing any big effect from these patches is because he's testing on
x86.  When Dilip tests on x86, he doesn't see a big effect either,
regardless of workload.  But when Dilip tests on POWER, which I think
is where he's mostly been testing, he sees a huge effect, because for
some reason POWER has major problems with this lock that don't exist
on x86.

If that's so, then we ought to be able to reproduce the big gains on
hydra, a community POWER server.  In fact, I think I'll go run a quick
test over there right now...

--
Robert Haas
EnterpriseDB: http://www.enterprisedb.com
The Enterprise PostgreSQL Company
On Thu, Oct 20, 2016 at 11:45 AM, Robert Haas <robertmhaas@gmail.com> wrote:
> On Thu, Oct 20, 2016 at 3:36 AM, Dilip Kumar <dilipbalaut@gmail.com> wrote:
>> On Thu, Oct 13, 2016 at 12:25 AM, Robert Haas <robertmhaas@gmail.com> wrote:
>>> I agree with these conclusions.  I had a chance to talk with Andres
>>> this morning at Postgres Vision and based on that conversation I'd
>>> like to suggest a couple of additional tests:
>>>
>>> 1. Repeat this test on x86.  In particular, I think you should test on
>>> the EnterpriseDB server cthulhu, which is an 8-socket x86 server.
>>
>> I have done my test on cthulhu, basic difference is that In POWER we
>> saw ClogControlLock on top at 96 and more client with 300 scale
>> factor. But, on cthulhu at 300 scale factor transactionid lock is
>> always on top. So I repeated my test with 1000 scale factor as well on
>> cthulhu.
>
> So the upshot appears to be that this problem is a lot worse on power2
> than cthulhu, which suggests that this is architecture-dependent.  I
> guess it could also be kernel-dependent, but it doesn't seem likely,
> because:
>
> power2: Red Hat Enterprise Linux Server release 7.1 (Maipo),
> 3.10.0-229.14.1.ael7b.ppc64le
> cthulhu: CentOS Linux release 7.2.1511 (Core), 3.10.0-229.7.2.el7.x86_64
>
> So here's my theory.  The whole reason why Tomas is having difficulty
> seeing any big effect from these patches is because he's testing on
> x86.  When Dilip tests on x86, he doesn't see a big effect either,
> regardless of workload.  But when Dilip tests on POWER, which I think
> is where he's mostly been testing, he sees a huge effect, because for
> some reason POWER has major problems with this lock that don't exist
> on x86.
>
> If that's so, then we ought to be able to reproduce the big gains on
> hydra, a community POWER server.  In fact, I think I'll go run a quick
> test over there right now...

And ... nope.  I ran a 30-minute pgbench test on unpatched master
using unlogged tables at scale factor 300 with 64 clients and got
these results:
    14  LWLockTranche   | wal_insert    36  LWLockTranche   | lock_manager    45  LWLockTranche   | buffer_content
223 Lock            | tuple   527  LWLockNamed     | CLogControlLock   921  Lock            | extend  1195  LWLockNamed
   | XidGenLock  1248  LWLockNamed     | ProcArrayLock  3349  Lock            | transactionid 85957  Client          |
ClientRead135935                 |


I then started a run at 96 clients which I accidentally killed shortly
before it was scheduled to finish, but the results are not much
different; there is no hint of the runaway CLogControlLock contention
that Dilip sees on power2.

--
Robert Haas
EnterpriseDB: http://www.enterprisedb.com
The Enterprise PostgreSQL Company
On 10/20/2016 07:59 PM, Robert Haas wrote:
> On Thu, Oct 20, 2016 at 11:45 AM, Robert Haas <robertmhaas@gmail.com> wrote:
>> On Thu, Oct 20, 2016 at 3:36 AM, Dilip Kumar <dilipbalaut@gmail.com> wrote:
>>> On Thu, Oct 13, 2016 at 12:25 AM, Robert Haas <robertmhaas@gmail.com> wrote:>>
>> ...
>>
>> So here's my theory.  The whole reason why Tomas is having difficulty
>> seeing any big effect from these patches is because he's testing on
>> x86.  When Dilip tests on x86, he doesn't see a big effect either,
>> regardless of workload.  But when Dilip tests on POWER, which I think
>> is where he's mostly been testing, he sees a huge effect, because for
>> some reason POWER has major problems with this lock that don't exist
>> on x86.
>>
>> If that's so, then we ought to be able to reproduce the big gains on
>> hydra, a community POWER server.  In fact, I think I'll go run a quick
>> test over there right now...
>
> And ... nope.  I ran a 30-minute pgbench test on unpatched master
> using unlogged tables at scale factor 300 with 64 clients and got
> these results:
>
>      14  LWLockTranche   | wal_insert
>      36  LWLockTranche   | lock_manager
>      45  LWLockTranche   | buffer_content
>     223  Lock            | tuple
>     527  LWLockNamed     | CLogControlLock
>     921  Lock            | extend
>    1195  LWLockNamed     | XidGenLock
>    1248  LWLockNamed     | ProcArrayLock
>    3349  Lock            | transactionid
>   85957  Client          | ClientRead
>  135935                  |
>
> I then started a run at 96 clients which I accidentally killed shortly
> before it was scheduled to finish, but the results are not much
> different; there is no hint of the runaway CLogControlLock contention
> that Dilip sees on power2.
>

What shared_buffer size were you using? I assume the data set fit into
shared buffers, right?

FWIW as I explained in the lengthy post earlier today, I can actually
reproduce the significant CLogControlLock contention (and the patches do
reduce it), even on x86_64.

For example consider these two tests:

* http://tvondra.bitbucket.org/#dilip-300-unlogged-sync
* http://tvondra.bitbucket.org/#pgbench-300-unlogged-sync-skip

However, it seems I can also reproduce fairly bad regressions, like for
example this case with data set exceeding shared_buffers:

* http://tvondra.bitbucket.org/#pgbench-3000-unlogged-sync-skip

regards

--
Tomas Vondra                  http://www.2ndQuadrant.com
PostgreSQL Development, 24x7 Support, Remote DBA, Training & Services
On Thu, Oct 20, 2016 at 4:04 PM, Tomas Vondra
<tomas.vondra@2ndquadrant.com> wrote:
>> I then started a run at 96 clients which I accidentally killed shortly
>> before it was scheduled to finish, but the results are not much
>> different; there is no hint of the runaway CLogControlLock contention
>> that Dilip sees on power2.
>>
> What shared_buffer size were you using? I assume the data set fit into
> shared buffers, right?

8GB.

> FWIW as I explained in the lengthy post earlier today, I can actually
> reproduce the significant CLogControlLock contention (and the patches do
> reduce it), even on x86_64.

/me goes back, rereads post.  Sorry, I didn't look at this carefully
the first time.

> For example consider these two tests:
>
> * http://tvondra.bitbucket.org/#dilip-300-unlogged-sync
> * http://tvondra.bitbucket.org/#pgbench-300-unlogged-sync-skip
>
> However, it seems I can also reproduce fairly bad regressions, like for
> example this case with data set exceeding shared_buffers:
>
> * http://tvondra.bitbucket.org/#pgbench-3000-unlogged-sync-skip

I'm not sure how seriously we should take the regressions.  I mean,
what I see there is that CLogControlLock contention goes down by about
50% -- which is the point of the patch -- and WALWriteLock contention
goes up dramatically -- which sucks, but can't really be blamed on the
patch except in the indirect sense that a backend can't spend much
time waiting for A if it's already spending all of its time waiting
for B.  It would be nice to know why it happened, but we shouldn't
allow CLogControlLock to act as an admission control facility for
WALWriteLock (I think).

--
Robert Haas
EnterpriseDB: http://www.enterprisedb.com
The Enterprise PostgreSQL Company
On Thu, Oct 20, 2016 at 9:03 PM, Tomas Vondra
<tomas.vondra@2ndquadrant.com> wrote:

> In the results you've posted on 10/12, you've mentioned a regression with 32
> clients, where you got 52k tps on master but only 48k tps with the patch (so
> ~10% difference). I have no idea what scale was used for those tests,

That test was with scale factor 300 on POWER 4 socket machine. I think
I need to repeat this test with multiple reading to confirm it was
regression or run to run variation. I will do that soon and post the
results.

> and I
> see no such regression in the current results (but you only report results
> for some of the client counts).

This test is on X86 8 socket machine, At 1000 scale factor I have
given reading with all client counts (32,64,96,192), but at 300 scale
factor I posted only with 192 because on this machine (X86 8 socket
machine) I did not see much load on ClogControlLock at 300 scale
factor.
>
> Also, which of the proposed patches have you been testing?
I tested with GroupLock patch.

> Can you collect and share a more complete set of data, perhaps based on the
> scripts I use to do tests on the large machine with 36/72 cores, available
> at https://bitbucket.org/tvondra/hp05-results ?

I think from my last run I did not share data for -> X86 8 socket
machine, 300 scale factor, 32,64,96 client. I already have those data
so I ma sharing it. (Please let me know if you want to see at some
other client count, for that I need to run another test.)

Head:
scaling factor: 300
query mode: prepared
number of clients: 32
number of threads: 32
duration: 1800 s
number of transactions actually processed: 77233356
latency average: 0.746 ms
tps = 42907.363243 (including connections establishing)
tps = 42907.546190 (excluding connections establishing)
[dilip.kumar@cthulhu bin]$ cat 300_32_ul.txt111757                  |  3666  1289  LWLockNamed     | ProcArrayLock
1142 Lock            | transactionid   318  LWLockNamed     | CLogControlLock   299  Lock            | extend   109
LWLockNamed    | XidGenLock    70  LWLockTranche   | buffer_content    35  Lock            | tuple    29  LWLockTranche
 | lock_manager    14  LWLockTranche   | wal_insert     1 Tuples only is on.     1  LWLockNamed     |
CheckpointerCommLock

Group Lock Patch:

scaling factor: 300
query mode: prepared
number of clients: 32
number of threads: 32
duration: 1800 s
number of transactions actually processed: 77544028
latency average: 0.743 ms
tps = 43079.783906 (including connections establishing)
tps = 43079.960331 (excluding connections establishing112209                  |  3718  1402  LWLockNamed     |
ProcArrayLock 1070  Lock            | transactionid   245  LWLockNamed     | CLogControlLock   188  Lock            |
extend   80  LWLockNamed     | XidGenLock    76  LWLockTranche   | buffer_content    39  LWLockTranche   | lock_manager
  31  Lock            | tuple     7  LWLockTranche   | wal_insert     1 Tuples only is on.     1  LWLockTranche   |
buffer_mapping

Head:
number of clients: 64
number of threads: 64
duration: 1800 s
number of transactions actually processed: 76211698
latency average: 1.512 ms
tps = 42339.731054 (including connections establishing)
tps = 42339.930464 (excluding connections establishing)
[dilip.kumar@cthulhu bin]$ cat 300_64_ul.txt215734                  |  5106  Lock            | transactionid  3754
LWLockNamed    | ProcArrayLock  3669  3267  LWLockNamed     | CLogControlLock   661  Lock            | extend   339
LWLockNamed    | XidGenLock   310  Lock            | tuple   289  LWLockTranche   | buffer_content   205  LWLockTranche
 | lock_manager    50  LWLockTranche   | wal_insert     2  LWLockTranche   | buffer_mapping     1 Tuples only is on.
1  LWLockTranche   | proc


GroupLock patch:
scaling factor: 300
query mode: prepared
number of clients: 64
number of threads: 64
duration: 1800 s
number of transactions actually processed: 76629309
latency average: 1.503 ms
tps = 42571.704635 (including connections establishing)
tps = 42571.905157 (excluding connections establishing)
[dilip.kumar@cthulhu bin]$ cat 300_64_ul.txt217840                  |  5197  Lock            | transactionid  3744
LWLockNamed    | ProcArrayLock  3663   966  Lock            | extend   849  LWLockNamed     | CLogControlLock   372
Lock           | tuple   305  LWLockNamed     | XidGenLock   199  LWLockTranche   | buffer_content   184  LWLockTranche
 | lock_manager    35  LWLockTranche   | wal_insert     1 Tuples only is on.     1  LWLockTranche   | proc     1
LWLockTranche  | buffer_mapping


Head:
scaling factor: 300
query mode: prepared
number of clients: 96
number of threads: 96
duration: 1800 s
number of transactions actually processed: 77663593
latency average: 2.225 ms
tps = 43145.624864 (including connections establishing)
tps = 43145.838167 (excluding connections establishing)
302317                  | 18836  Lock            | transactionid 12912  LWLockNamed     | CLogControlLock  4120
LWLockNamed    | ProcArrayLock  3662  1700  Lock            | tuple  1305  Lock            | extend  1030
LWLockTranche  | buffer_content   828  LWLockTranche   | lock_manager   730  LWLockNamed     | XidGenLock   107
LWLockTranche  | wal_insert     4  LWLockTranche   | buffer_mapping     1 Tuples only is on.     1  LWLockTranche   |
proc    1  BufferPin       | BufferPin


Group Lock Patch:
scaling factor: 300
query mode: prepared
number of clients: 96
number of threads: 96
duration: 1800 s
number of transactions actually processed: 61608756
latency average: 2.805 ms
tps = 44385.885080 (including connections establishing)
tps = 44386.297364 (excluding connections establishing)
[dilip.kumar@cthulhu bin]$ cat 300_96_ul.txt237842                  | 14379  Lock            | transactionid  3335
LWLockNamed    | ProcArrayLock  2850  1374  LWLockNamed     | CLogControlLock  1200  Lock            | tuple   992
Lock           | extend   717  LWLockNamed     | XidGenLock   625  LWLockTranche   | lock_manager   259  LWLockTranche
| buffer_content   105  LWLockTranche   | wal_insert     4  LWLockTranche   | buffer_mapping     2  LWLockTranche   |
proc

Head:
scaling factor: 300
query mode: prepared
number of clients: 192
number of threads: 192
duration: 1800 s
number of transactions actually processed: 65930726
latency average: 5.242 ms
tps = 36621.827041 (including connections establishing)
tps = 36622.064081 (excluding connections establishing)
[dilip.kumar@cthulhu bin]$ cat 300_192_ul.txt437848                  |118966  Lock            | transactionid 88869
LWLockNamed    | CLogControlLock 18558  Lock            | tuple  6183  LWLockTranche   | buffer_content  5664
LWLockTranche  | lock_manager  3995  LWLockNamed     | ProcArrayLock  3646  1748  Lock            | extend  1635
LWLockNamed    | XidGenLock   401  LWLockTranche   | wal_insert    33  BufferPin       | BufferPin     5  LWLockTranche
 | proc     3  LWLockTranche   | buffer_mapping


GroupLock Patch:
scaling factor: 300
query mode: prepared
number of clients: 192
number of threads: 192
duration: 1800 s
number of transactions actually processed: 82616270
latency average: 4.183 ms
tps = 45894.737813 (including connections establishing)
tps = 45894.995634 (excluding connections establishing)
120372  Lock            | transactionid 16346  Lock            | tuple  7489  LWLockTranche   | lock_manager  4514
LWLockNamed    | ProcArrayLock  3632  3310  LWLockNamed     | CLogControlLock  2287  LWLockNamed     | XidGenLock  2271
Lock            | extend   709  LWLockTranche   | buffer_content   490  LWLockTranche   | wal_insert    30  BufferPin
   | BufferPin    10  LWLockTranche   | proc     6  LWLockTranche   | buffer_mapping


Summary: On (X86 8 Socket machine, 300 S.F), I did not observe
significant wait on ClogControlLock upto 96 clients. However at 192 we
can see significant wait on ClogControlLock, but still not as bad as
we see on POWER.


>
> I've taken some time to build a simple web-based reports from the results
> collected so far (also included in the git repository), and pushed them
> here:
>
>     http://tvondra.bitbucket.org
>
> For each of the completed runs, there's a report comparing tps for different
> client counts with master and the three patches (average tps, median and
> stddev), and it's possible to download a more thorough text report with wait
> event stats, comparison of individual runs etc.

I saw your report, I think presenting it this way can give very clear idea.
>
> If you want to cooperate on this, I'm available - i.e. I can help you get
> the tooling running, customize it etc.

That will be really helpful, then next time I can also present my
reports in same format.

--
Regards,
Dilip Kumar
EnterpriseDB: http://www.enterprisedb.com
On Thu, Oct 20, 2016 at 9:15 PM, Robert Haas <robertmhaas@gmail.com> wrote:
> So here's my theory.  The whole reason why Tomas is having difficulty
> seeing any big effect from these patches is because he's testing on
> x86.  When Dilip tests on x86, he doesn't see a big effect either,
> regardless of workload.  But when Dilip tests on POWER, which I think
> is where he's mostly been testing, he sees a huge effect, because for
> some reason POWER has major problems with this lock that don't exist
> on x86.

Right, because on POWER we can see big contention on ClogControlLock
with 300 scale factor, even at 96 client count, but on X86 with 300
scan factor there is almost no contention on ClogControlLock.

However at 1000 scale factor we can see significant contention on
ClogControlLock on X86 machine.

I want to test on POWER with 1000 scale factor to see whether
contention on ClogControlLock become much worse ?

I will run this test and post the results.

--
Regards,
Dilip Kumar
EnterpriseDB: http://www.enterprisedb.com
On Fri, Oct 21, 2016 at 6:31 AM, Robert Haas <robertmhaas@gmail.com> wrote:
> On Thu, Oct 20, 2016 at 4:04 PM, Tomas Vondra
> <tomas.vondra@2ndquadrant.com> wrote:
>>> I then started a run at 96 clients which I accidentally killed shortly
>>> before it was scheduled to finish, but the results are not much
>>> different; there is no hint of the runaway CLogControlLock contention
>>> that Dilip sees on power2.
>>>
>> What shared_buffer size were you using? I assume the data set fit into
>> shared buffers, right?
>
> 8GB.
>
>> FWIW as I explained in the lengthy post earlier today, I can actually
>> reproduce the significant CLogControlLock contention (and the patches do
>> reduce it), even on x86_64.
>
> /me goes back, rereads post.  Sorry, I didn't look at this carefully
> the first time.
>
>> For example consider these two tests:
>>
>> * http://tvondra.bitbucket.org/#dilip-300-unlogged-sync
>> * http://tvondra.bitbucket.org/#pgbench-300-unlogged-sync-skip
>>
>> However, it seems I can also reproduce fairly bad regressions, like for
>> example this case with data set exceeding shared_buffers:
>>
>> * http://tvondra.bitbucket.org/#pgbench-3000-unlogged-sync-skip
>
> I'm not sure how seriously we should take the regressions.  I mean,
> what I see there is that CLogControlLock contention goes down by about
> 50% -- which is the point of the patch -- and WALWriteLock contention
> goes up dramatically -- which sucks, but can't really be blamed on the
> patch except in the indirect sense that a backend can't spend much
> time waiting for A if it's already spending all of its time waiting
> for B.
>

Right, I think not only WALWriteLock, but contention on other locks
also goes up as you can see in below table.  I think there is nothing
much we can do for that with this patch.  One thing which is unclear
is why on unlogged tests it is showing WALWriteLock?

                     test                       | clients |
wait_event_type |      wait_event      | master  | granular_locking |
no_content_lock | group_update

--------------------------------------------------+---------+-----------------+----------------------+---------+------------------+-----------------+--------------

pgbench-3000-unlogged-sync-skip                  |      72 |
LWLockNamed     | CLogControlLock      |  217012 |            37326 |        32288 |        12040
pgbench-3000-unlogged-sync-skip                  |      72 |
LWLockNamed     | WALWriteLock         |   13188 |           104183 |       123359 |       103267
pgbench-3000-unlogged-sync-skip                  |      72 |
LWLockTranche   | buffer_content       |   10532 |            65880 |        57007 |        86176
pgbench-3000-unlogged-sync-skip                  |      72 |
LWLockTranche   | wal_insert           |    9280 |            85917 |       109472 |        99609
pgbench-3000-unlogged-sync-skip                  |      72 |
LWLockTranche   | clog                 |    4623 |            25692 |        10422 |        11755


--
With Regards,
Amit Kapila.
EnterpriseDB: http://www.enterprisedb.com
On 10/21/2016 08:13 AM, Amit Kapila wrote:
> On Fri, Oct 21, 2016 at 6:31 AM, Robert Haas <robertmhaas@gmail.com> wrote:
>> On Thu, Oct 20, 2016 at 4:04 PM, Tomas Vondra
>> <tomas.vondra@2ndquadrant.com> wrote:
>>>> I then started a run at 96 clients which I accidentally killed shortly
>>>> before it was scheduled to finish, but the results are not much
>>>> different; there is no hint of the runaway CLogControlLock contention
>>>> that Dilip sees on power2.
>>>>
>>> What shared_buffer size were you using? I assume the data set fit into
>>> shared buffers, right?
>>
>> 8GB.
>>
>>> FWIW as I explained in the lengthy post earlier today, I can actually
>>> reproduce the significant CLogControlLock contention (and the patches do
>>> reduce it), even on x86_64.
>>
>> /me goes back, rereads post.  Sorry, I didn't look at this carefully
>> the first time.
>>
>>> For example consider these two tests:
>>>
>>> * http://tvondra.bitbucket.org/#dilip-300-unlogged-sync
>>> * http://tvondra.bitbucket.org/#pgbench-300-unlogged-sync-skip
>>>
>>> However, it seems I can also reproduce fairly bad regressions, like for
>>> example this case with data set exceeding shared_buffers:
>>>
>>> * http://tvondra.bitbucket.org/#pgbench-3000-unlogged-sync-skip
>>
>> I'm not sure how seriously we should take the regressions.  I mean,
>> what I see there is that CLogControlLock contention goes down by about
>> 50% -- which is the point of the patch -- and WALWriteLock contention
>> goes up dramatically -- which sucks, but can't really be blamed on the
>> patch except in the indirect sense that a backend can't spend much
>> time waiting for A if it's already spending all of its time waiting
>> for B.
>>
>
> Right, I think not only WALWriteLock, but contention on other locks
> also goes up as you can see in below table.  I think there is nothing
> much we can do for that with this patch.  One thing which is unclear
> is why on unlogged tests it is showing WALWriteLock?
>

Well, although we don't write the table data to the WAL, we still need
to write commits and other stuff, right? And on scale 3000 (which
exceeds the 16GB shared buffers in this case), there's a continuous
stream of dirty pages (not to WAL, but evicted from shared buffers), so
iostat looks like this:
      time    tps  wr_sec/s  avgrq-sz  avgqu-sz     await   %util  08:48:21  81654   1367483     16.75 127264.60
1294.80  97.41  08:48:31  41514    697516     16.80 103271.11   3015.01   97.64  08:48:41  78892   1359779     17.24
97308.42   928.36   96.76  08:48:51  58735    978475     16.66  92303.00   1472.82   95.92  08:49:01  62441   1068605
 17.11  78482.71   1615.56   95.57  08:49:11  55571    945365     17.01 113672.62   1923.37   98.07  08:49:21  69016
1161586    16.83  87055.66   1363.05   95.53  08:49:31  54552    913461     16.74  98695.87   1761.30   97.84


That's ~500-600 MB/s of continuous writes. I'm sure the storage could
handle more than this (will do some testing after the tests complete),
but surely the WAL has to compete for bandwidth (it's on the same volume
/ devices). Another thing is that we only have 8 WAL insert locks, and
maybe that leads to contention with such high client counts.

regards

--
Tomas Vondra                  http://www.2ndQuadrant.com
PostgreSQL Development, 24x7 Support, Remote DBA, Training & Services
On Fri, Oct 21, 2016 at 1:07 PM, Tomas Vondra
<tomas.vondra@2ndquadrant.com> wrote:
> On 10/21/2016 08:13 AM, Amit Kapila wrote:
>>
>> On Fri, Oct 21, 2016 at 6:31 AM, Robert Haas <robertmhaas@gmail.com>
>> wrote:
>>>
>>> On Thu, Oct 20, 2016 at 4:04 PM, Tomas Vondra
>>> <tomas.vondra@2ndquadrant.com> wrote:
>>>>>
>>>>> I then started a run at 96 clients which I accidentally killed shortly
>>>>> before it was scheduled to finish, but the results are not much
>>>>> different; there is no hint of the runaway CLogControlLock contention
>>>>> that Dilip sees on power2.
>>>>>
>>>> What shared_buffer size were you using? I assume the data set fit into
>>>> shared buffers, right?
>>>
>>>
>>> 8GB.
>>>
>>>> FWIW as I explained in the lengthy post earlier today, I can actually
>>>> reproduce the significant CLogControlLock contention (and the patches do
>>>> reduce it), even on x86_64.
>>>
>>>
>>> /me goes back, rereads post.  Sorry, I didn't look at this carefully
>>> the first time.
>>>
>>>> For example consider these two tests:
>>>>
>>>> * http://tvondra.bitbucket.org/#dilip-300-unlogged-sync
>>>> * http://tvondra.bitbucket.org/#pgbench-300-unlogged-sync-skip
>>>>
>>>> However, it seems I can also reproduce fairly bad regressions, like for
>>>> example this case with data set exceeding shared_buffers:
>>>>
>>>> * http://tvondra.bitbucket.org/#pgbench-3000-unlogged-sync-skip
>>>
>>>
>>> I'm not sure how seriously we should take the regressions.  I mean,
>>> what I see there is that CLogControlLock contention goes down by about
>>> 50% -- which is the point of the patch -- and WALWriteLock contention
>>> goes up dramatically -- which sucks, but can't really be blamed on the
>>> patch except in the indirect sense that a backend can't spend much
>>> time waiting for A if it's already spending all of its time waiting
>>> for B.
>>>
>>
>> Right, I think not only WALWriteLock, but contention on other locks
>> also goes up as you can see in below table.  I think there is nothing
>> much we can do for that with this patch.  One thing which is unclear
>> is why on unlogged tests it is showing WALWriteLock?
>>
>
> Well, although we don't write the table data to the WAL, we still need to
> write commits and other stuff, right?
>

We do need to write commit, but do we need to flush it immediately to
WAL for unlogged tables?  It seems we allow WALWriter to do that,
refer logic in RecordTransactionCommit.
And on scale 3000 (which exceeds the
> 16GB shared buffers in this case), there's a continuous stream of dirty
> pages (not to WAL, but evicted from shared buffers), so iostat looks like
> this:
>
>       time    tps  wr_sec/s  avgrq-sz  avgqu-sz     await   %util
>   08:48:21  81654   1367483     16.75 127264.60   1294.80   97.41
>   08:48:31  41514    697516     16.80 103271.11   3015.01   97.64
>   08:48:41  78892   1359779     17.24  97308.42    928.36   96.76
>   08:48:51  58735    978475     16.66  92303.00   1472.82   95.92
>   08:49:01  62441   1068605     17.11  78482.71   1615.56   95.57
>   08:49:11  55571    945365     17.01 113672.62   1923.37   98.07
>   08:49:21  69016   1161586     16.83  87055.66   1363.05   95.53
>   08:49:31  54552    913461     16.74  98695.87   1761.30   97.84
>
> That's ~500-600 MB/s of continuous writes. I'm sure the storage could handle
> more than this (will do some testing after the tests complete), but surely
> the WAL has to compete for bandwidth (it's on the same volume / devices).
> Another thing is that we only have 8 WAL insert locks, and maybe that leads
> to contention with such high client counts.
>

Yeah, quite possible, but I don't think increasing that would benefit
in general, because while writing WAL we need to take all the
wal_insert locks. In any case, I think that is a separate problem to
study.


--
With Regards,
Amit Kapila.
EnterpriseDB: http://www.enterprisedb.com
On Fri, Oct 21, 2016 at 7:57 AM, Dilip Kumar <dilipbalaut@gmail.com> wrote:
> On Thu, Oct 20, 2016 at 9:03 PM, Tomas Vondra
> <tomas.vondra@2ndquadrant.com> wrote:
>
>> In the results you've posted on 10/12, you've mentioned a regression with 32
>> clients, where you got 52k tps on master but only 48k tps with the patch (so
>> ~10% difference). I have no idea what scale was used for those tests,
>
> That test was with scale factor 300 on POWER 4 socket machine. I think
> I need to repeat this test with multiple reading to confirm it was
> regression or run to run variation. I will do that soon and post the
> results.

As promised, I have rerun my test (3 times), and I did not see any regression.
Median of 3 run on both head and with group lock patch are same.
However I am posting results of all three runs.

I think in my earlier reading, we saw TPS ~48K with the patch, but I
think over multiple run we get this reading with both head as well as
with patch.

Head:
--------
run1:

transaction type: <builtin: TPC-B (sort of)>
scaling factor: 300
query mode: prepared
number of clients: 32
number of threads: 32
duration: 1800 s
number of transactions actually processed: 87784836
latency average = 0.656 ms
tps = 48769.327513 (including connections establishing)
tps = 48769.543276 (excluding connections establishing)

run2:
transaction type: <builtin: TPC-B (sort of)>
scaling factor: 300
query mode: prepared
number of clients: 32
number of threads: 32
duration: 1800 s
number of transactions actually processed: 91240374
latency average = 0.631 ms
tps = 50689.069717 (including connections establishing)
tps = 50689.263505 (excluding connections establishing)

run3:
transaction type: <builtin: TPC-B (sort of)>
scaling factor: 300
query mode: prepared
number of clients: 32
number of threads: 32
duration: 1800 s
number of transactions actually processed: 90966003
latency average = 0.633 ms
tps = 50536.639303 (including connections establishing)
tps = 50536.836924 (excluding connections establishing)

With group lock patch:
------------------------------
run1:
transaction type: <builtin: TPC-B (sort of)>
scaling factor: 300
query mode: prepared
number of clients: 32
number of threads: 32
duration: 1800 s
number of transactions actually processed: 87316264
latency average = 0.660 ms
tps = 48509.008040 (including connections establishing)
tps = 48509.194978 (excluding connections establishing)

run2:
transaction type: <builtin: TPC-B (sort of)>
scaling factor: 300
query mode: prepared
number of clients: 32
number of threads: 32
duration: 1800 s
number of transactions actually processed: 91950412
latency average = 0.626 ms
tps = 51083.507790 (including connections establishing)
tps = 51083.704489 (excluding connections establishing)

run3:
transaction type: <builtin: TPC-B (sort of)>
scaling factor: 300
query mode: prepared
number of clients: 32
number of threads: 32
duration: 1800 s
number of transactions actually processed: 90378462
latency average = 0.637 ms
tps = 50210.225983 (including connections establishing)
tps = 50210.405401 (excluding connections establishing)

--
Regards,
Dilip Kumar
EnterpriseDB: http://www.enterprisedb.com
On Mon, Oct 24, 2016 at 2:48 PM, Dilip Kumar <dilipbalaut@gmail.com> wrote:
> On Fri, Oct 21, 2016 at 7:57 AM, Dilip Kumar <dilipbalaut@gmail.com> wrote:
>> On Thu, Oct 20, 2016 at 9:03 PM, Tomas Vondra
>> <tomas.vondra@2ndquadrant.com> wrote:
>>
>>> In the results you've posted on 10/12, you've mentioned a regression with 32
>>> clients, where you got 52k tps on master but only 48k tps with the patch (so
>>> ~10% difference). I have no idea what scale was used for those tests,
>>
>> That test was with scale factor 300 on POWER 4 socket machine. I think
>> I need to repeat this test with multiple reading to confirm it was
>> regression or run to run variation. I will do that soon and post the
>> results.
>
> As promised, I have rerun my test (3 times), and I did not see any regression.
>

Thanks Tomas and Dilip for doing detailed performance tests for this
patch.  I would like to summarise the performance testing results.

1. With update intensive workload, we are seeing gains from 23%~192%
at client count >=64 with group_update patch [1].
2. With tpc-b pgbench workload (at 1000 scale factor), we are seeing
gains from 12% to ~70% at client count >=64 [2].  Tests are done on
8-socket intel   m/c.
3. With pgbench workload (both simple-update and tpc-b at 300 scale
factor), we are seeing gain 10% to > 50% at client count >=64 [3].
Tests are done on 8-socket intel m/c.
4. To see why the patch only helps at higher client count, we have
done wait event testing for various workloads [4], [5] and the results
indicate that at lower clients, the waits are mostly due to
transactionid or clientread.  At client-counts where contention due to
CLOGControlLock is significant, this patch helps a lot to reduce that
contention.  These tests are done on on 8-socket intel m/c and
4-socket power m/c
5. With pgbench workload (unlogged tables), we are seeing gains from
15% to > 300% at client count >=72 [6].

There are many more tests done for the proposed patches where gains
are either or similar lines as above or are neutral.  We do see
regression in some cases.

1. When data doesn't fit in shared buffers, there is regression at
some client counts [7], but on analysis it has been found that it is
mainly due to the shift in contention from CLOGControlLock to
WALWriteLock and or other locks.
2. We do see in some cases that granular_locking and no_content_lock
patches has shown significant increase in contention on
CLOGControlLock.  I have already shared my analysis for same upthread
[8].

Attached is the latest group update clog patch.

In last commit fest, the patch was returned with feedback to evaluate
the cases where it can show win and I think above results indicates
that the patch has significant benefit on various workloads.  What I
think is pending at this stage is the either one of the committer or
the reviewers of this patch needs to provide feedback on my analysis
[8] for the cases where patches are not showing win.

Thoughts?

[1] - https://www.postgresql.org/message-id/CAFiTN-u-XEzhd%3DhNGW586fmQwdTy6Qy6_SXe09tNB%3DgBcVzZ_A%40mail.gmail.com
[2] - https://www.postgresql.org/message-id/CAFiTN-tr_%3D25EQUFezKNRk%3D4N-V%2BD6WMxo7HWs9BMaNx7S3y6w%40mail.gmail.com
[3] - https://www.postgresql.org/message-id/CAFiTN-v5hm1EO4cLXYmpppYdNQk%2Bn4N-O1m%2B%2B3U9f0Ga1gBzRQ%40mail.gmail.com
[4] - https://www.postgresql.org/message-id/CAFiTN-taV4iVkPHrxg%3DYCicKjBS6%3DQZm_cM4hbS_2q2ryLhUUw%40mail.gmail.com
[5] - https://www.postgresql.org/message-id/CAFiTN-uQ%2BJbd31cXvRbj48Ba6TqDUDpLKSPnsUCCYRju0Y0U8Q%40mail.gmail.com
[6] - http://tvondra.bitbucket.org/#pgbench-300-unlogged-sync-skip
[7] - http://tvondra.bitbucket.org/#pgbench-3000-unlogged-sync-skip
[8] - https://www.postgresql.org/message-id/CAA4eK1J9VxJUnpOiQDf0O%3DZ87QUMbw%3DuGcQr4EaGbHSCibx9yA%40mail.gmail.com

--
With Regards,
Amit Kapila.
EnterpriseDB: http://www.enterprisedb.com
Вложения
On 10/25/2016 06:10 AM, Amit Kapila wrote:
> On Mon, Oct 24, 2016 at 2:48 PM, Dilip Kumar <dilipbalaut@gmail.com> wrote:
>> On Fri, Oct 21, 2016 at 7:57 AM, Dilip Kumar <dilipbalaut@gmail.com> wrote:
>>> On Thu, Oct 20, 2016 at 9:03 PM, Tomas Vondra
>>> <tomas.vondra@2ndquadrant.com> wrote:
>>>
>>>> In the results you've posted on 10/12, you've mentioned a regression with 32
>>>> clients, where you got 52k tps on master but only 48k tps with the patch (so
>>>> ~10% difference). I have no idea what scale was used for those tests,
>>>
>>> That test was with scale factor 300 on POWER 4 socket machine. I think
>>> I need to repeat this test with multiple reading to confirm it was
>>> regression or run to run variation. I will do that soon and post the
>>> results.
>>
>> As promised, I have rerun my test (3 times), and I did not see any regression.
>>
>
> Thanks Tomas and Dilip for doing detailed performance tests for this
> patch.  I would like to summarise the performance testing results.
>
> 1. With update intensive workload, we are seeing gains from 23%~192%
> at client count >=64 with group_update patch [1].
> 2. With tpc-b pgbench workload (at 1000 scale factor), we are seeing
> gains from 12% to ~70% at client count >=64 [2].  Tests are done on
> 8-socket intel   m/c.
> 3. With pgbench workload (both simple-update and tpc-b at 300 scale
> factor), we are seeing gain 10% to > 50% at client count >=64 [3].
> Tests are done on 8-socket intel m/c.
> 4. To see why the patch only helps at higher client count, we have
> done wait event testing for various workloads [4], [5] and the results
> indicate that at lower clients, the waits are mostly due to
> transactionid or clientread.  At client-counts where contention due to
> CLOGControlLock is significant, this patch helps a lot to reduce that
> contention.  These tests are done on on 8-socket intel m/c and
> 4-socket power m/c
> 5. With pgbench workload (unlogged tables), we are seeing gains from
> 15% to > 300% at client count >=72 [6].
>

It's not entirely clear which of the above tests were done on unlogged
tables, and I don't see that in the referenced e-mails. That would be an
interesting thing to mention in the summary, I think.

> There are many more tests done for the proposed patches where gains
> are either or similar lines as above or are neutral.  We do see
> regression in some cases.
>
> 1. When data doesn't fit in shared buffers, there is regression at
> some client counts [7], but on analysis it has been found that it is
> mainly due to the shift in contention from CLOGControlLock to
> WALWriteLock and or other locks.

The questions is why shifting the lock contention to WALWriteLock should
cause such significant performance drop, particularly when the test was
done on unlogged tables. Or, if that's the case, how it makes the
performance drop less problematic / acceptable.

FWIW I plan to run the same test with logged tables - if it shows
similar regression, I'll be much more worried, because that's a fairly
typical scenario (logged tables, data set > shared buffers), and we
surely can't just go and break that.

> 2. We do see in some cases that granular_locking and no_content_lock
> patches has shown significant increase in contention on
> CLOGControlLock.  I have already shared my analysis for same upthread
> [8].

I do agree that some cases this significantly reduces contention on the
CLogControlLock. I do however think that currently the performance gains
are limited almost exclusively to cases on unlogged tables, and some
logged+async cases.

On logged tables it usually looks like this (i.e. modest increase for
high client counts at the expense of significantly higher variability):
  http://tvondra.bitbucket.org/#pgbench-3000-logged-sync-skip-64

or like this (i.e. only partial recovery for the drop above 36 clients):
  http://tvondra.bitbucket.org/#pgbench-3000-logged-async-skip-64

And of course, there are cases like this:
  http://tvondra.bitbucket.org/#dilip-300-logged-async

I'd really like to understand why the patched results behave that
differently depending on client count.
>> Attached is the latest group update clog patch.>

How is that different from the previous versions?
>
> In last commit fest, the patch was returned with feedback to evaluate
> the cases where it can show win and I think above results indicates
> that the patch has significant benefit on various workloads.  What I
> think is pending at this stage is the either one of the committer or
> the reviewers of this patch needs to provide feedback on my analysis
> [8] for the cases where patches are not showing win.
>
> Thoughts?
>

I do agree the patch(es) significantly reduce CLogControlLock, although
with WAL logging enabled (which is what matters for most production
deployments) it pretty much only shifts the contention to a different
lock (so the immediate performance benefit is 0).

Which raises the question why to commit this patch now, before we have a
patch addressing the WAL locks. I realize this is a chicken-egg problem,
but my worry is that the increased WALWriteLock contention will cause
regressions in current workloads.

BTW I've ran some tests with the number of clog buffers increases to
512, and it seems like a fairly positive. Compare for example these two
results:
  http://tvondra.bitbucket.org/#pgbench-300-unlogged-sync-skip
http://tvondra.bitbucket.org/#pgbench-300-unlogged-sync-skip-clog-512

The first one is with the default 128 buffers, the other one is with 512
buffers. The impact on master is pretty obvious - for 72 clients the tps
jumps from 160k to 197k, and for higher client counts it gives us about
+50k tps (typically increase from ~80k to ~130k tps). And the tps
variability is significantly reduced.

For the other workload, the results are less convincing though:
  http://tvondra.bitbucket.org/#dilip-300-unlogged-sync
http://tvondra.bitbucket.org/#dilip-300-unlogged-sync-clog-512

Interesting that the master adopts the zig-zag patter, but shifted.

regards

--
Tomas Vondra                  http://www.2ndQuadrant.com
PostgreSQL Development, 24x7 Support, Remote DBA, Training & Services
On Thu, Oct 27, 2016 at 4:15 AM, Tomas Vondra
<tomas.vondra@2ndquadrant.com> wrote:
> On 10/25/2016 06:10 AM, Amit Kapila wrote:
>>
>> On Mon, Oct 24, 2016 at 2:48 PM, Dilip Kumar <dilipbalaut@gmail.com>
>> wrote:
>>>
>>> On Fri, Oct 21, 2016 at 7:57 AM, Dilip Kumar <dilipbalaut@gmail.com>
>>> wrote:
>>>>
>>>> On Thu, Oct 20, 2016 at 9:03 PM, Tomas Vondra
>>>> <tomas.vondra@2ndquadrant.com> wrote:
>>>>
>>>>> In the results you've posted on 10/12, you've mentioned a regression
>>>>> with 32
>>>>> clients, where you got 52k tps on master but only 48k tps with the
>>>>> patch (so
>>>>> ~10% difference). I have no idea what scale was used for those tests,
>>>>
>>>>
>>>> That test was with scale factor 300 on POWER 4 socket machine. I think
>>>> I need to repeat this test with multiple reading to confirm it was
>>>> regression or run to run variation. I will do that soon and post the
>>>> results.
>>>
>>>
>>> As promised, I have rerun my test (3 times), and I did not see any
>>> regression.
>>>
>>
>> Thanks Tomas and Dilip for doing detailed performance tests for this
>> patch.  I would like to summarise the performance testing results.
>>
>> 1. With update intensive workload, we are seeing gains from 23%~192%
>> at client count >=64 with group_update patch [1].
>> 2. With tpc-b pgbench workload (at 1000 scale factor), we are seeing
>> gains from 12% to ~70% at client count >=64 [2].  Tests are done on
>> 8-socket intel   m/c.
>> 3. With pgbench workload (both simple-update and tpc-b at 300 scale
>> factor), we are seeing gain 10% to > 50% at client count >=64 [3].
>> Tests are done on 8-socket intel m/c.
>> 4. To see why the patch only helps at higher client count, we have
>> done wait event testing for various workloads [4], [5] and the results
>> indicate that at lower clients, the waits are mostly due to
>> transactionid or clientread.  At client-counts where contention due to
>> CLOGControlLock is significant, this patch helps a lot to reduce that
>> contention.  These tests are done on on 8-socket intel m/c and
>> 4-socket power m/c
>> 5. With pgbench workload (unlogged tables), we are seeing gains from
>> 15% to > 300% at client count >=72 [6].
>>
>
> It's not entirely clear which of the above tests were done on unlogged
> tables, and I don't see that in the referenced e-mails. That would be an
> interesting thing to mention in the summary, I think.
>

One thing is clear that all results are on either
synchronous_commit=off or on unlogged tables.  I think Dilip can
answer better which of those are on unlogged and which on
synchronous_commit=off.

>> There are many more tests done for the proposed patches where gains
>> are either or similar lines as above or are neutral.  We do see
>> regression in some cases.
>>
>> 1. When data doesn't fit in shared buffers, there is regression at
>> some client counts [7], but on analysis it has been found that it is
>> mainly due to the shift in contention from CLOGControlLock to
>> WALWriteLock and or other locks.
>
>
> The questions is why shifting the lock contention to WALWriteLock should
> cause such significant performance drop, particularly when the test was done
> on unlogged tables. Or, if that's the case, how it makes the performance
> drop less problematic / acceptable.
>

Whenever the contention shifts to other lock, there is a chance that
it can show performance dip in some cases and I have seen that
previously as well. The theory behind that could be like this, say you
have two locks L1 and L2, and there are 100 processes that are
contending on L1 and 50 on L2.  Now say, you reduce contention on L1
such that it leads to 120 processes contending on L2, so increased
contention on L2 can slowdown the overall throughput of all processes.

> FWIW I plan to run the same test with logged tables - if it shows similar
> regression, I'll be much more worried, because that's a fairly typical
> scenario (logged tables, data set > shared buffers), and we surely can't
> just go and break that.
>

Sure, please do those tests.

>> 2. We do see in some cases that granular_locking and no_content_lock
>> patches has shown significant increase in contention on
>> CLOGControlLock.  I have already shared my analysis for same upthread
>> [8].
>
>
> I do agree that some cases this significantly reduces contention on the
> CLogControlLock. I do however think that currently the performance gains are
> limited almost exclusively to cases on unlogged tables, and some
> logged+async cases.
>

Right, because the contention is mainly visible for those workloads.

> On logged tables it usually looks like this (i.e. modest increase for high
> client counts at the expense of significantly higher variability):
>
>   http://tvondra.bitbucket.org/#pgbench-3000-logged-sync-skip-64
>

What variability are you referring to in those results?

> or like this (i.e. only partial recovery for the drop above 36 clients):
>
>   http://tvondra.bitbucket.org/#pgbench-3000-logged-async-skip-64
>
> And of course, there are cases like this:
>
>   http://tvondra.bitbucket.org/#dilip-300-logged-async
>
> I'd really like to understand why the patched results behave that
> differently depending on client count.
>

I have already explained this upthread [1].  Refer text after line "I
have checked the wait event results where there is more fluctuation:"

>>
>> Attached is the latest group update clog patch.
>>
>
> How is that different from the previous versions?
>

Previous patch was showing some hunks when you try to apply.  I
thought it might be better to rebase so that it can be applied
cleanly, otherwise there is no change in code.

>>
>>
>> In last commit fest, the patch was returned with feedback to evaluate
>> the cases where it can show win and I think above results indicates
>> that the patch has significant benefit on various workloads.  What I
>> think is pending at this stage is the either one of the committer or
>> the reviewers of this patch needs to provide feedback on my analysis
>> [8] for the cases where patches are not showing win.
>>
>> Thoughts?
>>
>
> I do agree the patch(es) significantly reduce CLogControlLock, although with
> WAL logging enabled (which is what matters for most production deployments)
> it pretty much only shifts the contention to a different lock (so the
> immediate performance benefit is 0).
>

Yeah, but I think there are use cases where users can use
synchronous_commit=off.

> Which raises the question why to commit this patch now, before we have a
> patch addressing the WAL locks. I realize this is a chicken-egg problem, but
> my worry is that the increased WALWriteLock contention will cause
> regressions in current workloads.
>

I think if we use that theory, we won't be able to make progress in
terms of reducing lock contention.  I think we have previously
committed the code in such situations.  For example while reducing
contention in buffer management area
(d72731a70450b5e7084991b9caa15cb58a2820df), I have noticed such a
behaviour and reported my analysis [2] as well (In the mail [2], you
can see there is performance improvement at 1000 scale factor and dip
at 5000 scale factor).  Later on, when the contention on dynahash
spinlocks got alleviated (44ca4022f3f9297bab5cbffdd97973dbba1879ed),
the results were much better.  If we would not have reduced the
contention in buffer management, then the benefits with dynahash
improvements wouldn't have been much in those workloads (if you want,
I can find out and share the results of dynhash improvements).

> BTW I've ran some tests with the number of clog buffers increases to 512,
> and it seems like a fairly positive. Compare for example these two results:
>
>   http://tvondra.bitbucket.org/#pgbench-300-unlogged-sync-skip
>   http://tvondra.bitbucket.org/#pgbench-300-unlogged-sync-skip-clog-512
>
> The first one is with the default 128 buffers, the other one is with 512
> buffers. The impact on master is pretty obvious - for 72 clients the tps
> jumps from 160k to 197k, and for higher client counts it gives us about +50k
> tps (typically increase from ~80k to ~130k tps). And the tps variability is
> significantly reduced.
>

Interesting, because last time I have done such testing by increasing
clog buffers, it didn't show any improvement, rather If I remember
correctly it was showing some regression.  I am not sure what is best
way to handle this, may be we can make clogbuffers as guc variable.


[1] - https://www.postgresql.org/message-id/CAA4eK1J9VxJUnpOiQDf0O%3DZ87QUMbw%3DuGcQr4EaGbHSCibx9yA%40mail.gmail.com
[2] - https://www.postgresql.org/message-id/CAA4eK1JUPn1rV0ep5DR74skcv%2BRRK7i2inM1X01ajG%2BgCX-hMw%40mail.gmail.com

--
With Regards,
Amit Kapila.
EnterpriseDB: http://www.enterprisedb.com
On Thu, Oct 27, 2016 at 5:14 PM, Amit Kapila <amit.kapila16@gmail.com> wrote:
>>> Thanks Tomas and Dilip for doing detailed performance tests for this
>>> patch.  I would like to summarise the performance testing results.
>>>
>>> 1. With update intensive workload, we are seeing gains from 23%~192%
>>> at client count >=64 with group_update patch [1].

this is with unlogged table

>>> 2. With tpc-b pgbench workload (at 1000 scale factor), we are seeing
>>> gains from 12% to ~70% at client count >=64 [2].  Tests are done on
>>> 8-socket intel   m/c.

this is with synchronous_commit=off

>>> 3. With pgbench workload (both simple-update and tpc-b at 300 scale
>>> factor), we are seeing gain 10% to > 50% at client count >=64 [3].
>>> Tests are done on 8-socket intel m/c.

this is with synchronous_commit=off

>>> 4. To see why the patch only helps at higher client count, we have
>>> done wait event testing for various workloads [4], [5] and the results
>>> indicate that at lower clients, the waits are mostly due to
>>> transactionid or clientread.  At client-counts where contention due to
>>> CLOGControlLock is significant, this patch helps a lot to reduce that
>>> contention.  These tests are done on on 8-socket intel m/c and
>>> 4-socket power m/c

these both are with synchronous_commit=off + unlogged table

>>> 5. With pgbench workload (unlogged tables), we are seeing gains from
>>> 15% to > 300% at client count >=72 [6].
>>>
>>
>> It's not entirely clear which of the above tests were done on unlogged
>> tables, and I don't see that in the referenced e-mails. That would be an
>> interesting thing to mention in the summary, I think.
>>
>
> One thing is clear that all results are on either
> synchronous_commit=off or on unlogged tables.  I think Dilip can
> answer better which of those are on unlogged and which on
> synchronous_commit=off.

I have mentioned this above under each of your test point..

--
Regards,
Dilip Kumar
EnterpriseDB: http://www.enterprisedb.com
Hi,

On 10/27/2016 01:44 PM, Amit Kapila wrote:
> On Thu, Oct 27, 2016 at 4:15 AM, Tomas Vondra
> <tomas.vondra@2ndquadrant.com> wrote:
>>
>> FWIW I plan to run the same test with logged tables - if it shows similar
>> regression, I'll be much more worried, because that's a fairly typical
>> scenario (logged tables, data set > shared buffers), and we surely can't
>> just go and break that.
>>
>
> Sure, please do those tests.
>

OK, so I do have results for those tests - that is, scale 3000 with
shared_buffers=16GB (so continuously writing out dirty buffers). The
following reports show the results slightly differently - all three "tps
charts" next to each other, then the speedup charts and tables.

Overall, the results are surprisingly positive - look at these results
(all ending with "-retest"):

[1] http://tvondra.bitbucket.org/index2.html#dilip-3000-logged-sync-retest

[2]
http://tvondra.bitbucket.org/index2.html#pgbench-3000-logged-sync-noskip-retest

[3]
http://tvondra.bitbucket.org/index2.html#pgbench-3000-logged-sync-skip-retest

All three show significant improvement, even with fairly low client
counts. For example with 72 clients, the tps improves 20%, without
significantly affecting variability variability of the results( measured
as stdddev, more on this later).

It's however interesting that "no_content_lock" is almost exactly the
same as master, while the other two cases improve significantly.

The other interesting thing is that "pgbench -N" [3] shows no such
improvement, unlike regular pgbench and Dilip's workload. Not sure why,
though - I'd expect to see significant improvement in this case.

I have also repeated those tests with clog buffers increased to 512 (so
4x the current maximum of 128). I only have results for Dilip's workload
and "pgbench -N":

[4]
http://tvondra.bitbucket.org/index2.html#dilip-3000-logged-sync-retest-512

[5]
http://tvondra.bitbucket.org/index2.html#pgbench-3000-logged-sync-skip-retest-512

The results are somewhat surprising, I guess, because the effect is
wildly different for each workload.

For Dilip's workload increasing clog buffers to 512 pretty much
eliminates all benefits of the patches. For example with 288 client, the
group_update patch gives ~60k tps on 128 buffers [1] but only 42k tps on
512 buffers [4].

With "pgbench -N", the effect is exactly the opposite - while with 128
buffers there was pretty much no benefit from any of the patches [3],
with 512 buffers we suddenly get almost 2x the throughput, but only for
group_update and master (while the other two patches show no improvement
at all).

I don't have results for the regular pgbench ("noskip") with 512 buffers
yet, but I'm curious what that will show.

In general I however think that the patches don't show any regression in
any of those workloads (at least not with 128 buffers). Based solely on
the results, I like the group_update more, because it performs as good
as master or significantly better.

>>> 2. We do see in some cases that granular_locking and
>>> no_content_lock patches has shown significant increase in
>>> contention on CLOGControlLock. I have already shared my analysis
>>> for same upthread [8].
>>

I've read that analysis, but I'm not sure I see how it explains the "zig
zag" behavior. I do understand that shifting the contention to some
other (already busy) lock may negatively impact throughput, or that the
group_update may result in updating multiple clog pages, but I don't
understand two things:

(1) Why this should result in the fluctuations we observe in some of the
cases. For example, why should we see 150k tps on, 72 clients, then drop
to 92k with 108 clients, then back to 130k on 144 clients, then 84k on
180 clients etc. That seems fairly strange.

(2) Why this should affect all three patches, when only group_update has
to modify multiple clog pages.

For example consider this:
    http://tvondra.bitbucket.org/index2.html#dilip-300-logged-async

For example looking at % of time spent on different locks with the
group_update patch, I see this (ignoring locks with ~1%):
 event_type     wait_event       36   72  108  144  180  216  252  288
----------------------------------------------------------------------              -                60   63   45   53
38   50   33   48 Client         ClientRead       33   23    9   14    6   10    4    8 LWLockNamed    CLogControlLock
2    7   33   14   34   14   33   14 LWLockTranche  buffer_content    0    2    9   13   19   18   26   22


I don't see any sign of contention shifting to other locks, just
CLogControlLock fluctuating between 14% and 33% for some reason.

Now, maybe this has nothing to do with PostgreSQL itself, but maybe it's
some sort of CPU / OS scheduling artifact. For example, the system has
36 physical cores, 72 virtual ones (thanks to HT). I find it strange
that the "good" client counts are always multiples of 72, while the
"bad" ones fall in between.
  72 = 72 * 1   (good) 108 = 72 * 1.5 (bad) 144 = 72 * 2   (good) 180 = 72 * 2.5 (bad) 216 = 72 * 3   (good) 252 = 72 *
3.5(bad) 288 = 72 * 4   (good)


So maybe this has something to do with how OS schedules the tasks, or
maybe some internal heuristics in the CPU, or something like that.


>> On logged tables it usually looks like this (i.e. modest increase for high
>> client counts at the expense of significantly higher variability):
>>
>>   http://tvondra.bitbucket.org/#pgbench-3000-logged-sync-skip-64
>>
>
> What variability are you referring to in those results?>

Good question. What I mean by "variability" is how stable the tps is
during the benchmark (when measured on per-second granularity). For
example, let's run a 10-second benchmark, measuring number of
transactions committed each second.

Then all those runs do 1000 tps on average:
  run 1: 1000, 1000, 1000, 1000, 1000, 1000, 1000, 1000, 1000, 1000  run 2: 500, 1500, 500, 1500, 500, 1500, 500, 1500,
500,1500  run 3: 0, 2000, 0, 2000, 0, 2000, 0, 2000, 0, 2000


I guess we agree those runs behave very differently, despite having the
same throughput. So this is what STDDEV(tps) measures, i.e. the third
chart on the reports, shows.

So for example this [6] shows that the patches give us higher throughput
with >= 180 clients, but we also pay for that with increased variability
of the results (i.e. the tps chart will have jitter):

[6]
http://tvondra.bitbucket.org/index2.html#pgbench-3000-logged-sync-skip-64

Of course, exchanging throughput, latency and variability is one of the
crucial trade-offs in transactions systems - at some point the resources
get saturated and higher throughput can only be achieved in exchange for
latency (e.g. by grouping requests). But still, we'd like to get stable
tps from the system, not something that gives us 2000 tps one second and
0 tps the next one.

Of course, this is not perfect - it does not show whether there are
transactions with significantly higher latency, and so on. It'd be good
to also measure latency, but I haven't collected that info during the
runs so far.

regards

--
Tomas Vondra                  http://www.2ndQuadrant.com
PostgreSQL Development, 24x7 Support, Remote DBA, Training & Services
On 10/30/16 1:32 PM, Tomas Vondra wrote:
>
> Now, maybe this has nothing to do with PostgreSQL itself, but maybe it's
> some sort of CPU / OS scheduling artifact. For example, the system has
> 36 physical cores, 72 virtual ones (thanks to HT). I find it strange
> that the "good" client counts are always multiples of 72, while the
> "bad" ones fall in between.
>
>   72 = 72 * 1   (good)
>  108 = 72 * 1.5 (bad)
>  144 = 72 * 2   (good)
>  180 = 72 * 2.5 (bad)
>  216 = 72 * 3   (good)
>  252 = 72 * 3.5 (bad)
>  288 = 72 * 4   (good)
>
> So maybe this has something to do with how OS schedules the tasks, or
> maybe some internal heuristics in the CPU, or something like that.

It might be enlightening to run a series of tests that are 72*.1 or *.2
apart (say, 72, 79, 86, ..., 137, 144).
--
Jim Nasby, Data Architect, Blue Treble Consulting, Austin TX
Experts in Analytics, Data Architecture and PostgreSQL
Data in Trouble? Get it in Treble! http://BlueTreble.com
855-TREBLE2 (855-873-2532)   mobile: 512-569-9461
On 10/31/2016 05:01 AM, Jim Nasby wrote:
> On 10/30/16 1:32 PM, Tomas Vondra wrote:
>>
>> Now, maybe this has nothing to do with PostgreSQL itself, but maybe it's
>> some sort of CPU / OS scheduling artifact. For example, the system has
>> 36 physical cores, 72 virtual ones (thanks to HT). I find it strange
>> that the "good" client counts are always multiples of 72, while the
>> "bad" ones fall in between.
>>
>>   72 = 72 * 1   (good)
>>  108 = 72 * 1.5 (bad)
>>  144 = 72 * 2   (good)
>>  180 = 72 * 2.5 (bad)
>>  216 = 72 * 3   (good)
>>  252 = 72 * 3.5 (bad)
>>  288 = 72 * 4   (good)
>>
>> So maybe this has something to do with how OS schedules the tasks, or
>> maybe some internal heuristics in the CPU, or something like that.
>
> It might be enlightening to run a series of tests that are 72*.1 or *.2
> apart (say, 72, 79, 86, ..., 137, 144).

Yeah, I've started a benchmark with client a step of 6 clients
    36 42 48 54 60 66 72 78 ... 252 258 264 270 276 282 288

instead of just
    36 72 108 144 180 216 252 288

which did a test every 36 clients. To compensate for the 6x longer runs,
I'm only running tests for "group-update" and "master", so I should have
the results in ~36h.

regards

--
Tomas Vondra                  http://www.2ndQuadrant.com
PostgreSQL Development, 24x7 Support, Remote DBA, Training & Services
On 10/30/2016 07:32 PM, Tomas Vondra wrote:
> Hi,
>
> On 10/27/2016 01:44 PM, Amit Kapila wrote:
>> On Thu, Oct 27, 2016 at 4:15 AM, Tomas Vondra
>> <tomas.vondra@2ndquadrant.com> wrote:
>>>
>>> FWIW I plan to run the same test with logged tables - if it shows
>>> similar
>>> regression, I'll be much more worried, because that's a fairly typical
>>> scenario (logged tables, data set > shared buffers), and we surely can't
>>> just go and break that.
>>>
>>
>> Sure, please do those tests.
>>
>
> OK, so I do have results for those tests - that is, scale 3000 with
> shared_buffers=16GB (so continuously writing out dirty buffers). The
> following reports show the results slightly differently - all three "tps
> charts" next to each other, then the speedup charts and tables.
>
> Overall, the results are surprisingly positive - look at these results
> (all ending with "-retest"):
>
> [1] http://tvondra.bitbucket.org/index2.html#dilip-3000-logged-sync-retest
>
> [2]
> http://tvondra.bitbucket.org/index2.html#pgbench-3000-logged-sync-noskip-retest
>
>
> [3]
> http://tvondra.bitbucket.org/index2.html#pgbench-3000-logged-sync-skip-retest
>
>
> All three show significant improvement, even with fairly low client
> counts. For example with 72 clients, the tps improves 20%, without
> significantly affecting variability variability of the results( measured
> as stdddev, more on this later).
>
> It's however interesting that "no_content_lock" is almost exactly the
> same as master, while the other two cases improve significantly.
>
> The other interesting thing is that "pgbench -N" [3] shows no such
> improvement, unlike regular pgbench and Dilip's workload. Not sure why,
> though - I'd expect to see significant improvement in this case.
>
> I have also repeated those tests with clog buffers increased to 512 (so
> 4x the current maximum of 128). I only have results for Dilip's workload
> and "pgbench -N":
>
> [4]
> http://tvondra.bitbucket.org/index2.html#dilip-3000-logged-sync-retest-512
>
> [5]
> http://tvondra.bitbucket.org/index2.html#pgbench-3000-logged-sync-skip-retest-512
>
>
> The results are somewhat surprising, I guess, because the effect is
> wildly different for each workload.
>
> For Dilip's workload increasing clog buffers to 512 pretty much
> eliminates all benefits of the patches. For example with 288 client,
> the group_update patch gives ~60k tps on 128 buffers [1] but only 42k
> tps on 512 buffers [4].
>
> With "pgbench -N", the effect is exactly the opposite - while with
> 128 buffers there was pretty much no benefit from any of the patches
> [3], with 512 buffers we suddenly get almost 2x the throughput, but
> only for group_update and master (while the other two patches show no
> improvement at all).
>

The remaining benchmark with 512 clog buffers completed, and the impact
roughly matches Dilip's benchmark - that is, increasing the number of
clog buffers eliminates all positive impact of the patches observed on
128 buffers. Compare these two reports:

[a] http://tvondra.bitbucket.org/#pgbench-3000-logged-sync-noskip-retest

[b] http://tvondra.bitbucket.org/#pgbench-3000-logged-sync-noskip-retest-512

With 128 buffers the group_update and granular_locking patches achieve
up to 50k tps, while master and no_content_lock do ~30k tps. After
increasing number of clog buffers, we get only ~30k in all cases.

I'm not sure what's causing this, whether we're hitting limits of the
simple LRU cache used for clog buffers, or something else. But maybe
there's something in the design of clog buffers that make them work less
efficiently with more clog buffers? I'm not sure whether that's
something we need to fix before eventually committing any of them.

regards

--
Tomas Vondra                  http://www.2ndQuadrant.com
PostgreSQL Development, 24x7 Support, Remote DBA, Training & Services
On Mon, Oct 31, 2016 at 12:02 AM, Tomas Vondra
<tomas.vondra@2ndquadrant.com> wrote:
> Hi,
>
> On 10/27/2016 01:44 PM, Amit Kapila wrote:
>
> I've read that analysis, but I'm not sure I see how it explains the "zig
> zag" behavior. I do understand that shifting the contention to some other
> (already busy) lock may negatively impact throughput, or that the
> group_update may result in updating multiple clog pages, but I don't
> understand two things:
>
> (1) Why this should result in the fluctuations we observe in some of the
> cases. For example, why should we see 150k tps on, 72 clients, then drop to
> 92k with 108 clients, then back to 130k on 144 clients, then 84k on 180
> clients etc. That seems fairly strange.
>

I don't think hitting multiple clog pages has much to do with
client-count.  However, we can wait to see your further detailed test
report.

> (2) Why this should affect all three patches, when only group_update has to
> modify multiple clog pages.
>

No, all three patches can be affected due to multiple clog pages.
Read second paragraph ("I think one of the probable reasons that could
happen for both the approaches") in same e-mail [1].  It is basically
due to frequent release-and-reacquire of locks.

>
>
>>> On logged tables it usually looks like this (i.e. modest increase for
>>> high
>>> client counts at the expense of significantly higher variability):
>>>
>>>   http://tvondra.bitbucket.org/#pgbench-3000-logged-sync-skip-64
>>>
>>
>> What variability are you referring to in those results?
>
>>
>
> Good question. What I mean by "variability" is how stable the tps is during
> the benchmark (when measured on per-second granularity). For example, let's
> run a 10-second benchmark, measuring number of transactions committed each
> second.
>
> Then all those runs do 1000 tps on average:
>
>   run 1: 1000, 1000, 1000, 1000, 1000, 1000, 1000, 1000, 1000, 1000
>   run 2: 500, 1500, 500, 1500, 500, 1500, 500, 1500, 500, 1500
>   run 3: 0, 2000, 0, 2000, 0, 2000, 0, 2000, 0, 2000
>

Generally, such behaviours are seen due to writes.  Are WAL and DATA
on same disk in your tests?


[1] - https://www.postgresql.org/message-id/CAA4eK1J9VxJUnpOiQDf0O%3DZ87QUMbw%3DuGcQr4EaGbHSCibx9yA%40mail.gmail.com


--
With Regards,
Amit Kapila.
EnterpriseDB: http://www.enterprisedb.com
On Mon, Oct 31, 2016 at 7:02 PM, Tomas Vondra
<tomas.vondra@2ndquadrant.com> wrote:
>
> The remaining benchmark with 512 clog buffers completed, and the impact
> roughly matches Dilip's benchmark - that is, increasing the number of clog
> buffers eliminates all positive impact of the patches observed on 128
> buffers. Compare these two reports:
>
> [a] http://tvondra.bitbucket.org/#pgbench-3000-logged-sync-noskip-retest
>
> [b] http://tvondra.bitbucket.org/#pgbench-3000-logged-sync-noskip-retest-512
>
> With 128 buffers the group_update and granular_locking patches achieve up to
> 50k tps, while master and no_content_lock do ~30k tps. After increasing
> number of clog buffers, we get only ~30k in all cases.
>
> I'm not sure what's causing this, whether we're hitting limits of the simple
> LRU cache used for clog buffers, or something else.
>

I have also seen previously that increasing clog buffers to 256 can
impact performance negatively.  So, probably here the gains due to
group_update patch is negated due to the impact of increasing clog
buffers.   I am not sure if it is good idea to see the impact of
increasing clog buffers along with this patch.

--
With Regards,
Amit Kapila.
EnterpriseDB: http://www.enterprisedb.com
On 10/31/2016 02:51 PM, Amit Kapila wrote:
> On Mon, Oct 31, 2016 at 12:02 AM, Tomas Vondra
> <tomas.vondra@2ndquadrant.com> wrote:
>> Hi,
>>
>> On 10/27/2016 01:44 PM, Amit Kapila wrote:
>>
>> I've read that analysis, but I'm not sure I see how it explains the "zig
>> zag" behavior. I do understand that shifting the contention to some other
>> (already busy) lock may negatively impact throughput, or that the
>> group_update may result in updating multiple clog pages, but I don't
>> understand two things:
>>
>> (1) Why this should result in the fluctuations we observe in some of the
>> cases. For example, why should we see 150k tps on, 72 clients, then drop to
>> 92k with 108 clients, then back to 130k on 144 clients, then 84k on 180
>> clients etc. That seems fairly strange.
>>
>
> I don't think hitting multiple clog pages has much to do with
> client-count.  However, we can wait to see your further detailed test
> report.
>
>> (2) Why this should affect all three patches, when only group_update has to
>> modify multiple clog pages.
>>
>
> No, all three patches can be affected due to multiple clog pages.
> Read second paragraph ("I think one of the probable reasons that could
> happen for both the approaches") in same e-mail [1].  It is basically
> due to frequent release-and-reacquire of locks.
>
>>
>>
>>>> On logged tables it usually looks like this (i.e. modest increase for
>>>> high
>>>> client counts at the expense of significantly higher variability):
>>>>
>>>>   http://tvondra.bitbucket.org/#pgbench-3000-logged-sync-skip-64
>>>>
>>>
>>> What variability are you referring to in those results?
>>
>>>
>>
>> Good question. What I mean by "variability" is how stable the tps is during
>> the benchmark (when measured on per-second granularity). For example, let's
>> run a 10-second benchmark, measuring number of transactions committed each
>> second.
>>
>> Then all those runs do 1000 tps on average:
>>
>>   run 1: 1000, 1000, 1000, 1000, 1000, 1000, 1000, 1000, 1000, 1000
>>   run 2: 500, 1500, 500, 1500, 500, 1500, 500, 1500, 500, 1500
>>   run 3: 0, 2000, 0, 2000, 0, 2000, 0, 2000, 0, 2000
>>
>
> Generally, such behaviours are seen due to writes. Are WAL and DATA
> on same disk in your tests?
>

Yes, there's one RAID device on 10 SSDs, with 4GB of the controller.
I've done some tests and it easily handles > 1.5GB/s in sequential
writes, and >500MB/s in sustained random writes.

Also, let me point out that most of the tests were done so that the
whole data set fits into shared_buffers, and with no checkpoints during
the runs (so no writes to data files should really happen).

For example these tests were done on scale 3000 (45GB data set) with
64GB shared buffers:

[a]
http://tvondra.bitbucket.org/index2.html#pgbench-3000-unlogged-sync-noskip-64

[b]
http://tvondra.bitbucket.org/index2.html#pgbench-3000-logged-async-noskip-64

and I could show similar cases with scale 300 on 16GB shared buffers.

In those cases, there's very little contention between WAL and the rest
of the data base (in terms of I/O).

And moreover, this setup (single device for the whole cluster) is very
common, we can't just neglect it.

But my main point here really is that the trade-off in those cases may
not be really all that great, because you get the best performance at
36/72 clients, and then the tps drops and variability increases. At
least not right now, before tackling contention on the WAL lock (or
whatever lock becomes the bottleneck).

regards

--
Tomas Vondra                  http://www.2ndQuadrant.com
PostgreSQL Development, 24x7 Support, Remote DBA, Training & Services
On Mon, Oct 31, 2016 at 7:58 PM, Tomas Vondra
<tomas.vondra@2ndquadrant.com> wrote:
> On 10/31/2016 02:51 PM, Amit Kapila wrote:
> And moreover, this setup (single device for the whole cluster) is very
> common, we can't just neglect it.
>
> But my main point here really is that the trade-off in those cases may not
> be really all that great, because you get the best performance at 36/72
> clients, and then the tps drops and variability increases. At least not
> right now, before tackling contention on the WAL lock (or whatever lock
> becomes the bottleneck).
>

Okay, but does wait event results show increase in contention on some
other locks for pgbench-3000-logged-sync-skip-64?  Can you share wait
events for the runs where there is a fluctuation?


--
With Regards,
Amit Kapila.
EnterpriseDB: http://www.enterprisedb.com
On 10/31/2016 08:43 PM, Amit Kapila wrote:
> On Mon, Oct 31, 2016 at 7:58 PM, Tomas Vondra
> <tomas.vondra@2ndquadrant.com> wrote:
>> On 10/31/2016 02:51 PM, Amit Kapila wrote:
>> And moreover, this setup (single device for the whole cluster) is very
>> common, we can't just neglect it.
>>
>> But my main point here really is that the trade-off in those cases may not
>> be really all that great, because you get the best performance at 36/72
>> clients, and then the tps drops and variability increases. At least not
>> right now, before tackling contention on the WAL lock (or whatever lock
>> becomes the bottleneck).
>>
>
> Okay, but does wait event results show increase in contention on some
> other locks for pgbench-3000-logged-sync-skip-64?  Can you share wait
> events for the runs where there is a fluctuation?
>

Sure, I do have wait event stats, including a summary for different
client counts - see this:

http://tvondra.bitbucket.org/by-test/pgbench-3000-logged-sync-skip-64.txt

Looking only at group_update patch for three interesting client counts,
it looks like this:
   wait_event_type |    wait_event     |    108     144      180
-----------------+-------------------+-------------------------  LWLockNamed     | WALWriteLock      | 661284  847057
1006061                  |                   | 126654  191506   265386   Client          | ClientRead        |  37273
52791   64799   LWLockTranche   | wal_insert        |  28394   51893    79932   LWLockNamed     | CLogControlLock   |
7766  14913    23138   LWLockNamed     | WALBufMappingLock |   3615    3739     3803   LWLockNamed     | ProcArrayLock
  |    913    1776     2685   Lock            | extend            |    909    2082     2228   LWLockNamed     |
XidGenLock       |    301     349      675   LWLockTranche   | clog              |    173     331      607
LWLockTranche  | buffer_content    |    163     468      737   LWLockTranche   | lock_manager      |     88     140
145


Compared to master, this shows significant reduction of contention on
CLogControlLock (which on master has 20k, 83k and 200k samples), and
moving the contention to WALWriteLock.

But perhaps you're asking about variability during the benchmark? I
suppose that could be extracted from the collected data, but I haven't
done that.

regards

--
Tomas Vondra                  http://www.2ndQuadrant.com
PostgreSQL Development, 24x7 Support, Remote DBA, Training & Services
On 10/31/2016 02:24 PM, Tomas Vondra wrote:
> On 10/31/2016 05:01 AM, Jim Nasby wrote:
>> On 10/30/16 1:32 PM, Tomas Vondra wrote:
>>>
>>> Now, maybe this has nothing to do with PostgreSQL itself, but maybe it's
>>> some sort of CPU / OS scheduling artifact. For example, the system has
>>> 36 physical cores, 72 virtual ones (thanks to HT). I find it strange
>>> that the "good" client counts are always multiples of 72, while the
>>> "bad" ones fall in between.
>>>
>>>   72 = 72 * 1   (good)
>>>  108 = 72 * 1.5 (bad)
>>>  144 = 72 * 2   (good)
>>>  180 = 72 * 2.5 (bad)
>>>  216 = 72 * 3   (good)
>>>  252 = 72 * 3.5 (bad)
>>>  288 = 72 * 4   (good)
>>>
>>> So maybe this has something to do with how OS schedules the tasks, or
>>> maybe some internal heuristics in the CPU, or something like that.
>>
>> It might be enlightening to run a series of tests that are 72*.1 or *.2
>> apart (say, 72, 79, 86, ..., 137, 144).
>
> Yeah, I've started a benchmark with client a step of 6 clients
>
>     36 42 48 54 60 66 72 78 ... 252 258 264 270 276 282 288
>
> instead of just
>
>     36 72 108 144 180 216 252 288
>
> which did a test every 36 clients. To compensate for the 6x longer runs,
> I'm only running tests for "group-update" and "master", so I should have
> the results in ~36h.
>

So I've been curious and looked at results of the runs executed so far,
and for the group_update patch it looks like this:
  clients  tps -----------------       36  117663       42  139791       48  129331       54  144970       60  124174
   66  137227       72  146064       78  100267       84  141538       90   96607       96  139290      102   93976
108  136421      114   91848      120  133563      126   89801      132  132607      138   87912      144  129688
150  87221      156  129608      162   85403      168  130193      174   83863      180  129337      186   81968
192 128571      198   82053      204  128020      210   80768      216  124153      222   80493      228  125503
234  78950      240  125670      246   78418      252  123532      258   77623      264  124366      270   76726
276 119054      282   76960      288  121819


So, similar saw-like behavior, perfectly periodic. But the really
strange thing is the peaks/valleys don't match those observed before!

That is, during the previous runs, 72, 144, 216 and 288 were "good"
while 108, 180 and 252 were "bad". But in those runs, all those client
counts are "good" ...

Honestly, I have no idea what to think about this ...

regards

--
Tomas Vondra                  http://www.2ndQuadrant.com
PostgreSQL Development, 24x7 Support, Remote DBA, Training & Services
On Mon, Oct 31, 2016 at 5:48 PM, Tomas Vondra
<tomas.vondra@2ndquadrant.com> wrote:
> Honestly, I have no idea what to think about this ...

I think a lot of the details here depend on OS scheduler behavior.
For example, here's one of the first scalability graphs I ever did:

http://rhaas.blogspot.com/2011/09/scalability-in-graphical-form-analyzed.html

It's a nice advertisement for fast-path locking, but look at the funny
shape of the red and green lines between 1 and 32 cores.  The curve is
oddly bowl-shaped.  As the post discusses, we actually dip WAY under
linear scalability in the 8-20 core range and then shoot up like a
rocket afterwards so that at 32 cores we actually achieve super-linear
scalability. You can't blame this on anything except Linux.  Someone
shared BSD graphs (I forget which flavor) with me privately and they
don't exhibit this poor behavior.  (They had different poor behaviors
instead - performance collapsed at high client counts.  That was a
long time ago so it's probably fixed now.)

This is why I think it's fundamentally wrong to look at this patch and
say "well, contention goes down, and in some cases that makes
performance go up, but because in other cases it decreases performance
or increases variability we shouldn't commit it".  If we took that
approach, we wouldn't have fast-path locking today, because the early
versions of fast-path locking could exhibit *major* regressions
precisely because of contention shifting to other locks, specifically
SInvalReadLock and msgNumLock.  (cf. commit
b4fbe392f8ff6ff1a66b488eb7197eef9e1770a4).  If we say that because the
contention on those other locks can get worse as a result of
contention on this lock being reduced, or even worse, if we try to
take responsibility for what effect reducing lock contention might
have on the operating system scheduler discipline (which will
certainly differ from system to system and version to version), we're
never going to get anywhere, because there's almost always going to be
some way that reducing contention in one place can bite you someplace
else.

I also believe it's pretty normal for patches that remove lock
contention to increase variability.  If you run an auto race where
every car has a speed governor installed that limits it to 80 kph,
there will be much less variability in the finish times than if you
remove the governor, but that's a stupid way to run a race.  You won't
get much innovation around increasing the top speed of the cars under
those circumstances, either.  Nobody ever bothered optimizing the
contention around msgNumLock before fast-path locking happened,
because the heavyweight lock manager burdened the system so heavily
that you couldn't generate enough contention on it to matter.
Similarly, we're not going to get much traction around optimizing the
other locks to which contention would shift if we applied this patch
unless we apply it.  This is not theoretical: EnterpriseDB staff have
already done work on trying to optimize WALWriteLock, but it's hard to
get a benefit.  The more contention other contention we eliminate, the
easier it will be to see whether a proposed change to WALWriteLock
helps.  Of course, we'll also be more at the mercy of operating system
scheduler discipline, but that's not all a bad thing either.  The
Linux kernel guys have been known to run PostgreSQL to see whether
proposed changes help or hurt, but they're not going to try those
tests after applying patches that we rejected because they expose us
to existing Linux shortcomings.

I don't want to be perceived as advocating too forcefully for a patch
that was, after all, written by a colleague.  However, I sincerely
believe it's a mistake to say that a patch which reduces lock
contention must show a tangible win or at least no loss on every piece
of hardware, on every kernel, at every client count with no increase
in variability in any configuration.  Very few (if any) patches are
going to be able to meet that bar, and if we make that the bar, people
aren't going to write patches to reduce lock contention in PostgreSQL.
For that to be worth doing, you have to be able to get the patch
committed in finite time.  We've spent an entire release cycle
dithering over this patch.  Several alternative patches have been
written that are not any better (and the people who wrote those
patches don't seem especially interested in doing further work on them
anyway).  There is increasing evidence that the patch is effective at
solving the problem it claims to solve, and that any downsides are
just the result of poor lock-scaling behavior elsewhere which we could
be working on fixing if we weren't still spending time on this.  Is
that really not good enough?

--
Robert Haas
EnterpriseDB: http://www.enterprisedb.com
The Enterprise PostgreSQL Company
On 11/01/2016 08:13 PM, Robert Haas wrote:
> On Mon, Oct 31, 2016 at 5:48 PM, Tomas Vondra
> <tomas.vondra@2ndquadrant.com> wrote:
>> Honestly, I have no idea what to think about this ...
>
> I think a lot of the details here depend on OS scheduler behavior.
> For example, here's one of the first scalability graphs I ever did:
>
> http://rhaas.blogspot.com/2011/09/scalability-in-graphical-form-analyzed.html
>
> It's a nice advertisement for fast-path locking, but look at the funny
> shape of the red and green lines between 1 and 32 cores.  The curve is
> oddly bowl-shaped.  As the post discusses, we actually dip WAY under
> linear scalability in the 8-20 core range and then shoot up like a
> rocket afterwards so that at 32 cores we actually achieve super-linear
> scalability. You can't blame this on anything except Linux.  Someone
> shared BSD graphs (I forget which flavor) with me privately and they
> don't exhibit this poor behavior.  (They had different poor behaviors
> instead - performance collapsed at high client counts.  That was a
> long time ago so it's probably fixed now.)
>
> This is why I think it's fundamentally wrong to look at this patch and
> say "well, contention goes down, and in some cases that makes
> performance go up, but because in other cases it decreases performance
> or increases variability we shouldn't commit it".  If we took that
> approach, we wouldn't have fast-path locking today, because the early
> versions of fast-path locking could exhibit *major* regressions
> precisely because of contention shifting to other locks, specifically
> SInvalReadLock and msgNumLock.  (cf. commit
> b4fbe392f8ff6ff1a66b488eb7197eef9e1770a4).  If we say that because the
> contention on those other locks can get worse as a result of
> contention on this lock being reduced, or even worse, if we try to
> take responsibility for what effect reducing lock contention might
> have on the operating system scheduler discipline (which will
> certainly differ from system to system and version to version), we're
> never going to get anywhere, because there's almost always going to be
> some way that reducing contention in one place can bite you someplace
> else.
>

I don't think I've suggested not committing any of the clog patches (or
other patches in general) because shifting the contention somewhere else
might cause regressions. At the end of the last CF I've however stated
that we need to better understand the impact on various wokloads, and I
think Amit agreed with that conclusion.

We have that understanding now, I believe - also thanks to your idea of
sampling wait events data.

You're right we can't fix all the contention points in one patch, and
that shifting the contention may cause regressions. But we should at
least understand what workloads might be impacted, how serious the
regressions may get etc. Which is why all the testing was done.


> I also believe it's pretty normal for patches that remove lock
> contention to increase variability.  If you run an auto race where
> every car has a speed governor installed that limits it to 80 kph,
> there will be much less variability in the finish times than if you
> remove the governor, but that's a stupid way to run a race.  You won't
> get much innovation around increasing the top speed of the cars under
> those circumstances, either.  Nobody ever bothered optimizing the
> contention around msgNumLock before fast-path locking happened,
> because the heavyweight lock manager burdened the system so heavily
> that you couldn't generate enough contention on it to matter.
> Similarly, we're not going to get much traction around optimizing the
> other locks to which contention would shift if we applied this patch
> unless we apply it.  This is not theoretical: EnterpriseDB staff have
> already done work on trying to optimize WALWriteLock, but it's hard to
> get a benefit.  The more contention other contention we eliminate, the
> easier it will be to see whether a proposed change to WALWriteLock
> helps.

Sure, I understand that. My main worry was that people will get worse
performance with the next major version that what they get now (assuming
we don't manage to address the other contention points). Which is
difficult to explain to users & customers, no matter how reasonable it
seems to us.

The difference is that both the fast-path locks and msgNumLock went into
9.2, so that end users probably never saw that regression. But we don't
know if that happens for clog and WAL.

Perhaps you have a working patch addressing the WAL contention, so that
we could see how that changes the results?

> Of course, we'll also be more at the mercy of operating system
> scheduler discipline, but that's not all a bad thing either.  The
> Linux kernel guys have been known to run PostgreSQL to see whether
> proposed changes help or hurt, but they're not going to try those
> tests after applying patches that we rejected because they expose us
> to existing Linux shortcomings.
>

I might be wrong, but I doubt the kernel guys are running particularly
wide set of tests, so how likely is it they will notice issues with
specific workloads? Wouldn't it be great if we could tell them there's a
bug and provide a workload that reproduces it?

I don't see how "it's a Linux issue" makes it someone else's problem.
The kernel guys can't really test everything (and are not obliged to).
It's up to us to do more testing in this area, and report issues to the
kernel guys (which is not happening as much as it should).
>
> I don't want to be perceived as advocating too forcefully for a
> patch that was, after all, written by a colleague. However, I
> sincerely believe it's a mistake to say that a patch which reduces
> lock contention must show a tangible win or at least no loss on every
> piece of hardware, on every kernel, at every client count with no
> increase in variability in any configuration.>

I don't think anyone suggested that.
>
> Very few (if any) patches are going to be able to meet that bar, and
> if we make that the bar, people aren't going to write patches to
> reduce lock contention in PostgreSQL. For that to be worth doing, you
> have to be able to get the patch committed in finite time. We've
> spent an entire release cycle dithering over this patch. Several
> alternative patches have been written that are not any better (and
> the people who wrote those patches don't seem especially interested
> in doing further work on them anyway). There is increasing evidence
> that the patch is effective at solving the problem it claims to
> solve, and that any downsides are just the result of poor
> lock-scaling behavior elsewhere which we could be working on fixing
> if we weren't still spending time on this. Is that really not good
> enough?
>

Except that a few days ago, after getting results from the last round of
tests, I've stated that we haven't really found any regressions that
would matter, and that group_update seems to be performing the best (and
actually significantly improves results for some of the tests). I
haven't done any code review, though.

The one remaining thing is the strange zig-zag behavior, but that might
easily be a due to scheduling in kernel, or something else. I don't
consider it a blocker for any of the patches, though.


regards

--
Tomas Vondra                  http://www.2ndQuadrant.com
PostgreSQL Development, 24x7 Support, Remote DBA, Training & Services
On Wed, Nov 2, 2016 at 9:01 AM, Tomas Vondra
<tomas.vondra@2ndquadrant.com> wrote:
> On 11/01/2016 08:13 PM, Robert Haas wrote:
>>
>> On Mon, Oct 31, 2016 at 5:48 PM, Tomas Vondra
>> <tomas.vondra@2ndquadrant.com> wrote:
>>>
>
> The one remaining thing is the strange zig-zag behavior, but that might
> easily be a due to scheduling in kernel, or something else. I don't consider
> it a blocker for any of the patches, though.
>

The only reason I could think of for that zig-zag behaviour is
frequent multiple clog page accesses and it could be due to below
reasons:

a. transaction and its subtransactions (IIRC, Dilip's case has one
main transaction and two subtransactions) can't fit into same page, in
which case the group_update optimization won't apply and I don't think
we can do anything for it.
b. In the same group, multiple clog pages are being accessed.  It is
not a likely scenario, but it can happen and we might be able to
improve a bit if that is happening.
c. The transactions at same time tries to update different clog page.
I think as mentioned upthread we can handle it by using slots an
allowing multiple groups to work together instead of a single group.

To check if there is any impact due to (a) or (b), I have added few
logs in code (patch - group_update_clog_v9_log).  The log message
could be "all xacts are not on same page" or  "Group contains
different pages".

Patch group_update_clog_v9_slots tries to address (c). So if there is
any problem due to (c), this patch should improve the situation.

Can you please try to run the test where you saw zig-zag behaviour
with both the patches separately?  I think if there is anything due to
postgres, then you can see either one of the new log message or
performance will be improved, OTOH if we see same behaviour, then I
think we can probably assume it due to scheduler activity and move on.
Also one point to note here is that even when the performance is down
in that curve, it is equal to or better than HEAD.


--
With Regards,
Amit Kapila.
EnterpriseDB: http://www.enterprisedb.com
Вложения
On 11/02/2016 05:52 PM, Amit Kapila wrote:
> On Wed, Nov 2, 2016 at 9:01 AM, Tomas Vondra
> <tomas.vondra@2ndquadrant.com> wrote:
>> On 11/01/2016 08:13 PM, Robert Haas wrote:
>>>
>>> On Mon, Oct 31, 2016 at 5:48 PM, Tomas Vondra
>>> <tomas.vondra@2ndquadrant.com> wrote:
>>>>
>>
>> The one remaining thing is the strange zig-zag behavior, but that might
>> easily be a due to scheduling in kernel, or something else. I don't consider
>> it a blocker for any of the patches, though.
>>
>
> The only reason I could think of for that zig-zag behaviour is
> frequent multiple clog page accesses and it could be due to below
> reasons:
>
> a. transaction and its subtransactions (IIRC, Dilip's case has one
> main transaction and two subtransactions) can't fit into same page, in
> which case the group_update optimization won't apply and I don't think
> we can do anything for it.
> b. In the same group, multiple clog pages are being accessed.  It is
> not a likely scenario, but it can happen and we might be able to
> improve a bit if that is happening.
> c. The transactions at same time tries to update different clog page.
> I think as mentioned upthread we can handle it by using slots an
> allowing multiple groups to work together instead of a single group.
>
> To check if there is any impact due to (a) or (b), I have added few
> logs in code (patch - group_update_clog_v9_log). The log message
> could be "all xacts are not on same page" or "Group contains
> different pages".
>
> Patch group_update_clog_v9_slots tries to address (c). So if there
> is any problem due to (c), this patch should improve the situation.
>
> Can you please try to run the test where you saw zig-zag behaviour
> with both the patches separately? I think if there is anything due
> to postgres, then you can see either one of the new log message or
> performance will be improved, OTOH if we see same behaviour, then I
> think we can probably assume it due to scheduler activity and move
> on. Also one point to note here is that even when the performance is
> down in that curve, it is equal to or better than HEAD.
>

Will do.

Based on the results with more client counts (increment by 6 clients
instead of 36), I think this really looks like something unrelated to
any of the patches - kernel, CPU, or something already present in
current master.

The attached results show that:

(a) master shows the same zig-zag behavior - No idea why this wasn't
observed on the previous runs.

(b) group_update actually seems to improve the situation, because the
performance keeps stable up to 72 clients, while on master the
fluctuation starts way earlier.

I'll redo the tests with a newer kernel - this was on 3.10.x which is
what Red Hat 7.2 uses, I'll try on 4.8.6. Then I'll try with the patches
you submitted, if the 4.8.6 kernel does not help.

Overall, I'm convinced this issue is unrelated to the patches.

regards

--
Tomas Vondra                  http://www.2ndQuadrant.com
PostgreSQL Development, 24x7 Support, Remote DBA, Training & Services
Вложения
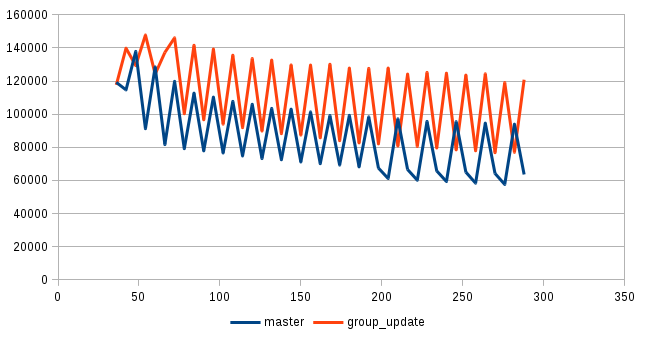
On Tue, Nov 1, 2016 at 11:31 PM, Tomas Vondra
<tomas.vondra@2ndquadrant.com> wrote:
> I don't think I've suggested not committing any of the clog patches (or
> other patches in general) because shifting the contention somewhere else
> might cause regressions. At the end of the last CF I've however stated that
> we need to better understand the impact on various wokloads, and I think
> Amit agreed with that conclusion.
>
> We have that understanding now, I believe - also thanks to your idea of
> sampling wait events data.
>
> You're right we can't fix all the contention points in one patch, and that
> shifting the contention may cause regressions. But we should at least
> understand what workloads might be impacted, how serious the regressions may
> get etc. Which is why all the testing was done.

OK.

> Sure, I understand that. My main worry was that people will get worse
> performance with the next major version that what they get now (assuming we
> don't manage to address the other contention points). Which is difficult to
> explain to users & customers, no matter how reasonable it seems to us.
>
> The difference is that both the fast-path locks and msgNumLock went into
> 9.2, so that end users probably never saw that regression. But we don't know
> if that happens for clog and WAL.
>
> Perhaps you have a working patch addressing the WAL contention, so that we
> could see how that changes the results?

I don't think we do, yet.  Amit or Kuntal might know more.  At some
level I think we're just hitting the limits of the hardware's ability
to lay bytes on a platter, and fine-tuning the locking may not help
much.

> I might be wrong, but I doubt the kernel guys are running particularly wide
> set of tests, so how likely is it they will notice issues with specific
> workloads? Wouldn't it be great if we could tell them there's a bug and
> provide a workload that reproduces it?
>
> I don't see how "it's a Linux issue" makes it someone else's problem. The
> kernel guys can't really test everything (and are not obliged to). It's up
> to us to do more testing in this area, and report issues to the kernel guys
> (which is not happening as much as it should).

I don't exactly disagree with any of that.  I just want to find a
course of action that we can agree on and move forward.  This has been
cooking for a long time, and I want to converge on some resolution.

--
Robert Haas
EnterpriseDB: http://www.enterprisedb.com
The Enterprise PostgreSQL Company
On Thu, Nov 3, 2016 at 8:38 PM, Robert Haas <robertmhaas@gmail.com> wrote:
> On Tue, Nov 1, 2016 at 11:31 PM, Tomas Vondra
>> The difference is that both the fast-path locks and msgNumLock went into
>> 9.2, so that end users probably never saw that regression. But we don't know
>> if that happens for clog and WAL.
>>
>> Perhaps you have a working patch addressing the WAL contention, so that we
>> could see how that changes the results?
>
> I don't think we do, yet.
>

Right.  At this stage, we are just evaluating the ways (basic idea is
to split the OS writes and Flush requests in separate locks) to reduce
it.  It is difficult to speculate results at this stage.  I think
after spending some more time (probably few weeks), we will be in
position to share our findings.

--
With Regards,
Amit Kapila.
EnterpriseDB: http://www.enterprisedb.com
On Thu, Nov 3, 2016 at 8:38 PM, Robert Haas <robertmhaas@gmail.com> wrote:
> On Tue, Nov 1, 2016 at 11:31 PM, Tomas Vondra
>> The difference is that both the fast-path locks and msgNumLock went into
>> 9.2, so that end users probably never saw that regression. But we don't know
>> if that happens for clog and WAL.
>>
>> Perhaps you have a working patch addressing the WAL contention, so that we
>> could see how that changes the results?
>
> I don't think we do, yet.
>
Right. At this stage, we are just evaluating the ways (basic idea is
to split the OS writes and Flush requests in separate locks) to reduce
it. It is difficult to speculate results at this stage. I think
after spending some more time (probably few weeks), we will be in
position to share our findings.
On Mon, Dec 5, 2016 at 6:00 AM, Haribabu Kommi <kommi.haribabu@gmail.com> wrote:
>
>
> On Fri, Nov 4, 2016 at 8:20 PM, Amit Kapila <amit.kapila16@gmail.com> wrote:
>>
>> On Thu, Nov 3, 2016 at 8:38 PM, Robert Haas <robertmhaas@gmail.com> wrote:
>> > On Tue, Nov 1, 2016 at 11:31 PM, Tomas Vondra
>> >> The difference is that both the fast-path locks and msgNumLock went
>> >> into
>> >> 9.2, so that end users probably never saw that regression. But we don't
>> >> know
>> >> if that happens for clog and WAL.
>> >>
>> >> Perhaps you have a working patch addressing the WAL contention, so that
>> >> we
>> >> could see how that changes the results?
>> >
>> > I don't think we do, yet.
>> >
>>
>> Right.  At this stage, we are just evaluating the ways (basic idea is
>> to split the OS writes and Flush requests in separate locks) to reduce
>> it.  It is difficult to speculate results at this stage.  I think
>> after spending some more time (probably few weeks), we will be in
>> position to share our findings.
>>
>
> As per my understanding the current state of the patch is waiting for the
> performance results from author.
>

No, that is not true.  You have quoted the wrong message, that
discussion was about WALWriteLock contention not about the patch being
discussed in this thread.  I have posted the latest set of patches
here [1].  Tomas is supposed to share the results of his tests.  He
mentioned to me in PGConf Asia last week that he ran few tests on
Power Box, so let us wait for him to share his findings.

> Moved to next CF with "waiting on author" status. Please feel free to
> update the status if the current status differs with the actual patch
> status.
>

I think we should keep the status as "Needs Review".

[1] - https://www.postgresql.org/message-id/CAA4eK1JjatUZu0%2BHCi%3D5VM1q-hFgN_OhegPAwEUJqxf-7pESbg%40mail.gmail.com


--
With Regards,
Amit Kapila.
EnterpriseDB: http://www.enterprisedb.com
On Mon, Dec 5, 2016 at 6:00 AM, Haribabu Kommi <kommi.haribabu@gmail.com> wrote:
No, that is not true. You have quoted the wrong message, that
discussion was about WALWriteLock contention not about the patch being
discussed in this thread. I have posted the latest set of patches
here [1]. Tomas is supposed to share the results of his tests. He
mentioned to me in PGConf Asia last week that he ran few tests on
Power Box, so let us wait for him to share his findings.
> Moved to next CF with "waiting on author" status. Please feel free to
> update the status if the current status differs with the actual patch
> status.
>
I think we should keep the status as "Needs Review".
[1] - https://www.postgresql.org/message-id/CAA4eK1JjatUZu0% 2BHCi%3D5VM1q-hFgN_ OhegPAwEUJqxf-7pESbg%40mail. gmail.com
Hi,

> The attached results show that:
>
> (a) master shows the same zig-zag behavior - No idea why this wasn't
> observed on the previous runs.
>
> (b) group_update actually seems to improve the situation, because the
> performance keeps stable up to 72 clients, while on master the
> fluctuation starts way earlier.
>
> I'll redo the tests with a newer kernel - this was on 3.10.x which is
> what Red Hat 7.2 uses, I'll try on 4.8.6. Then I'll try with the patches
> you submitted, if the 4.8.6 kernel does not help.
>
> Overall, I'm convinced this issue is unrelated to the patches.

I've been unable to rerun the tests on this hardware with a newer
kernel, so nothing new on the x86 front.

But as discussed with Amit in Tokyo at pgconf.asia, I got access to a
Power8e machine (IBM 8247-22L to be precise). It's a much smaller
machine compared to the x86 one, though - it only has 24 cores in 2
sockets, 128GB of RAM and less powerful storage, for example.

I've repeated a subset of x86 tests and pushed them to
    https://bitbucket.org/tvondra/power8-results-2

The new results are prefixed with "power-" and I've tried to put them
right next to the "same" x86 tests.

In all cases the patches significantly reduce the contention on
CLogControlLock, just like on x86. Which is good and expected.

Otherwise the results are rather boring - no major regressions compared
to master, and all the patches perform almost exactly the same. Compare
for example this:

* http://tvondra.bitbucket.org/#dilip-300-unlogged-sync

* http://tvondra.bitbucket.org/#power-dilip-300-unlogged-sync

So the results seem much smoother compared to x86, and the performance
difference is roughly 3x, which matches the 24 vs. 72 cores.

For pgbench, the difference is much more significant, though:

* http://tvondra.bitbucket.org/#pgbench-300-unlogged-sync-skip

* http://tvondra.bitbucket.org/#power-pgbench-300-unlogged-sync-skip

So, we're doing ~40k on Power8, but 220k on x86 (which is ~6x more, so
double per-core throughput). My first guess was that this is due to the
x86 machine having better I/O subsystem, so I've reran the tests with
data directory in tmpfs, but that produced almost the same results.

Of course, this observation is unrelated to this patch.

regards

--
Tomas Vondra                  http://www.2ndQuadrant.com
PostgreSQL Development, 24x7 Support, Remote DBA, Training & Services
On Thu, Dec 22, 2016 at 6:59 PM, Tomas Vondra
<tomas.vondra@2ndquadrant.com> wrote:
> Hi,
>
> But as discussed with Amit in Tokyo at pgconf.asia, I got access to a
> Power8e machine (IBM 8247-22L to be precise). It's a much smaller machine
> compared to the x86 one, though - it only has 24 cores in 2 sockets, 128GB
> of RAM and less powerful storage, for example.
>
> I've repeated a subset of x86 tests and pushed them to
>
>     https://bitbucket.org/tvondra/power8-results-2
>
> The new results are prefixed with "power-" and I've tried to put them right
> next to the "same" x86 tests.
>
> In all cases the patches significantly reduce the contention on
> CLogControlLock, just like on x86. Which is good and expected.
>

The results look positive.  Do you think we can conclude based on all
the tests you and Dilip have done, that we can move forward with this
patch (in particular group-update) or do you still want to do more
tests?   I am aware that in one of the tests we have observed that
reducing contention on CLOGControlLock has increased the contention on
WALWriteLock, but I feel we can leave that point as a note to
committer and let him take a final call.  From the code perspective
already Robert and Andres have taken one pass of review and I have
addressed all their comments, so surely more review of code can help,
but I think that is not a big deal considering patch size is
relatively small.


--
With Regards,
Amit Kapila.
EnterpriseDB: http://www.enterprisedb.com
On 12/23/2016 03:58 AM, Amit Kapila wrote:
> On Thu, Dec 22, 2016 at 6:59 PM, Tomas Vondra
> <tomas.vondra@2ndquadrant.com> wrote:
>> Hi,
>>
>> But as discussed with Amit in Tokyo at pgconf.asia, I got access to a
>> Power8e machine (IBM 8247-22L to be precise). It's a much smaller machine
>> compared to the x86 one, though - it only has 24 cores in 2 sockets, 128GB
>> of RAM and less powerful storage, for example.
>>
>> I've repeated a subset of x86 tests and pushed them to
>>
>>     https://bitbucket.org/tvondra/power8-results-2
>>
>> The new results are prefixed with "power-" and I've tried to put them right
>> next to the "same" x86 tests.
>>
>> In all cases the patches significantly reduce the contention on
>> CLogControlLock, just like on x86. Which is good and expected.
>>
>
> The results look positive.  Do you think we can conclude based on all
> the tests you and Dilip have done, that we can move forward with this
> patch (in particular group-update) or do you still want to do more
> tests?   I am aware that in one of the tests we have observed that
> reducing contention on CLOGControlLock has increased the contention on
> WALWriteLock, but I feel we can leave that point as a note to
> committer and let him take a final call.  From the code perspective
> already Robert and Andres have taken one pass of review and I have
> addressed all their comments, so surely more review of code can help,
> but I think that is not a big deal considering patch size is
> relatively small.
>

Yes, I believe that seems like a reasonable conclusion. I've done a few
more tests on the Power machine with data placed on a tmpfs filesystem
(to minimize all the I/O overhead), but the results are the same.

I don't think more testing is needed at this point, at lest not with the
synthetic test cases we've been using for the testing. The patch already
received way more benchmarking than most other patches.

regards

--
Tomas Vondra                  http://www.2ndQuadrant.com
PostgreSQL Development, 24x7 Support, Remote DBA, Training & Services
On Fri, Dec 23, 2016 at 8:28 AM, Amit Kapila <amit.kapila16@gmail.com> wrote:
> The results look positive.  Do you think we can conclude based on all
> the tests you and Dilip have done, that we can move forward with this
> patch (in particular group-update) or do you still want to do more
> tests?   I am aware that in one of the tests we have observed that
> reducing contention on CLOGControlLock has increased the contention on
> WALWriteLock, but I feel we can leave that point as a note to
> committer and let him take a final call.  From the code perspective
> already Robert and Andres have taken one pass of review and I have
> addressed all their comments, so surely more review of code can help,
> but I think that is not a big deal considering patch size is
> relatively small.

I have done one more pass of the review today. I have few comments.

+ if (nextidx != INVALID_PGPROCNO)
+ {
+ /* Sleep until the leader updates our XID status. */
+ for (;;)
+ {
+ /* acts as a read barrier */
+ PGSemaphoreLock(&proc->sem);
+ if (!proc->clogGroupMember)
+ break;
+ extraWaits++;
+ }
+
+ Assert(pg_atomic_read_u32(&proc->clogGroupNext) == INVALID_PGPROCNO);
+
+ /* Fix semaphore count for any absorbed wakeups */
+ while (extraWaits-- > 0)
+ PGSemaphoreUnlock(&proc->sem);
+ return true;
+ }

1. extraWaits is used only locally in this block so I guess we can
declare inside this block only.

2. It seems that we have missed one unlock in case of absorbed
wakeups. You have initialised extraWaits with -1 and if there is one
extra wake up then extraWaits will become 0 (it means we have made one
extra call to PGSemaphoreLock and it's our responsibility to fix it as
the leader will Unlock only once). But it appear in such case we will
not make any call to PGSemaphoreUnlock. Am I missing something?


--
Regards,
Dilip Kumar
EnterpriseDB: http://www.enterprisedb.com
On Thu, Dec 29, 2016 at 10:41 AM, Dilip Kumar <dilipbalaut@gmail.com> wrote:
>
> I have done one more pass of the review today. I have few comments.
>
> + if (nextidx != INVALID_PGPROCNO)
> + {
> + /* Sleep until the leader updates our XID status. */
> + for (;;)
> + {
> + /* acts as a read barrier */
> + PGSemaphoreLock(&proc->sem);
> + if (!proc->clogGroupMember)
> + break;
> + extraWaits++;
> + }
> +
> + Assert(pg_atomic_read_u32(&proc->clogGroupNext) == INVALID_PGPROCNO);
> +
> + /* Fix semaphore count for any absorbed wakeups */
> + while (extraWaits-- > 0)
> + PGSemaphoreUnlock(&proc->sem);
> + return true;
> + }
>
> 1. extraWaits is used only locally in this block so I guess we can
> declare inside this block only.
>

Agreed and changed accordingly.

> 2. It seems that we have missed one unlock in case of absorbed
> wakeups. You have initialised extraWaits with -1 and if there is one
> extra wake up then extraWaits will become 0 (it means we have made one
> extra call to PGSemaphoreLock and it's our responsibility to fix it as
> the leader will Unlock only once). But it appear in such case we will
> not make any call to PGSemaphoreUnlock.
>

Good catch!  I have fixed it by initialising extraWaits to 0.  This
same issue exists from Group clear xid for which I will send a patch
separately.

Apart from above, the patch needs to be adjusted for commit be7b2848
which has changed the definition of PGSemaphore.


--
With Regards,
Amit Kapila.
EnterpriseDB: http://www.enterprisedb.com

--
Sent via pgsql-hackers mailing list (pgsql-hackers@postgresql.org)
To make changes to your subscription:
http://www.postgresql.org/mailpref/pgsql-hackers
Вложения
On Sat, Dec 31, 2016 at 9:01 AM, Amit Kapila <amit.kapila16@gmail.com> wrote:
> Agreed and changed accordingly.
>
>> 2. It seems that we have missed one unlock in case of absorbed
>> wakeups. You have initialised extraWaits with -1 and if there is one
>> extra wake up then extraWaits will become 0 (it means we have made one
>> extra call to PGSemaphoreLock and it's our responsibility to fix it as
>> the leader will Unlock only once). But it appear in such case we will
>> not make any call to PGSemaphoreUnlock.
>>
>
> Good catch!  I have fixed it by initialising extraWaits to 0.  This
> same issue exists from Group clear xid for which I will send a patch
> separately.
>
> Apart from above, the patch needs to be adjusted for commit be7b2848
> which has changed the definition of PGSemaphore.

I have reviewed the latest patch and I don't have any more comments.
So if there is no objection from other reviewers I can move it to
"Ready For Committer"?


I have performed one more test, with 3000 scale factor because
previously I tested only up to 1000 scale factor. The purpose of this
test is to check whether there is any regression at higher scale
factor.

Machine: Intel 8 socket machine.
Scale Factor: 3000
Shared Buffer: 8GB
Test: Pgbench RW test.
Run: 30 mins median of 3

Other modified GUC:
-N 300 -c min_wal_size=15GB -c max_wal_size=20GB -c
checkpoint_timeout=900 -c maintenance_work_mem=1GB -c
checkpoint_completion_target=0.9

Summary:
- Did not observed any regression.
- The performance gain is in sync with what we have observed with
other tests at lower scale factors.


Sync_Commit_Off:
client      Head     Patch

8             10065   10009
16           18487   18826
32           28167   28057
64           26655   28712
128         20152   24917
256         16740   22891

Sync_Commit_On:

Client       Head     Patch

8             5102       5110
16           8087       8282
32         12523     12548
64         14701     15112
128       14656      15238
256       13421      16424

--
Regards,
Dilip Kumar
EnterpriseDB: http://www.enterprisedb.com
On Wed, Jan 11, 2017 at 10:55 AM, Dilip Kumar <dilipbalaut@gmail.com> wrote:
> I have reviewed the latest patch and I don't have any more comments.
> So if there is no objection from other reviewers I can move it to
> "Ready For Committer"?

Seeing no objections, I have moved it to Ready For Committer.


--
Regards,
Dilip Kumar
EnterpriseDB: http://www.enterprisedb.com
On Tue, Jan 17, 2017 at 11:39 AM, Dilip Kumar <dilipbalaut@gmail.com> wrote:
> On Wed, Jan 11, 2017 at 10:55 AM, Dilip Kumar <dilipbalaut@gmail.com> wrote:
>> I have reviewed the latest patch and I don't have any more comments.
>> So if there is no objection from other reviewers I can move it to
>> "Ready For Committer"?
>
> Seeing no objections, I have moved it to Ready For Committer.
>

Thanks for the review.

--
With Regards,
Amit Kapila.
EnterpriseDB: http://www.enterprisedb.com
On Tue, Jan 17, 2017 at 9:18 PM, Amit Kapila <amit.kapila16@gmail.com> wrote:
> On Tue, Jan 17, 2017 at 11:39 AM, Dilip Kumar <dilipbalaut@gmail.com> wrote:
>> On Wed, Jan 11, 2017 at 10:55 AM, Dilip Kumar <dilipbalaut@gmail.com> wrote:
>>> I have reviewed the latest patch and I don't have any more comments.
>>> So if there is no objection from other reviewers I can move it to
>>> "Ready For Committer"?
>>
>> Seeing no objections, I have moved it to Ready For Committer.
>>
>
> Thanks for the review.

Moved to CF 2017-03, the 8th commit fest of this patch.
--
Michael
On Tue, Jan 31, 2017 at 11:35 PM, Michael Paquier
<michael.paquier@gmail.com> wrote:
>> Thanks for the review.
>
> Moved to CF 2017-03, the 8th commit fest of this patch.

I think eight is enough.  Committed with some cosmetic changes.

I think the turning point for this somewhat-troubled patch was when we
realized that, while results were somewhat mixed on whether it
improved performance, wait event monitoring showed that it definitely
reduced contention significantly.  However, I just realized that in
both this case and in the case of group XID clearing, we weren't
advertising a wait event for the PGSemaphoreLock calls that are part
of the group locking machinery.  I think we should fix that, because a
quick test shows that can happen fairly often -- not, I think, as
often as we would have seen LWLock waits without these patches, but
often enough that you'll want to know.  Patch attached.

--
Robert Haas
EnterpriseDB: http://www.enterprisedb.com
The Enterprise PostgreSQL Company

--
Sent via pgsql-hackers mailing list (pgsql-hackers@postgresql.org)
To make changes to your subscription:
http://www.postgresql.org/mailpref/pgsql-hackers
Вложения
Robert Haas <robertmhaas@gmail.com> writes:
> I think eight is enough.  Committed with some cosmetic changes.

Buildfarm thinks eight wasn't enough.

https://buildfarm.postgresql.org/cgi-bin/show_log.pl?nm=clam&dt=2017-03-10%2002%3A00%3A01
        regards, tom lane
On Fri, Mar 10, 2017 at 7:47 AM, Tom Lane <tgl@sss.pgh.pa.us> wrote:
> Robert Haas <robertmhaas@gmail.com> writes:
>> I think eight is enough.  Committed with some cosmetic changes.
>
> Buildfarm thinks eight wasn't enough.
>
> https://buildfarm.postgresql.org/cgi-bin/show_log.pl?nm=clam&dt=2017-03-10%2002%3A00%3A01
>

Will look into this, though I don't have access to that machine, but
it looks to be a power machine and I have access to somewhat similar
machine.

--
With Regards,
Amit Kapila.
EnterpriseDB: http://www.enterprisedb.com
On Thu, Mar 9, 2017 at 9:17 PM, Tom Lane <tgl@sss.pgh.pa.us> wrote:
> Robert Haas <robertmhaas@gmail.com> writes:
>> I think eight is enough.  Committed with some cosmetic changes.
>
> Buildfarm thinks eight wasn't enough.
>
> https://buildfarm.postgresql.org/cgi-bin/show_log.pl?nm=clam&dt=2017-03-10%2002%3A00%3A01

At first I was confused how you knew that this was the fault of this
patch, but this seems like a pretty indicator:

TRAP: FailedAssertion("!(curval == 0 || (curval == 0x03 && status !=
0x00) || curval == status)", File: "clog.c", Line: 574)

I'm not sure whether it's related to this problem or not, but now that
I look at it, this (preexisting) comment looks like entirely wishful
thinking:
    * If we update more than one xid on this page while it is being written    * out, we might find that some of the
bitsgo to disk and others don't.    * If we are updating commits on the page with the top-level xid that    * could
breakatomicity, so we subcommit the subxids first before we mark    * the top-level commit.


The problem with that is the word "before".  There are no memory
barriers here, so there's zero guarantee that other processes see the
writes in the order they're performed here.  But it might be a stretch
to suppose that that would cause this symptom.

Maybe we should replace that Assert() with an elog() and dump out the
actual values.

--
Robert Haas
EnterpriseDB: http://www.enterprisedb.com
The Enterprise PostgreSQL Company
Robert Haas <robertmhaas@gmail.com> writes:
> On Thu, Mar 9, 2017 at 9:17 PM, Tom Lane <tgl@sss.pgh.pa.us> wrote:
>> Buildfarm thinks eight wasn't enough.
>> https://buildfarm.postgresql.org/cgi-bin/show_log.pl?nm=clam&dt=2017-03-10%2002%3A00%3A01

> At first I was confused how you knew that this was the fault of this
> patch, but this seems like a pretty indicator:
> TRAP: FailedAssertion("!(curval == 0 || (curval == 0x03 && status !=
> 0x00) || curval == status)", File: "clog.c", Line: 574)

Yeah, that's what led me to blame the clog-group-update patch.

> I'm not sure whether it's related to this problem or not, but now that
> I look at it, this (preexisting) comment looks like entirely wishful
> thinking:
>      * If we update more than one xid on this page while it is being written
>      * out, we might find that some of the bits go to disk and others don't.
>      * If we are updating commits on the page with the top-level xid that
>      * could break atomicity, so we subcommit the subxids first before we mark
>      * the top-level commit.

Maybe, but that comment dates to 2008 according to git, and clam has
been, er, happy as a clam up to now.  My money is on a newly-introduced
memory-access-ordering bug.

Also, I see clam reported in green just now, so it's not 100%
reproducible :-(
        regards, tom lane
On Fri, Mar 10, 2017 at 10:51 AM, Tom Lane <tgl@sss.pgh.pa.us> wrote:
> Robert Haas <robertmhaas@gmail.com> writes:
>> On Thu, Mar 9, 2017 at 9:17 PM, Tom Lane <tgl@sss.pgh.pa.us> wrote:
>>> Buildfarm thinks eight wasn't enough.
>>> https://buildfarm.postgresql.org/cgi-bin/show_log.pl?nm=clam&dt=2017-03-10%2002%3A00%3A01
>
>> At first I was confused how you knew that this was the fault of this
>> patch, but this seems like a pretty indicator:
>> TRAP: FailedAssertion("!(curval == 0 || (curval == 0x03 && status !=
>> 0x00) || curval == status)", File: "clog.c", Line: 574)
>
> Yeah, that's what led me to blame the clog-group-update patch.
>
>> I'm not sure whether it's related to this problem or not, but now that
>> I look at it, this (preexisting) comment looks like entirely wishful
>> thinking:
>>      * If we update more than one xid on this page while it is being written
>>      * out, we might find that some of the bits go to disk and others don't.
>>      * If we are updating commits on the page with the top-level xid that
>>      * could break atomicity, so we subcommit the subxids first before we mark
>>      * the top-level commit.
>
> Maybe, but that comment dates to 2008 according to git, and clam has
> been, er, happy as a clam up to now.  My money is on a newly-introduced
> memory-access-ordering bug.
>
> Also, I see clam reported in green just now, so it's not 100%
> reproducible :-(
>

Just to let you know that I think I have figured out the reason of
failure.  If we run the regressions with attached patch, it will make
the regression tests fail consistently in same way.  The patch just
makes all transaction status updates to go via group clog update
mechanism.  Now, the reason of the problem is that the patch has
relied on XidCache in PGPROC for subtransactions when they are not
overflowed which is okay for Commits, but not for Rollback to
Savepoint and Rollback.  For Rollback to Savepoint, we just pass the
particular (sub)-transaction id to abort, but group mechanism will
abort all the sub-transactions in that top transaction to Rollback.  I
am still analysing what could be the best way to fix this issue.  I
think there could be multiple ways to fix this problem.  One way is
that we can advertise the fact that the status update for transaction
involves subtransactions and then we can use xidcache for actually
processing the status update.  Second is advertise all the
subtransaction ids for which status needs to be update, but I am sure
that is not-at all efficient as that will cosume lot of memory.  Last
resort could be that we don't use group clog update optimization when
transaction has sub-transactions.

--
With Regards,
Amit Kapila.
EnterpriseDB: http://www.enterprisedb.com

--
Sent via pgsql-hackers mailing list (pgsql-hackers@postgresql.org)
To make changes to your subscription:
http://www.postgresql.org/mailpref/pgsql-hackers
Вложения
Amit Kapila <amit.kapila16@gmail.com> writes:
> Just to let you know that I think I have figured out the reason of
> failure.  If we run the regressions with attached patch, it will make
> the regression tests fail consistently in same way.  The patch just
> makes all transaction status updates to go via group clog update
> mechanism.

This does *not* give me a warm fuzzy feeling that this patch was
ready to commit.  Or even that it was tested to the claimed degree.
        regards, tom lane
On Fri, Mar 10, 2017 at 11:43 AM, Amit Kapila <amit.kapila16@gmail.com> wrote:
> On Fri, Mar 10, 2017 at 10:51 AM, Tom Lane <tgl@sss.pgh.pa.us> wrote:
>>
>> Also, I see clam reported in green just now, so it's not 100%
>> reproducible :-(
>>
>
> Just to let you know that I think I have figured out the reason of
> failure.  If we run the regressions with attached patch, it will make
> the regression tests fail consistently in same way.  The patch just
> makes all transaction status updates to go via group clog update
> mechanism.  Now, the reason of the problem is that the patch has
> relied on XidCache in PGPROC for subtransactions when they are not
> overflowed which is okay for Commits, but not for Rollback to
> Savepoint and Rollback.  For Rollback to Savepoint, we just pass the
> particular (sub)-transaction id to abort, but group mechanism will
> abort all the sub-transactions in that top transaction to Rollback.  I
> am still analysing what could be the best way to fix this issue.  I
> think there could be multiple ways to fix this problem.  One way is
> that we can advertise the fact that the status update for transaction
> involves subtransactions and then we can use xidcache for actually
> processing the status update.  Second is advertise all the
> subtransaction ids for which status needs to be update, but I am sure
> that is not-at all efficient as that will cosume lot of memory.  Last
> resort could be that we don't use group clog update optimization when
> transaction has sub-transactions.
>

On further analysis, I don't think the first way mentioned above can
work for Rollback To Savepoint because it can pass just a subset of
sub-tranasctions in which case we can never identify it by looking at
subxids in PGPROC unless we advertise all such subxids.  The case I am
talking is something like:

Begin;
Savepoint one;
Insert ...
Savepoint two
Insert ..
Savepoint three
Insert ...
Rollback to Savepoint two;

Now, for Rollback to Savepoint two, we pass transaction ids
corresponding to Savepoint three and two.

So, I think we can apply this optimization only for transactions that
always commits which will anyway be the most common use case.  Another
alternative as mentioned above is to do this optimization when there
are no subtransactions involved.  Attached two patches implements
these two approaches (fix_clog_group_commit_opt_v1.patch - allow
optimization only for commits; fix_clog_group_commit_opt_v2.patch -
allow optimizations for transaction status updates that don't involve
subxids).  I think the first approach is a better way to deal with
this, let me know your thoughts?


--
With Regards,
Amit Kapila.
EnterpriseDB: http://www.enterprisedb.com

--
Sent via pgsql-hackers mailing list (pgsql-hackers@postgresql.org)
To make changes to your subscription:
http://www.postgresql.org/mailpref/pgsql-hackers
Вложения
On Fri, Mar 10, 2017 at 11:51 AM, Tom Lane <tgl@sss.pgh.pa.us> wrote:
> Amit Kapila <amit.kapila16@gmail.com> writes:
>> Just to let you know that I think I have figured out the reason of
>> failure.  If we run the regressions with attached patch, it will make
>> the regression tests fail consistently in same way.  The patch just
>> makes all transaction status updates to go via group clog update
>> mechanism.
>
> This does *not* give me a warm fuzzy feeling that this patch was
> ready to commit.  Or even that it was tested to the claimed degree.
>

I think this is more of an implementation detail missed by me.  We
have done quite some performance/stress testing with a different
number of savepoints, but this could have been caught only by having
Rollback to Savepoint followed by a commit.  I agree that we could
have devised some simple way (like the one I shared above) to test the
wide range of tests with this new mechanism earlier.  This is a
learning from here and I will try to be more cautious about such
things in future.

--
With Regards,
Amit Kapila.
EnterpriseDB: http://www.enterprisedb.com
On Fri, Mar 10, 2017 at 6:25 AM, Amit Kapila <amit.kapila16@gmail.com> wrote:
> On Fri, Mar 10, 2017 at 11:51 AM, Tom Lane <tgl@sss.pgh.pa.us> wrote:
>> Amit Kapila <amit.kapila16@gmail.com> writes:
>>> Just to let you know that I think I have figured out the reason of
>>> failure.  If we run the regressions with attached patch, it will make
>>> the regression tests fail consistently in same way.  The patch just
>>> makes all transaction status updates to go via group clog update
>>> mechanism.
>>
>> This does *not* give me a warm fuzzy feeling that this patch was
>> ready to commit.  Or even that it was tested to the claimed degree.
>>
>
> I think this is more of an implementation detail missed by me.  We
> have done quite some performance/stress testing with a different
> number of savepoints, but this could have been caught only by having
> Rollback to Savepoint followed by a commit.  I agree that we could
> have devised some simple way (like the one I shared above) to test the
> wide range of tests with this new mechanism earlier.  This is a
> learning from here and I will try to be more cautious about such
> things in future.

After some study, I don't feel confident that it's this simple.  The
underlying issue here is that TransactionGroupUpdateXidStatus thinks
it can assume that proc->clogGroupMemberXid, pgxact->nxids, and
proc->subxids.xids match the values that were passed to
TransactionIdSetPageStatus, but that's not checked anywhere.  For
example, I thought about adding these assertions:
      Assert(nsubxids == MyPgXact->nxids);      Assert(memcmp(subxids, MyProc->subxids.xids,             nsubxids *
sizeof(TransactionId))== 0);


There's not even a comment in the patch anywhere that notes that we're
assuming this, let alone anything that checks that it's actually true,
which seems worrying.

One thing that seems off is that we have this new field
clogGroupMemberXid, which we use to determine the XID that is being
committed, but for the subxids we think it's going to be true in every
case.   Well, that seems a bit odd, right?  I mean, if the contents of
the PGXACT are a valid way to figure out the subxids that we need to
worry about, then why not also it to get the toplevel XID?

Another point that's kind of bothering me is that this whole approach
now seems to me to be an abstraction violation.  It relies on the set
of subxids for which we're setting status in clog matching the set of
subxids advertised in PGPROC.  But actually there's a fair amount of
separation between those things.  What's getting passed down to clog
is coming from xact.c's transaction state stack, which is completely
separate from the procarray.  Now after going over the logic in some
detail, it does look to me that you're correct that in the case of a
toplevel commit they will always match, but in some sense that looks
accidental.

For example, look at this code from RecordTransactionAbort:
   /*    * If we're aborting a subtransaction, we can immediately remove failed    * XIDs from PGPROC's cache of
runningchild XIDs.  We do that here for    * subxacts, because we already have the child XID array at hand.  For    *
mainxacts, the equivalent happens just after this function returns.    */   if (isSubXact)
XidCacheRemoveRunningXids(xid,nchildren, children, latestXid);


That code paints the removal of the aborted subxids from our PGPROC as
an optimization, not a requirement for correctness.  And without this
patch, that's correct: the XIDs are advertised in PGPROC so that we
construct correct snapshots, but they only need to be present there
for so long as there is a possibility that those XIDs might in the
future commit.  Once they've aborted, it's not *necessary* for them to
appear in PGPROC any more, but it doesn't hurt anything if they do.
However, with this patch, removing them from PGPROC becomes a hard
requirement, because otherwise the set of XIDs that are running
according to the transaction state stack and the set that are running
according to the PGPROC might be different.  Yet, neither the original
patch nor your proposed fix patch updated any of the comments here.

One might wonder whether it's even wise to tie these things together
too closely.  For example, you can imagine a future patch for
autonomous transactions stashing their XIDs in the subxids array.
That'd be fine for snapshot purposes, but it would break this.

Finally, I had an unexplained hang during the TAP tests while testing
out your fix patch.  I haven't been able to reproduce that so it
might've just been an artifact of something stupid I did, or of some
unrelated bug, but I think it's best to back up and reconsider a bit
here.

--
Robert Haas
EnterpriseDB: http://www.enterprisedb.com
The Enterprise PostgreSQL Company
On Fri, Mar 10, 2017 at 3:40 PM, Robert Haas <robertmhaas@gmail.com> wrote:
> Finally, I had an unexplained hang during the TAP tests while testing
> out your fix patch.  I haven't been able to reproduce that so it
> might've just been an artifact of something stupid I did, or of some
> unrelated bug, but I think it's best to back up and reconsider a bit
> here.

I was able to reproduce this with the following patch:

diff --git a/src/backend/access/transam/clog.c
b/src/backend/access/transam/clog.c
index bff42dc..0546425 100644
--- a/src/backend/access/transam/clog.c
+++ b/src/backend/access/transam/clog.c
@@ -268,9 +268,11 @@ set_status_by_pages(int nsubxids, TransactionId *subxids, * has a race condition (see
TransactionGroupUpdateXidStatus)but the * worst thing that happens if we mess up is a small loss of efficiency; * the
intentis to avoid having the leader access pages it wouldn't

- * otherwise need to touch.  Finally, we skip it for prepared transactions,
- * which don't have the semaphore we would need for this optimization,
- * and which are anyway probably not all that common.
+ * otherwise need to touch.  We also skip it if the transaction status is
+ * other than commit, because for rollback and rollback to savepoint, the
+ * list of subxids won't be same as subxids array in PGPROC.  Finally, we skip
+ * it for prepared transactions, which don't have the semaphore we would need
+ * for this optimization, and which are anyway probably not all that common. */static
voidTransactionIdSetPageStatus(TransactionIdxid, int nsubxids,

@@ -280,15 +282,20 @@ TransactionIdSetPageStatus(TransactionId xid,
int nsubxids,{    if (all_xact_same_page &&        nsubxids < PGPROC_MAX_CACHED_SUBXIDS &&
+        status == TRANSACTION_STATUS_COMMITTED &&        !IsGXactActive())    {
+        Assert(nsubxids == MyPgXact->nxids);
+        Assert(memcmp(subxids, MyProc->subxids.xids,
+               nsubxids * sizeof(TransactionId)) == 0);
+        /*         * If we can immediately acquire CLogControlLock, we update the status         * of our own XID and
releasethe lock.  If not, try use group XID         * update.  If that doesn't work out, fall back to waiting for the
     * lock to perform an update for this transaction only.         */

-        if (LWLockConditionalAcquire(CLogControlLock, LW_EXCLUSIVE))
+        if (false && LWLockConditionalAcquire(CLogControlLock, LW_EXCLUSIVE))        {
TransactionIdSetPageStatusInternal(xid,nsubxids,

subxids, status, lsn, pageno);            LWLockRelease(CLogControlLock);

make check-world hung here:

t/009_twophase.pl ..........
1..13
ok 1 - Commit prepared transaction after restart
ok 2 - Rollback prepared transaction after restart

[rhaas pgsql]$ ps uxww | grep postgres
rhaas 72255   0.0  0.0  2447996   1684 s000  S+    3:40PM   0:00.00
/Users/rhaas/pgsql/tmp_install/Users/rhaas/install/dev/bin/psql -XAtq
-d port=64230 host=/var/folders/y8/r2ycj_jj2vd65v71rmyddpr40000gn/T/ZVWy0JGbuw
dbname='postgres' -f - -v ON_ERROR_STOP=1
rhaas 72253   0.0  0.0  2478532   1548   ??  Ss    3:40PM   0:00.00
postgres: bgworker: logical replication launcher
rhaas 72252   0.0  0.0  2483132    740   ??  Ss    3:40PM   0:00.05
postgres: stats collector process
rhaas 72251   0.0  0.0  2486724   1952   ??  Ss    3:40PM   0:00.02
postgres: autovacuum launcher process
rhaas 72250   0.0  0.0  2477508    880   ??  Ss    3:40PM   0:00.03
postgres: wal writer process
rhaas 72249   0.0  0.0  2477508    972   ??  Ss    3:40PM   0:00.03
postgres: writer process
rhaas 72248   0.0  0.0  2477508   1252   ??  Ss    3:40PM   0:00.00
postgres: checkpointer process
rhaas 72246   0.0  0.0  2481604   5076 s000  S+    3:40PM   0:00.03
/Users/rhaas/pgsql/tmp_install/Users/rhaas/install/dev/bin/postgres -D
/Users/rhaas/pgsql/src/test/recovery/tmp_check/data_master_Ylq1/pgdata
rhaas 72337   0.0  0.0  2433796    688 s002  S+    4:14PM   0:00.00
grep postgres
rhaas 72256   0.0  0.0  2478920   2984   ??  Ss    3:40PM   0:00.00
postgres: rhaas postgres [local] COMMIT PREPARED waiting for 0/301D0D0

Backtrace of PID 72256:

#0  0x00007fff8ecc85c2 in poll ()
#1  0x00000001078eb727 in WaitEventSetWaitBlock [inlined] () at
/Users/rhaas/pgsql/src/backend/storage/ipc/latch.c:1118
#2  0x00000001078eb727 in WaitEventSetWait (set=0x7fab3c8366c8,
timeout=-1, occurred_events=0x7fff585e5410, nevents=1,
wait_event_info=<value temporarily unavailable, due to optimizations>)
at latch.c:949
#3  0x00000001078eb409 in WaitLatchOrSocket (latch=<value temporarily
unavailable, due to optimizations>, wakeEvents=<value temporarily
unavailable, due to optimizations>, sock=-1, timeout=<value
temporarily unavailable, due to optimizations>,
wait_event_info=134217741) at latch.c:349
#4  0x00000001078cf077 in SyncRepWaitForLSN (lsn=<value temporarily
unavailable, due to optimizations>, commit=<value temporarily
unavailable, due to optimizations>) at syncrep.c:284
#5  0x00000001076a2dab in FinishPreparedTransaction (gid=<value
temporarily unavailable, due to optimizations>, isCommit=1 '\001') at
twophase.c:2110
#6  0x0000000107919420 in standard_ProcessUtility (pstmt=<value
temporarily unavailable, due to optimizations>, queryString=<value
temporarily unavailable, due to optimizations>,
context=PROCESS_UTILITY_TOPLEVEL, params=0x0, dest=0x7fab3c853cf8,
completionTag=<value temporarily unavailable, due to optimizations>)
at utility.c:452
#7  0x00000001079186f3 in PortalRunUtility (portal=0x7fab3c874a40,
pstmt=0x7fab3c853c00, isTopLevel=1 '\001', setHoldSnapshot=<value
temporarily unavailable, due to optimizations>, dest=0x7fab3c853cf8,
completionTag=0x7fab3c8366f8 "\n") at pquery.c:1165
#8  0x0000000107917cd6 in PortalRunMulti (portal=<value temporarily
unavailable, due to optimizations>, isTopLevel=1 '\001',
setHoldSnapshot=0 '\0', dest=0x7fab3c853cf8, altdest=0x7fab3c853cf8,
completionTag=<value temporarily unavailable, due to optimizations>)
at pquery.c:1315
#9  0x0000000107917634 in PortalRun (portal=0x7fab3c874a40,
count=9223372036854775807, isTopLevel=1 '\001', dest=0x7fab3c853cf8,
altdest=0x7fab3c853cf8, completionTag=0x7fff585e5a30 "") at
pquery.c:788
#10 0x000000010791586b in PostgresMain (argc=<value temporarily
unavailable, due to optimizations>, argv=<value temporarily
unavailable, due to optimizations>, dbname=<value temporarily
unavailable, due to optimizations>, username=<value temporarily
unavailable, due to optimizations>) at postgres.c:1101
#11 0x0000000107897a68 in PostmasterMain (argc=<value temporarily
unavailable, due to optimizations>, argv=<value temporarily
unavailable, due to optimizations>) at postmaster.c:4317
#12 0x00000001078124cd in main (argc=<value temporarily unavailable,
due to optimizations>, argv=<value temporarily unavailable, due to
optimizations>) at main.c:228

debug_query_string is COMMIT PREPARED 'xact_009_1'

end of regress_log_009_twophase looks like this:

ok 2 - Rollback prepared transaction after restart
### Stopping node "master" using mode immediate
# Running: pg_ctl -D
/Users/rhaas/pgsql/src/test/recovery/tmp_check/data_master_Ylq1/pgdata
-m immediate stop
waiting for server to shut down.... done
server stopped
# No postmaster PID
### Starting node "master"
# Running: pg_ctl -D
/Users/rhaas/pgsql/src/test/recovery/tmp_check/data_master_Ylq1/pgdata
-l /Users/rhaas/pgsql/src/test/recovery/tmp_check/log/009_twophase_master.log
start
waiting for server to start.... done
server started
# Postmaster PID for node "master" is 72246

The smoking gun was in 009_twophase_slave.log:

TRAP: FailedAssertion("!(nsubxids == MyPgXact->nxids)", File:
"clog.c", Line: 288)

...and then the node shuts down, which is why this hangs forever.
(Also... what's up with it hanging forever instead of timing out or
failing or something?)

So evidently on a standby it is in fact possible for the procarray
contents not to match what got passed down to clog.  Now you might say
"well, we shouldn't be using group update on a standby anyway", but
it's possible for a hot standby backend to hold a shared lock on
CLogControlLock, and then the startup process would be pushed into the
group-update path and - boom.

Anyway, this is surely fixable, but I think it's another piece of
evidence that the assumption that the transaction status stack will
match the procarray is fairly fragile.

--
Robert Haas
EnterpriseDB: http://www.enterprisedb.com
The Enterprise PostgreSQL Company
Robert Haas wrote:

> The smoking gun was in 009_twophase_slave.log:
>
> TRAP: FailedAssertion("!(nsubxids == MyPgXact->nxids)", File:
> "clog.c", Line: 288)
>
> ...and then the node shuts down, which is why this hangs forever.
> (Also... what's up with it hanging forever instead of timing out or
> failing or something?)

This bit my while messing with 2PC tests recently.  I think it'd be
worth doing something about this, such as causing the test to die if we
request a server to (re)start and it doesn't start or it immediately
crashes.  This doesn't solve the problem of a server crashing at a point
not immediately after start, though.

(It'd be very annoying to have to sprinkle the Perl test code with
"assert $server->islive", but perhaps we can add assertions of some kind
in PostgresNode itself).

--
Álvaro Herrera                https://www.2ndQuadrant.com/
PostgreSQL Development, 24x7 Support, Remote DBA, Training & Services
On Sat, Mar 11, 2017 at 2:10 AM, Robert Haas <robertmhaas@gmail.com> wrote:
> On Fri, Mar 10, 2017 at 6:25 AM, Amit Kapila <amit.kapila16@gmail.com> wrote:
>> On Fri, Mar 10, 2017 at 11:51 AM, Tom Lane <tgl@sss.pgh.pa.us> wrote:
>>> Amit Kapila <amit.kapila16@gmail.com> writes:
>>>> Just to let you know that I think I have figured out the reason of
>>>> failure.  If we run the regressions with attached patch, it will make
>>>> the regression tests fail consistently in same way.  The patch just
>>>> makes all transaction status updates to go via group clog update
>>>> mechanism.
>>>
>>> This does *not* give me a warm fuzzy feeling that this patch was
>>> ready to commit.  Or even that it was tested to the claimed degree.
>>>
>>
>> I think this is more of an implementation detail missed by me.  We
>> have done quite some performance/stress testing with a different
>> number of savepoints, but this could have been caught only by having
>> Rollback to Savepoint followed by a commit.  I agree that we could
>> have devised some simple way (like the one I shared above) to test the
>> wide range of tests with this new mechanism earlier.  This is a
>> learning from here and I will try to be more cautious about such
>> things in future.
>
> After some study, I don't feel confident that it's this simple.  The
> underlying issue here is that TransactionGroupUpdateXidStatus thinks
> it can assume that proc->clogGroupMemberXid, pgxact->nxids, and
> proc->subxids.xids match the values that were passed to
> TransactionIdSetPageStatus, but that's not checked anywhere.  For
> example, I thought about adding these assertions:
>
>        Assert(nsubxids == MyPgXact->nxids);
>        Assert(memcmp(subxids, MyProc->subxids.xids,
>               nsubxids * sizeof(TransactionId)) == 0);
>
> There's not even a comment in the patch anywhere that notes that we're
> assuming this, let alone anything that checks that it's actually true,
> which seems worrying.
>
> One thing that seems off is that we have this new field
> clogGroupMemberXid, which we use to determine the XID that is being
> committed, but for the subxids we think it's going to be true in every
> case.   Well, that seems a bit odd, right?  I mean, if the contents of
> the PGXACT are a valid way to figure out the subxids that we need to
> worry about, then why not also it to get the toplevel XID?
>
> Another point that's kind of bothering me is that this whole approach
> now seems to me to be an abstraction violation.  It relies on the set
> of subxids for which we're setting status in clog matching the set of
> subxids advertised in PGPROC.  But actually there's a fair amount of
> separation between those things.  What's getting passed down to clog
> is coming from xact.c's transaction state stack, which is completely
> separate from the procarray.  Now after going over the logic in some
> detail, it does look to me that you're correct that in the case of a
> toplevel commit they will always match, but in some sense that looks
> accidental.
>
> For example, look at this code from RecordTransactionAbort:
>
>     /*
>      * If we're aborting a subtransaction, we can immediately remove failed
>      * XIDs from PGPROC's cache of running child XIDs.  We do that here for
>      * subxacts, because we already have the child XID array at hand.  For
>      * main xacts, the equivalent happens just after this function returns.
>      */
>     if (isSubXact)
>         XidCacheRemoveRunningXids(xid, nchildren, children, latestXid);
>
> That code paints the removal of the aborted subxids from our PGPROC as
> an optimization, not a requirement for correctness.  And without this
> patch, that's correct: the XIDs are advertised in PGPROC so that we
> construct correct snapshots, but they only need to be present there
> for so long as there is a possibility that those XIDs might in the
> future commit.  Once they've aborted, it's not *necessary* for them to
> appear in PGPROC any more, but it doesn't hurt anything if they do.
> However, with this patch, removing them from PGPROC becomes a hard
> requirement, because otherwise the set of XIDs that are running
> according to the transaction state stack and the set that are running
> according to the PGPROC might be different.  Yet, neither the original
> patch nor your proposed fix patch updated any of the comments here.
>

There was a comment in existing code (proc.h) which states that it
will contain non-aborted transactions.  I agree that having it
explicitly mentioned in patch would have been much better.

/** Each backend advertises up to PGPROC_MAX_CACHED_SUBXIDS TransactionIds* for non-aborted subtransactions of its
currenttop transaction.  These* have to be treated as running XIDs by other backends.


> One might wonder whether it's even wise to tie these things together
> too closely.  For example, you can imagine a future patch for
> autonomous transactions stashing their XIDs in the subxids array.
> That'd be fine for snapshot purposes, but it would break this.
>
> Finally, I had an unexplained hang during the TAP tests while testing
> out your fix patch.  I haven't been able to reproduce that so it
> might've just been an artifact of something stupid I did, or of some
> unrelated bug, but I think it's best to back up and reconsider a bit
> here.
>

I agree that more analysis can help us to decide if we can use subxids
from PGPROC and if so under what conditions.  Have you considered the
another patch I have posted to fix the issue which is to do this
optimization only when subxids are not present?  In that patch, it
will remove the dependency of relying on subxids in PGPROC.


--
With Regards,
Amit Kapila.
EnterpriseDB: http://www.enterprisedb.com
On Fri, Mar 10, 2017 at 7:39 PM, Amit Kapila <amit.kapila16@gmail.com> wrote:
> I agree that more analysis can help us to decide if we can use subxids
> from PGPROC and if so under what conditions.  Have you considered the
> another patch I have posted to fix the issue which is to do this
> optimization only when subxids are not present?  In that patch, it
> will remove the dependency of relying on subxids in PGPROC.

Well, that's an option, but it narrows the scope of the optimization
quite a bit.  I think Simon previously opposed handling only the
no-subxid cases (although I may be misremembering) and I'm not that
keen about it either.

I was wondering about doing an explicit test: if the XID being
committed matches the one in the PGPROC, and nsubxids matches, and the
actual list of XIDs matches, then apply the optimization.  That could
replace the logic that you've proposed to exclude non-commit cases,
gxact cases, etc. and it seems fundamentally safer.  But it might be a
more expensive test, too, so I'm not sure.

It would be nice to get some other opinions on how (and whether) to
proceed with this.  I'm feeling really nervous about this right at the
moment, because it seems like everybody including me missed some
fairly critical points relating to the safety (or lack thereof) of
this patch, and I want to make sure that if it gets committed again,
we've really got everything nailed down tight.

--
Robert Haas
EnterpriseDB: http://www.enterprisedb.com
The Enterprise PostgreSQL Company
On Sun, Mar 12, 2017 at 8:11 AM, Robert Haas <robertmhaas@gmail.com> wrote:
> On Fri, Mar 10, 2017 at 7:39 PM, Amit Kapila <amit.kapila16@gmail.com> wrote:
>> I agree that more analysis can help us to decide if we can use subxids
>> from PGPROC and if so under what conditions.  Have you considered the
>> another patch I have posted to fix the issue which is to do this
>> optimization only when subxids are not present?  In that patch, it
>> will remove the dependency of relying on subxids in PGPROC.
>
> Well, that's an option, but it narrows the scope of the optimization
> quite a bit.  I think Simon previously opposed handling only the
> no-subxid cases (although I may be misremembering) and I'm not that
> keen about it either.
>
> I was wondering about doing an explicit test: if the XID being
> committed matches the one in the PGPROC, and nsubxids matches, and the
> actual list of XIDs matches, then apply the optimization.  That could
> replace the logic that you've proposed to exclude non-commit cases,
> gxact cases, etc. and it seems fundamentally safer.  But it might be a
> more expensive test, too, so I'm not sure.
>

I think if the number of subxids is very small let us say under 5 or
so, then such a check might not matter, but otherwise it could be
expensive.

> It would be nice to get some other opinions on how (and whether) to
> proceed with this.  I'm feeling really nervous about this right at the
> moment, because it seems like everybody including me missed some
> fairly critical points relating to the safety (or lack thereof) of
> this patch, and I want to make sure that if it gets committed again,
> we've really got everything nailed down tight.
>

I think the basic thing that is missing in the last patch was that we
can't apply this optimization during WAL replay as during
recovery/hotstandby the xids/subxids are tracked in KnownAssignedXids.
The same is mentioned in header file comments in procarray.c and in
GetSnapshotData (look at an else loop of the check if
(!snapshot->takenDuringRecovery)).  As far as I can see, the patch has
considered that in the initial versions but then the check got dropped
in one of the later revisions by mistake. The patch version-5 [1] has
the check for recovery, but during some code rearrangement, it got
dropped in version-6 [2].  Having said that, I think the improvement
in case there are subtransactions will be lesser because having
subtransactions means more work under LWLock and that will have lesser
context switches.  This optimization is all about the reduction in
frequent context switches, so I think even if we don't optimize the
case for subtransactions we are not leaving much on the table and it
will make this optimization much safe.  To substantiate this theory
with data, see the difference in performance when subtransactions are
used [3] and when they are not used [4].

So we have four ways to proceed:
1. Have this optimization for subtransactions and make it safe by
having some additional conditions like check for recovery, explicit
check for if the actual transaction ids match with ids stored in proc.
2. Have this optimization when there are no subtransactions. In this
case, we can have a very simple check for this optimization.
3. Drop this patch and idea.
4. Consider it for next version.

I personally think second way is okay for this release as that looks
safe and gets us the maximum benefit we can achieve by this
optimization and then consider adding optimization for subtransactions
(first way) in the future version if we think it is safe and gives us
the benefit.

Thoughts?

[1] - https://www.postgresql.org/message-id/CAA4eK1KUVPxBcGTdOuKyvf5p1sQ0HeUbSMbTxtQc%3DP65OxiZog%40mail.gmail.com
[2] - https://www.postgresql.org/message-id/CAA4eK1L4iV-2qe7AyMVsb%2Bnz7SiX8JvCO%2BCqhXwaiXgm3CaBUw%40mail.gmail.com
[3] - https://www.postgresql.org/message-id/CAFiTN-u3%3DXUi7z8dTOgxZ98E7gL1tzL%3Dq9Yd%3DCwWCtTtS6pOZw%40mail.gmail.com
[4] - https://www.postgresql.org/message-id/CAFiTN-u-XEzhd%3DhNGW586fmQwdTy6Qy6_SXe09tNB%3DgBcVzZ_A%40mail.gmail.com

--
With Regards,
Amit Kapila.
EnterpriseDB: http://www.enterprisedb.com
On Fri, Mar 17, 2017 at 2:30 AM, Amit Kapila <amit.kapila16@gmail.com> wrote:
>> I was wondering about doing an explicit test: if the XID being
>> committed matches the one in the PGPROC, and nsubxids matches, and the
>> actual list of XIDs matches, then apply the optimization.  That could
>> replace the logic that you've proposed to exclude non-commit cases,
>> gxact cases, etc. and it seems fundamentally safer.  But it might be a
>> more expensive test, too, so I'm not sure.
>
> I think if the number of subxids is very small let us say under 5 or
> so, then such a check might not matter, but otherwise it could be
> expensive.

We could find out by testing it.  We could also restrict the
optimization to cases with just a few subxids, because if you've got a
large number of subxids this optimization probably isn't buying much
anyway.  We're trying to avoid grabbing CLogControlLock to do a very
small amount of work, but if you've got 10 or 20 subxids we're doing
as much work anyway as the group update optimization is attempting to
put into one batch.

> So we have four ways to proceed:
> 1. Have this optimization for subtransactions and make it safe by
> having some additional conditions like check for recovery, explicit
> check for if the actual transaction ids match with ids stored in proc.
> 2. Have this optimization when there are no subtransactions. In this
> case, we can have a very simple check for this optimization.
> 3. Drop this patch and idea.
> 4. Consider it for next version.
>
> I personally think second way is okay for this release as that looks
> safe and gets us the maximum benefit we can achieve by this
> optimization and then consider adding optimization for subtransactions
> (first way) in the future version if we think it is safe and gives us
> the benefit.
>
> Thoughts?

I don't like #2 very much.  Restricting it to a relatively small
number of transactions - whatever we can show doesn't hurt performance
- seems OK, but restriction it to the exactly-zero-subtransactions
case seems poor.

--
Robert Haas
EnterpriseDB: http://www.enterprisedb.com
The Enterprise PostgreSQL Company
On Mon, Mar 20, 2017 at 8:27 AM, Robert Haas <robertmhaas@gmail.com> wrote:
> On Fri, Mar 17, 2017 at 2:30 AM, Amit Kapila <amit.kapila16@gmail.com> wrote:
>>> I was wondering about doing an explicit test: if the XID being
>>> committed matches the one in the PGPROC, and nsubxids matches, and the
>>> actual list of XIDs matches, then apply the optimization.  That could
>>> replace the logic that you've proposed to exclude non-commit cases,
>>> gxact cases, etc. and it seems fundamentally safer.  But it might be a
>>> more expensive test, too, so I'm not sure.
>>
>> I think if the number of subxids is very small let us say under 5 or
>> so, then such a check might not matter, but otherwise it could be
>> expensive.
>
> We could find out by testing it.  We could also restrict the
> optimization to cases with just a few subxids, because if you've got a
> large number of subxids this optimization probably isn't buying much
> anyway.
>

Yes, and I have modified the patch to compare xids and subxids for
group update.  In the initial short tests (with few client counts), it
seems like till 3 savepoints we can win and 10 savepoints onwards
there is some regression or at the very least there doesn't appear to
be any benefit.  We need more tests to identify what is the safe
number, but I thought it is better to share the patch to see if we
agree on the changes because if not, then the whole testing needs to
be repeated.  Let me know what do you think about attached?


--
With Regards,
Amit Kapila.
EnterpriseDB: http://www.enterprisedb.com

--
Sent via pgsql-hackers mailing list (pgsql-hackers@postgresql.org)
To make changes to your subscription:
http://www.postgresql.org/mailpref/pgsql-hackers
Вложения
I have tried to test 'group_update_clog_v11.1.patch' shared upthread by Amit on a high end machine. I have tested the patch with various savepoints in my test script. The machine details along with test scripts and the test results are shown below,
Machine details:
============
24 sockets, 192 CPU(s)
RAM - 500GB
test script:
========
\set aid random (1,30000000)
\set tid random (1,3000)
BEGIN;
SELECT abalance FROM pgbench_accounts WHERE aid = :aid for UPDATE;
SAVEPOINT s1;
SELECT tbalance FROM pgbench_tellers WHERE tid = :tid for UPDATE;
SAVEPOINT s2;
SELECT abalance FROM pgbench_accounts WHERE aid = :aid for UPDATE;
SAVEPOINT s3;
SELECT tbalance FROM pgbench_tellers WHERE tid = :tid for UPDATE;
SAVEPOINT s4;
SELECT abalance FROM pgbench_accounts WHERE aid = :aid for UPDATE;
SAVEPOINT s5;
SELECT tbalance FROM pgbench_tellers WHERE tid = :tid for UPDATE;
END;
Non-default parameters
==================
max_connections = 200
shared_buffers=8GB
min_wal_size=10GB
max_wal_size=15GB
maintenance_work_mem = 1GB
checkpoint_completion_target = 0.9
checkpoint_timeout=900
synchronous_commit=off
pgbench -M prepared -c $thread -j $thread -T $time_for_reading postgres -f ~/test_script.sql
where, time_for_reading = 10 mins
Test Results:
=========
With 3 savepoints
=============
| CLIENT COUNT | TPS (HEAD) | TPS (PATCH) | % IMPROVEMENT |
| 128 | 50275 | 53704 | 6.82048732 |
| 64 | 62860 | 66561 | 5.887686923 |
| 8 | 18464 | 18752 | 1.559792028 |
With 5 savepoints
=============
| CLIENT COUNT | TPS (HEAD) | TPS (PATCH) | % IMPROVEMENT |
| 128 | 46559 | 47715 | 2.482871196 |
| 64 | 52306 | 52082 | -0.4282491492 |
| 8 | 12289 | 12852 | 4.581332899 |
With 7 savepoints
=============
| CLIENT COUNT | TPS (HEAD) | TPS (PATCH) | % IMPROVEMENT |
| 128 | 41367 | 41500 | 0.3215123166 |
| 64 | 42996 | 41473 | -3.542189971 |
| 8 | 9665 | 9657 | -0.0827728919 |
With 10 savepoints
==============
| CLIENT COUNT | TPS (HEAD) | TPS (PATCH) | % IMPROVEMENT |
| 128 | 34513 | 34597 | 0.24338655 |
| 64 | 32581 | 32035 | -1.675823333 |
| 8 | 7293 | 7622 | 4.511175099 |
On Mon, Mar 20, 2017 at 8:27 AM, Robert Haas <robertmhaas@gmail.com> wrote:
> On Fri, Mar 17, 2017 at 2:30 AM, Amit Kapila <amit.kapila16@gmail.com> wrote:
>>> I was wondering about doing an explicit test: if the XID being
>>> committed matches the one in the PGPROC, and nsubxids matches, and the
>>> actual list of XIDs matches, then apply the optimization. That could
>>> replace the logic that you've proposed to exclude non-commit cases,
>>> gxact cases, etc. and it seems fundamentally safer. But it might be a
>>> more expensive test, too, so I'm not sure.
>>
>> I think if the number of subxids is very small let us say under 5 or
>> so, then such a check might not matter, but otherwise it could be
>> expensive.
>
> We could find out by testing it. We could also restrict the
> optimization to cases with just a few subxids, because if you've got a
> large number of subxids this optimization probably isn't buying much
> anyway.
>
Yes, and I have modified the patch to compare xids and subxids for
group update. In the initial short tests (with few client counts), it
seems like till 3 savepoints we can win and 10 savepoints onwards
there is some regression or at the very least there doesn't appear to
be any benefit. We need more tests to identify what is the safe
number, but I thought it is better to share the patch to see if we
agree on the changes because if not, then the whole testing needs to
be repeated. Let me know what do you think about attached?
--
Sent via pgsql-hackers mailing list (pgsql-hackers@postgresql.org)
To make changes to your subscription:
http://www.postgresql.org/mailpref/pgsql-hackers
On Thu, Mar 9, 2017 at 5:49 PM, Robert Haas <robertmhaas@gmail.com> wrote:
> However, I just realized that in
> both this case and in the case of group XID clearing, we weren't
> advertising a wait event for the PGSemaphoreLock calls that are part
> of the group locking machinery.  I think we should fix that, because a
> quick test shows that can happen fairly often -- not, I think, as
> often as we would have seen LWLock waits without these patches, but
> often enough that you'll want to know.  Patch attached.

I've pushed the portion of this that relates to ProcArrayLock.  (I
know this hasn't been discussed much, but there doesn't really seem to
be any reason for anybody to object, and looking at just the
LWLock/ProcArrayLock wait events gives a highly misleading answer.)

--
Robert Haas
EnterpriseDB: http://www.enterprisedb.com
The Enterprise PostgreSQL Company
Conclusion:As seen from the test results mentioned above, there is some performance improvement with 3 SP(s), with 5 SP(s) the results with patch is slightly better than HEAD, with 7 and 10 SP(s) we do see regression with patch. Therefore, I think the threshold value of 4 for number of subtransactions considered in the patch looks fine to me.
Вложения
On Mon, Jul 3, 2017 at 6:15 PM, Amit Kapila <amit.kapila16@gmail.com> wrote:
> On Thu, Mar 23, 2017 at 1:18 PM, Ashutosh Sharma <ashu.coek88@gmail.com>
> wrote:
>>
>> Conclusion:
>> As seen from the test results mentioned above, there is some performance
>> improvement with 3 SP(s), with 5 SP(s) the results with patch is slightly
>> better than HEAD, with 7 and 10 SP(s) we do see regression with patch.
>> Therefore, I think the threshold value of 4 for number of subtransactions
>> considered in the patch looks fine to me.
>>
>
> Thanks for the tests.  Attached find the rebased patch on HEAD.  I have ran
> latest pgindent on patch.  I have yet to add wait event for group lock waits
> in this patch as is done by Robert in commit
> d4116a771925379c33cf4c6634ca620ed08b551d for ProcArrayGroupUpdate.
>

I have updated the patch to support wait events and moved it to upcoming CF.

--
With Regards,
Amit Kapila.
EnterpriseDB: http://www.enterprisedb.com

--
Sent via pgsql-hackers mailing list (pgsql-hackers@postgresql.org)
To make changes to your subscription:
http://www.postgresql.org/mailpref/pgsql-hackers
Вложения
On Tue, Jul 4, 2017 at 12:33 AM, Amit Kapila <amit.kapila16@gmail.com> wrote:
> I have updated the patch to support wait events and moved it to upcoming CF.

This patch doesn't apply any more, but I made it apply with a hammer
and then did a little benchmarking (scylla, EDB server, Intel Xeon
E5-2695 v3 @ 2.30GHz, 2 sockets, 14 cores/socket, 2 threads/core).
The results were not impressive.  There's basically no clog contention
to remove, so the patch just doesn't really do anything.  For example,
here's a wait event profile with master and using Ashutosh's test
script with 5 savepoints:
     1  Lock            | tuple     2  IO              | SLRUSync     5  LWLock          | wal_insert     5  LWLock
    | XidGenLock     9  IO              | DataFileRead    12  LWLock          | lock_manager    16  IO              |
SLRURead   20  LWLock          | CLogControlLock    97  LWLock          | buffer_content   216  Lock            |
transactionid  237  LWLock          | ProcArrayLock  1238  IPC             | ProcArrayGroupUpdate  2266  Client
| ClientRead


This is just a 5-minute test; maybe things would change if we ran it
for longer, but if only 0.5% of the samples are blocked on
CLogControlLock without the patch, obviously the patch can't help
much.  I did some other experiments too, but I won't bother
summarizing the results here because they're basically boring.  I
guess I should have used a bigger machine.

Given that we've changed the approach here somewhat, I think we need
to validate that we're still seeing a substantial reduction in
CLogControlLock contention on big machines.

--
Robert Haas
EnterpriseDB: http://www.enterprisedb.com
The Enterprise PostgreSQL Company
On Wed, Aug 30, 2017 at 2:43 AM, Robert Haas <robertmhaas@gmail.com> wrote:
> On Tue, Jul 4, 2017 at 12:33 AM, Amit Kapila <amit.kapila16@gmail.com> wrote:
>> I have updated the patch to support wait events and moved it to upcoming CF.
>
> This patch doesn't apply any more, but I made it apply with a hammer
> and then did a little benchmarking (scylla, EDB server, Intel Xeon
> E5-2695 v3 @ 2.30GHz, 2 sockets, 14 cores/socket, 2 threads/core).
> The results were not impressive.  There's basically no clog contention
> to remove, so the patch just doesn't really do anything.
>

Yeah, in such a case patch won't help.

>  For example,
> here's a wait event profile with master and using Ashutosh's test
> script with 5 savepoints:
>
>       1  Lock            | tuple
>       2  IO              | SLRUSync
>       5  LWLock          | wal_insert
>       5  LWLock          | XidGenLock
>       9  IO              | DataFileRead
>      12  LWLock          | lock_manager
>      16  IO              | SLRURead
>      20  LWLock          | CLogControlLock
>      97  LWLock          | buffer_content
>     216  Lock            | transactionid
>     237  LWLock          | ProcArrayLock
>    1238  IPC             | ProcArrayGroupUpdate
>    2266  Client          | ClientRead
>
> This is just a 5-minute test; maybe things would change if we ran it
> for longer, but if only 0.5% of the samples are blocked on
> CLogControlLock without the patch, obviously the patch can't help
> much.  I did some other experiments too, but I won't bother
> summarizing the results here because they're basically boring.  I
> guess I should have used a bigger machine.
>

That would have been better. In any case, will do the tests on some
higher end machine and will share the results.

> Given that we've changed the approach here somewhat, I think we need
> to validate that we're still seeing a substantial reduction in
> CLogControlLock contention on big machines.
>

Sure will do so.  In the meantime, I have rebased the patch.


--
With Regards,
Amit Kapila.
EnterpriseDB: http://www.enterprisedb.com

--
Sent via pgsql-hackers mailing list (pgsql-hackers@postgresql.org)
To make changes to your subscription:
http://www.postgresql.org/mailpref/pgsql-hackers
Вложения
On Wed, Aug 30, 2017 at 12:54 PM, Amit Kapila <amit.kapila16@gmail.com> wrote:
>
> That would have been better. In any case, will do the tests on some
> higher end machine and will share the results.
>
>> Given that we've changed the approach here somewhat, I think we need
>> to validate that we're still seeing a substantial reduction in
>> CLogControlLock contention on big machines.
>>
>
> Sure will do so.  In the meantime, I have rebased the patch.

I have repeated some of the tests we have performed earlier.

Machine:
Intel 8 socket machine with 128 core.

Configuration:

shared_buffers=8GB
checkpoint_timeout=40min
max_wal_size=20GB
max_connections=300
maintenance_work_mem=4GB
synchronous_commit=off
checkpoint_completion_target=0.9

I have run taken one reading for each test to measure the wait event.
Observation is same that at higher client count there is a significant
reduction in the contention on ClogControlLock.

Benchmark:  Pgbench simple_update, 30 mins run:

Head: (64 client) : (TPS 60720)
53808  Client          | ClientRead 26147  IPC             | ProcArrayGroupUpdate  7866  LWLock          |
CLogControlLock 3705  Activity        | LogicalLauncherMain  3699  Activity        | AutoVacuumMain  3353  LWLock
  | ProcArrayLoc  3099  LWLock          | wal_insert  2825  Activity        | BgWriterMain  2688  Lock            |
extend 1436  Activity        | WalWriterMain


Patch: (64 client) : (TPS 67207)53235  Client          | ClientRead 29470  IPC             | ProcArrayGroupUpdate  4302
LWLock          | wal_insert  3717  Activity        | LogicalLauncherMain  3715  Activity        | AutoVacuumMain  3463
LWLock          | ProcArrayLock  3140  Lock            | extend  2934  Activity        | BgWriterMain  1434  Activity
    | WalWriterMain  1198  Activity        | CheckpointerMain  1073  LWLock          | XidGenLock   869  IPC
| ClogGroupUpdate


Head:(72 Client): (TPS 57856)
55820  Client          | ClientRead 34318  IPC             | ProcArrayGroupUpdate 15392  LWLock          |
CLogControlLock 3708  Activity        | LogicalLauncherMain  3705  Activity        | AutoVacuumMain  3436  LWLock
  | ProcArrayLock


Patch:(72 Client): (TPS 65740)
 60356  Client          | ClientRead 38545  IPC             | ProcArrayGroupUpdate  4573  LWLock          | wal_insert
3708 Activity        | LogicalLauncherMain  3705  Activity        | AutoVacuumMain  3508  LWLock          |
ProcArrayLock 3492  Lock            | extend  2903  Activity        | BgWriterMain  1903  LWLock          | XidGenLock
1383 Activity        | WalWriterMain  1212  Activity        | CheckpointerMain  1056  IPC             |
ClogGroupUpdate


Head:(96 Client): (TPS 52170)
 62841  LWLock          | CLogControlLock 56150  IPC             | ProcArrayGroupUpdate 54761  Client          |
ClientRead 7037  LWLock          | wal_insert  4077  Lock            | extend  3727  Activity        |
LogicalLauncherMain 3727  Activity        | AutoVacuumMain  3027  LWLock          | ProcArrayLock


Patch:(96 Client): (TPS 67932)
 87378  IPC             | ProcArrayGroupUpdate 80201  Client          | ClientRead 11511  LWLock          | wal_insert
4102 Lock            | extend  3971  LWLock          | ProcArrayLock  3731  Activity        | LogicalLauncherMain  3731
Activity        | AutoVacuumMain  2948  Activity        | BgWriterMain  1763  LWLock          | XidGenLock  1736  IPC
         | ClogGroupUpdate


Head:(128 Client): (TPS 40820)
182569  LWLock          | CLogControlLock 61484  IPC             | ProcArrayGroupUpdate 37969  Client          |
ClientRead 5135  LWLock          | wal_insert  3699  Activity        | LogicalLauncherMain  3699  Activity        |
AutoVacuumMain

Patch:(128 Client): (TPS 67054)
174583  IPC             | ProcArrayGroupUpdate 66084  Client          | ClientRead 16738  LWLock          | wal_insert
4993 IPC             | ClogGroupUpdate  4893  LWLock          | ProcArrayLock  4839  Lock            | extend


Benchmark: select for update with 3 save points, 10 mins run

Script:
\set aid random (1,30000000)
\set tid random (1,3000)

BEGIN;
SELECT abalance FROM pgbench_accounts WHERE aid = :aid for UPDATE;
SAVEPOINT s1;
SELECT tbalance FROM pgbench_tellers WHERE tid = :tid for UPDATE;
SAVEPOINT s2;
SELECT abalance FROM pgbench_accounts WHERE aid = :aid for UPDATE;
SAVEPOINT s3;
SELECT tbalance FROM pgbench_tellers WHERE tid = :tid for UPDATE;
END;

Head:(64 Client): (TPS 44577.1802)
 53808  Client          | ClientRead 26147  IPC             | ProcArrayGroupUpdate  7866  LWLock          |
CLogControlLock 3705  Activity        | LogicalLauncherMain  3699  Activity        | AutoVacuumMain  3353  LWLock
  | ProcArrayLock  3099  LWLock          | wal_insert


Patch:(64 Client): (TPS 46156.245)
53235  Client          | ClientRead 29470  IPC             | ProcArrayGroupUpdate  4302  LWLock          | wal_insert
3717 Activity        | LogicalLauncherMain  3715  Activity        | AutoVacuumMain  3463  LWLock          |
ProcArrayLock 3140  Lock            | extend  2934  Activity        | BgWriterMain  1434  Activity        |
WalWriterMain 1198  Activity        | CheckpointerMain  1073  LWLock          | XidGenLock   869  IPC             |
ClogGroupUpdate


--
Regards,
Dilip Kumar
EnterpriseDB: http://www.enterprisedb.com
On Fri, Sep 1, 2017 at 10:03 AM, Dilip Kumar <dilipbalaut@gmail.com> wrote:
>> Sure will do so.  In the meantime, I have rebased the patch.
>
> I have repeated some of the tests we have performed earlier.

OK, these tests seem to show that this is still working.  Committed,
again.  Let's hope this attempt goes better than the last one.

--
Robert Haas
EnterpriseDB: http://www.enterprisedb.com
The Enterprise PostgreSQL Company
On Fri, Sep 1, 2017 at 9:17 PM, Robert Haas <robertmhaas@gmail.com> wrote:
> On Fri, Sep 1, 2017 at 10:03 AM, Dilip Kumar <dilipbalaut@gmail.com> wrote:
>>> Sure will do so.  In the meantime, I have rebased the patch.
>>
>> I have repeated some of the tests we have performed earlier.
>

Thanks for repeating the performance tests.

> OK, these tests seem to show that this is still working.  Committed,
> again.  Let's hope this attempt goes better than the last one.
>

Thanks for committing.


--
With Regards,
Amit Kapila.
EnterpriseDB: http://www.enterprisedb.com