Обсуждение: v7.1b4 bad performance
Has anyone run pgbench with the latest beta?
I'm seeing ~50 tps with 7.1b4 versus ~100 tps with v7.02 & 7.03 running postgres on FreeBSD v4.0. I'm vacuuming before and after each test run and using -F with postmaster. Originally I thought I had a debug build but what I'm seeing are debug msgs from vacuum. JDBC interface is much slower...
Thanks.
Peter
pschmidt@prismedia.com
With -B 256 -F I'm getting around 70 tps, and I haven't got wonderful hardware: dual 450Mhz PII, 40GB SCSI drive, 320MB RAM, RH Linux 7.0. I presume that these benchmarks are not adjusted statistically to compensate for hardware or anything like that.
pgbench -t 100 -c 5
With
pgbench -t 100 -c 10
I'm getting up to 85 tps, same server settings as above.
MikeA
-----Original Message-----
From: Schmidt, Peter [mailto:peter.schmidt@prismedia.com]
Sent: 12 February 2001 23:53
To: 'pgsql-admin@postgresql.org'
Subject: [ADMIN] v7.1b4 bad performance
Has anyone run pgbench with the latest beta?
I'm seeing ~50 tps with 7.1b4 versus ~100 tps with v7.02 & 7.03 running postgres on FreeBSD v4.0. I'm vacuuming before and after each test run and using -F with postmaster. Originally I thought I had a debug build but what I'm seeing are debug msgs from vacuum. JDBC interface is much slower...
Thanks.
Peter
pschmidt@prismedia.com
 **********************************************************************
 This email and any files transmitted with it are confidential and
 intended solely for the use of the individual or entity to whom they
 are addressed. If you have received this email in error please notify
 Nick West - Global Infrastructure Manager.

 This footnote also confirms that this email message has been swept by
 MIMEsweeper for the presence of computer viruses.

 www.mimesweeper.com
 **********************************************************************
-----Original Message-----
From: Michael Ansley [mailto:Michael.Ansley@intec-telecom-systems.com]
Sent: Tuesday, February 13, 2001 6:35 AM
To: 'Schmidt, Peter'; 'pgsql-admin@postgresql.org'
Subject: RE: [ADMIN] v7.1b4 bad performance
With -B 256 -F I'm getting around 70 tps, and I haven't got wonderful hardware: dual 450Mhz PII, 40GB SCSI drive, 320MB RAM, RH Linux 7.0. I presume that these benchmarks are not adjusted statistically to compensate for hardware or anything like that.
pgbench -t 100 -c 5
With
pgbench -t 100 -c 10
I'm getting up to 85 tps, same server settings as above.
MikeA
-----Original Message-----
From: Schmidt, Peter [mailto:peter.schmidt@prismedia.com]
Sent: 12 February 2001 23:53
To: 'pgsql-admin@postgresql.org'
Subject: [ADMIN] v7.1b4 bad performanceHas anyone run pgbench with the latest beta?
I'm seeing ~50 tps with 7.1b4 versus ~100 tps with v7.02 & 7.03 running postgres on FreeBSD v4.0. I'm vacuuming before and after each test run and using -F with postmaster. Originally I thought I had a debug build but what I'm seeing are debug msgs from vacuum. JDBC interface is much slower...Thanks.
Peter
pschmidt@prismedia.com
**********************************************************************
This email and any files transmitted with it are confidential and
intended solely for the use of the individual or entity to whom they
are addressed. If you have received this email in error please notify
Nick West - Global Infrastructure Manager.

This footnote also confirms that this email message has been swept by
MIMEsweeper for the presence of computer viruses.

www.mimesweeper.com
**********************************************************************
From: Schmidt, Peter [mailto:peter.schmidt@prismedia.com]
Sent: 13 February 2001 19:13
To: 'Michael Ansley'; Schmidt, Peter; 'pgsql-admin@postgresql.org'
Subject: RE: [ADMIN] v7.1b4 bad performance
I'm using a test machine that is even less powerful than what you are using. However, what I'm interested in is the comparison between 7.0x and 7.1x. Shouldn't the 7.1b4 database be faster? Have you (or anyone else) done this comparison?Also, I'm not sure why tps is significantly higher when running the default (-t 10) vs say -t 1000, but I can live with that...Thanks.Peter
-----Original Message-----
From: Michael Ansley [mailto:Michael.Ansley@intec-telecom-systems.com]
Sent: Tuesday, February 13, 2001 6:35 AM
To: 'Schmidt, Peter'; 'pgsql-admin@postgresql.org'
Subject: RE: [ADMIN] v7.1b4 bad performanceWith -B 256 -F I'm getting around 70 tps, and I haven't got wonderful hardware: dual 450Mhz PII, 40GB SCSI drive, 320MB RAM, RH Linux 7.0. I presume that these benchmarks are not adjusted statistically to compensate for hardware or anything like that.
pgbench -t 100 -c 5
With
pgbench -t 100 -c 10
I'm getting up to 85 tps, same server settings as above.
MikeA
-----Original Message-----
From: Schmidt, Peter [mailto:peter.schmidt@prismedia.com]
Sent: 12 February 2001 23:53
To: 'pgsql-admin@postgresql.org'
Subject: [ADMIN] v7.1b4 bad performanceHas anyone run pgbench with the latest beta?
I'm seeing ~50 tps with 7.1b4 versus ~100 tps with v7.02 & 7.03 running postgres on FreeBSD v4.0. I'm vacuuming before and after each test run and using -F with postmaster. Originally I thought I had a debug build but what I'm seeing are debug msgs from vacuum. JDBC interface is much slower...Thanks.
Peter
pschmidt@prismedia.com
**********************************************************************
This email and any files transmitted with it are confidential and
intended solely for the use of the individual or entity to whom they
are addressed. If you have received this email in error please notify
Nick West - Global Infrastructure Manager.

This footnote also confirms that this email message has been swept by
MIMEsweeper for the presence of computer viruses.

www.mimesweeper.com
**********************************************************************
"Schmidt, Peter" <peter.schmidt@prismedia.com> writes:
> However, what I'm interested in is the comparison between 7.0x and 7.1x.
> Shouldn't the 7.1b4 database be faster? Have you (or anyone else) done this
> comparison?

7.1 is considerably faster if you compare performance without -F.
If you are comparing performance with -F, I'm not sure exactly how it
stacks up.

            regards, tom lane
On Wed, 14 Feb 2001, Tom Lane wrote:

> "Schmidt, Peter" <peter.schmidt@prismedia.com> writes:
> > However, what I'm interested in is the comparison between 7.0x and 7.1x.
> > Shouldn't the 7.1b4 database be faster? Have you (or anyone else) done this
> > comparison?
>
> 7.1 is considerably faster if you compare performance without -F.
> If you are comparing performance with -F, I'm not sure exactly how it
> stacks up.
>

 If I good remember, a compare is in some old Vadim's mail, -F is still
faster.

            Karel
> -----Original Message-----
> From: Tom Lane [mailto:tgl@sss.pgh.pa.us]
> Sent: Wednesday, February 14, 2001 8:02 AM
> To: Schmidt, Peter
> Cc: 'Michael Ansley'; 'pgsql-admin@postgresql.org'
> Subject: Re: [ADMIN] v7.1b4 bad performance
>
>
> "Schmidt, Peter" <peter.schmidt@prismedia.com> writes:
> > However, what I'm interested in is the comparison between
> 7.0x and 7.1x.
> > Shouldn't the 7.1b4 database be faster? Have you (or anyone
> else) done this
> > comparison?
>
> 7.1 is considerably faster if you compare performance without -F.
> If you are comparing performance with -F, I'm not sure exactly how it
> stacks up.
>
> regards, tom lane
>
Here are some of the results of my tests which are very consistent. I dropped and recreated postgres db before each test so the only user tables were the pgbench tables.
7.1b4(no -F) 49 tps
7.03 (no -F) 64 tps
7.03 (with -F) 121 tps
The test machine is a Dell Dimension 800mz w/128 RAM and it is dedicated to this testing. Pgbench is run on the same machine. Any ideas why my results differ? I will continue testing and appreciate all comments.
Peter
7.1b4 without -F option
---------------------------------
postgres@dev-postgres:~ > postmaster -i -D /usr/local/pgsql/data &
[1] 73010
postgres@dev-postgres:~ > DEBUG: starting up
DEBUG: database system was shut down at 2001-02-14 08:23:53
DEBUG: CheckPoint record at (0, 79220804)
DEBUG: Redo record at (0, 79220804); Undo record at (0, 0); Shutdown TRUE
DEBUG: NextTransactionId: 9947; NextOid: 126002
DEBUG: database system is in production state
postgres=# select version();
version
------------------------------------------------------------------------
PostgreSQL 7.1beta4 on i386-unknown-freebsd4.0, compiled by GCC 2.95.2
(1 row)
postgres@dev-postgres:~ > ./pgbench -t1000
starting vacuum...DEBUG: --Relation branches--
DEBUG: Pages 1: Changed 0, reaped 0, Empty 0, New 0; Tup 1: Vac 0, Keep/VTL 0/0, Crash 0, UnUsed 0, MinLen 44, MaxLen 44; Re-using: Free/Avail. Space 0/0; EndEmpty/Avail. Pages 0/0. CPU 0.00s/0.00u sec.
DEBUG: Index branches_pkey: Pages 2; Tuples 1. CPU 0.00s/0.00u sec.
DEBUG: --Relation tellers--
DEBUG: Pages 1: Changed 0, reaped 0, Empty 0, New 0; Tup 10: Vac 0, Keep/VTL 0/0, Crash 0, UnUsed 0, MinLen 48, MaxLen 48; Re-using: Free/Avail. Space 0/0; EndEmpty/Avail. Pages 0/0. CPU 0.00s/0.00u sec.
DEBUG: Index tellers_pkey: Pages 2; Tuples 10. CPU 0.00s/0.00u sec.
DEBUG: --Relation history--
DEBUG: Pages 0: Changed 0, reaped 0, Empty 0, New 0; Tup 0: Vac 0, Keep/VTL 0/0, Crash 0, UnUsed 0, MinLen 0, MaxLen 0; Re-using: Free/Avail. Space 0/0; EndEmpty/Avail. Pages 0/0. CPU 0.00s/0.00u sec.
end.
transaction type: TPC-B (sort of)
scaling factor: 1
number of clients: 1
number of transactions per client: 1000
number of transactions actually processed: 1000/1000
tps = 49.390375(including connections establishing)
tps = 49.426294(excluding connections establishing)
7.03 without -F option
-------------------------------
su-2.03$ postmaster -i -D/usr/local/pgsql/data &
[1] 73068
su-2.03$ DEBUG: Data Base System is starting up at Wed Feb 14 08:27:00 2001
DEBUG: Data Base System was shut down at Wed Feb 14 08:20:37 2001
DEBUG: Data Base System is in production state at Wed Feb 14 08:27:00 2001
postgres=# select version();
version
------------------------------------------------------------------------
PostgreSQL 7.0.3 on i386-unknown-freebsdelf4.0, compiled by gcc 2.95.2
(1 row)
su-2.03$ ./pgbench -t1000
starting vacuum...DEBUG: --Relation branches--
DEBUG: Pages 6: Changed 0, reaped 6, Empty 0, New 0; Tup 1: Vac 1000, Keep/VTL 0/0, Crash 0, UnUsed 0, MinLen 44, MaxLen 44; Re-using: Free/Avail. Space 45056/37520; EndEmpty/Avail. Pages 0/5. CPU 0.00s/0.00u sec.
DEBUG: Index branches_pkey: Pages 4; Tuples 1: Deleted 1000. CPU 0.00s/0.00u sec.
DEBUG: Rel branches: Pages: 6 --> 1; Tuple(s) moved: 1. CPU 0.00s/0.00u sec.
DEBUG: Index branches_pkey: Pages 4; Tuples 1: Deleted 1. CPU 0.00s/0.00u sec.
DEBUG: --Relation tellers--
DEBUG: Pages 7: Changed 1, reaped 7, Empty 0, New 0; Tup 10: Vac 1000, Keep/VTL 0/0, Crash 0, UnUsed 0, MinLen 48, MaxLen 48; Re-using: Free/Avail. Space 52768/45336; EndEmpty/Avail. Pages 0/6. CPU 0.00s/0.00u sec.
DEBUG: Index tellers_pkey: Pages 6; Tuples 10: Deleted 1000. CPU 0.00s/0.00u sec.
DEBUG: Rel tellers: Pages: 7 --> 1; Tuple(s) moved: 10. CPU 0.00s/0.00u sec.
DEBUG: Index tellers_pkey: Pages 6; Tuples 10: Deleted 10. CPU 0.00s/0.00u sec.
DEBUG: --Relation history--
DEBUG: Pages 8: Changed 0, reaped 8, Empty 0, New 0; Tup 0: Vac 1000, Keep/VTL 0/0, Crash 0, UnUsed 0, MinLen 0, MaxLen 0; Re-using: Free/Avail. Space 61472/0; EndEmpty/Avail. Pages 8/0. CPU 0.00s/0.00u sec.
DEBUG: Rel history: Pages: 8 --> 0.
end.
transaction type: TPC-B (sort of)
scaling factor: 1
number of clients: 1
number of transactions per client: 1000
number of transactions actually processed: 1000/1000
tps = 64.836518(including connections establishing)
tps = 64.893213(excluding connections establishing)
7.03 with -F option
---------------------------
su-2.03$ postmaster -i -D/usr/local/pgsql/data -o -F &
[1] 73104
su-2.03$ DEBUG: Data Base System is starting up at Wed Feb 14 08:28:56 2001
DEBUG: Data Base System was shut down at Wed Feb 14 08:28:35 2001
DEBUG: Data Base System is in production state at Wed Feb 14 08:28:56 2001
postgres=# select version();
version
------------------------------------------------------------------------
PostgreSQL 7.0.3 on i386-unknown-freebsdelf4.0, compiled by gcc 2.95.2
(1 row)
su-2.03$ ./pgbench -t1000
starting vacuum...DEBUG: --Relation branches--
DEBUG: Pages 6: Changed 0, reaped 6, Empty 0, New 0; Tup 1: Vac 1000, Keep/VTL 0/0, Crash 0, UnUsed 0, MinLen 44, MaxLen 44; Re-using: Free/Avail. Space 45056/37520; EndEmpty/Avail. Pages 0/5. CPU 0.00s/0.00u sec.
DEBUG: Index branches_pkey: Pages 4; Tuples 1: Deleted 1000. CPU 0.00s/0.00u sec.
DEBUG: Rel branches: Pages: 6 --> 1; Tuple(s) moved: 1. CPU 0.00s/0.00u sec.
DEBUG: Index branches_pkey: Pages 4; Tuples 1: Deleted 1. CPU 0.00s/0.00u sec.
DEBUG: --Relation tellers--
DEBUG: Pages 7: Changed 1, reaped 7, Empty 0, New 0; Tup 10: Vac 1000, Keep/VTL 0/0, Crash 0, UnUsed 0, MinLen 48, MaxLen 48; Re-using: Free/Avail. Space 52768/45336; EndEmpty/Avail. Pages 0/6. CPU 0.00s/0.00u sec.
DEBUG: Index tellers_pkey: Pages 6; Tuples 10: Deleted 1000. CPU 0.00s/0.00u sec.
DEBUG: Rel tellers: Pages: 7 --> 1; Tuple(s) moved: 10. CPU 0.00s/0.00u sec.
DEBUG: Index tellers_pkey: Pages 6; Tuples 10: Deleted 10. CPU 0.00s/0.00u sec.
DEBUG: --Relation history--
DEBUG: Pages 8: Changed 0, reaped 8, Empty 0, New 0; Tup 0: Vac 1000, Keep/VTL 0/0, Crash 0, UnUsed 0, MinLen 0, MaxLen 0; Re-using: Free/Avail. Space 61472/0; EndEmpty/Avail. Pages 8/0. CPU 0.00s/0.00u sec.
DEBUG: Rel history: Pages: 8 --> 0.
end.
transaction type: TPC-B (sort of)
scaling factor: 1
number of clients: 1
number of transactions per client: 1000
number of transactions actually processed: 1000/1000
tps = 121.475362(including connections establishing)
tps = 121.671287(excluding connections establishing)
> > "Schmidt, Peter" <peter.schmidt@prismedia.com> writes:
> > > However, what I'm interested in is the comparison between
> > 7.0x and 7.1x.
> > > Shouldn't the 7.1b4 database be faster? Have you (or anyone
> > else) done this
> > > comparison?
> >
> > 7.1 is considerably faster if you compare performance without -F.
> > If you are comparing performance with -F, I'm not sure exactly how it
> > stacks up.
> >
> >             regards, tom lane
> >
>
> Here are some of the results of my tests which are very consistent.  I
> dropped and recreated postgres db before each test so the only user tables
> were the pgbench tables.
>
> 7.1b4(no -F)    49 tps
> 7.03 (no -F)    64 tps
> 7.03 (with -F)    121 tps
>
> The test machine is a Dell Dimension 800mz w/128 RAM and it is dedicated to
> this testing. Pgbench is run on the same machine. Any ideas why my results
> differ? I will continue testing and appreciate all comments.
> Peter

This is very strange.  Is there any specific query that is causing the
problem?  Does EXPLAIN show the same output on both versions?

--
  Bruce Momjian                        |  http://candle.pha.pa.us
  pgman@candle.pha.pa.us               |  (610) 853-3000
  +  If your life is a hard drive,     |  830 Blythe Avenue
  +  Christ can be your backup.        |  Drexel Hill, Pennsylvania 19026
> -----Original Message-----
> From: Bruce Momjian [mailto:pgman@candle.pha.pa.us]
> Sent: Friday, February 16, 2001 10:59 AM
> To: Schmidt, Peter
> Cc: 'Tom Lane'; 'Michael Ansley'; 'pgsql-admin@postgresql.org'
> Subject: Re: [ADMIN] v7.1b4 bad performance
>
>
> > > "Schmidt, Peter" <peter.schmidt@prismedia.com> writes:
> > > > However, what I'm interested in is the comparison between
> > > 7.0x and 7.1x.
> > > > Shouldn't the 7.1b4 database be faster? Have you (or anyone
> > > else) done this
> > > > comparison?
> > >
> > > 7.1 is considerably faster if you compare performance without -F.
> > > If you are comparing performance with -F, I'm not sure
> exactly how it
> > > stacks up.
> > >
> > > regards, tom lane
> > >
> >
> > Here are some of the results of my tests which are very
> consistent. I
> > dropped and recreated postgres db before each test so the
> only user tables
> > were the pgbench tables.
> >
> > 7.1b4(no -F) 49 tps
> > 7.03 (no -F) 64 tps
> > 7.03 (with -F) 121 tps
> >
> > The test machine is a Dell Dimension 800mz w/128 RAM and it
> is dedicated to
> > this testing. Pgbench is run on the same machine. Any ideas
> why my results
> > differ? I will continue testing and appreciate all comments.
> > Peter
>
> This is very strange. Is there any specific query that is causing the
> problem? Does EXPLAIN show the same output on both versions?
>
"pgbench" doesn't execute any complex sql...
Explain shows exactly the same output for both versions(7.03 & 7.1b4):
update accounts set abalance = abalance + 1 where aid = 1
Index Scan using accounts_pkey on accounts (cost=0.00..3.81 rows=1 width=30)
select abalance from accounts where aid = 1
Index Scan using accounts_pkey on accounts (cost=0.00..3.81 rows=1 width=4)
update tellers set tbalance = tbalance + 1 where tid = 1
Seq Scan on tellers (cost=0.00..1.12 rows=1 width=30)
update branches set bbalance = bbalance + 1 where bid = 1
Seq Scan on branches (cost=0.00..1.01 rows=1 width=26)
insert into history(tid,bid,aid,delta,time) values(1,1,1,1,'now')
Result (cost=0.00..0.00 rows=0 width=0)
Peter
> > This is very strange.  Is there any specific query that is causing the
> > problem?  Does EXPLAIN show the same output on both versions?
> >
>
>
> "pgbench" doesn't execute any complex sql...
>
> Explain shows exactly the same output for both versions(7.03 & 7.1b4):

I see.  That is bad.  All other reports have been that 7.1b4 is faster
than 7.0.X.  I am stumped.

--
  Bruce Momjian                        |  http://candle.pha.pa.us
  pgman@candle.pha.pa.us               |  (610) 853-3000
  +  If your life is a hard drive,     |  830 Blythe Avenue
  +  Christ can be your backup.        |  Drexel Hill, Pennsylvania 19026
> -----Original Message-----
> From: Bruce Momjian [mailto:pgman@candle.pha.pa.us]
> Sent: Friday, February 16, 2001 2:26 PM
> To: Schmidt, Peter
> Cc: 'Tom Lane'; 'Michael Ansley'; 'pgsql-admin@postgresql.org'
> Subject: Re: [ADMIN] v7.1b4 bad performance
>
>
> > > This is very strange. Is there any specific query that
> is causing the
> > > problem? Does EXPLAIN show the same output on both versions?
> > >
> >
> >
> > "pgbench" doesn't execute any complex sql...
> >
> > Explain shows exactly the same output for both
> versions(7.03 & 7.1b4):
>
> I see. That is bad. All other reports have been that 7.1b4 is faster
> than 7.0.X. I am stumped.
>
There are several tools available for bench testing. pgbench seems like a pretty good one for measuring database performance since it uses libpq interface. Would you concur?
At this point I'm not concerned with comparing interface performance(i.e. JDBC, ODBC, C++), C++ is bound to be the fastest. Also not concerned with network or user interaction aspects of performance...yet. Does anyone know how the "other reports" were gauged? Apparently, I am not the _only_ one who has reproduced these results using pgbench.
Peter
FWIW, I get the following pgbench results on my machine (HPPA C180,
fast-wide-SCSI drives that I do not recall the specs for):

current sources, with -F

$ pgbench -t 1000 bench
starting vacuum...end.
transaction type: TPC-B (sort of)
scaling factor: 1
number of clients: 1
number of transactions per client: 1000
number of transactions actually processed: 1000/1000
tps = 26.493155(including connections establishing)
tps = 26.558319(excluding connections establishing)
$ pgbench -c 10 -t 100 bench
starting vacuum...end.
transaction type: TPC-B (sort of)
scaling factor: 1
number of clients: 10
number of transactions per client: 100
number of transactions actually processed: 1000/1000
tps = 25.812518(including connections establishing)
tps = 26.161266(excluding connections establishing)

current sources, without -F

$ pgbench -t 1000 bench
starting vacuum...end.
transaction type: TPC-B (sort of)
scaling factor: 1
number of clients: 1
number of transactions per client: 1000
number of transactions actually processed: 1000/1000
tps = 12.843274(including connections establishing)
tps = 12.864183(excluding connections establishing)
$ pgbench -c 10 -t 100 bench
starting vacuum...end.
transaction type: TPC-B (sort of)
scaling factor: 1
number of clients: 10
number of transactions per client: 100
number of transactions actually processed: 1000/1000
tps = 12.593353(including connections establishing)
tps = 12.676020(excluding connections establishing)

7.0.2, with -F

$ pgbench -p 5432 -t 1000 bench
starting vacuum...end.
transaction type: TPC-B (sort of)
scaling factor: 1
number of clients: 1
number of transactions per client: 1000
number of transactions actually processed: 1000/1000
tps = 48.925826(including connections establishing)
tps = 49.199684(excluding connections establishing)
$ pgbench -p 5432 -c 10 -t 100 bench
starting vacuum...end.
transaction type: TPC-B (sort of)
scaling factor: 1
number of clients: 10
number of transactions per client: 100
number of transactions actually processed: 1000/1000
tps = 43.664810(including connections establishing)
tps = 45.067229(excluding connections establishing)

7.0.2, without -F

$ pgbench -p 5432 -t 1000 bench
starting vacuum...end.
transaction type: TPC-B (sort of)
scaling factor: 1
number of clients: 1
number of transactions per client: 1000
number of transactions actually processed: 1000/1000
tps = 5.678665(including connections establishing)
tps = 5.682127(excluding connections establishing)
$ pgbench -p 5432 -c 10 -t 100 bench
starting vacuum...end.
transaction type: TPC-B (sort of)
scaling factor: 1
number of clients: 10
number of transactions per client: 100
number of transactions actually processed: 1000/1000
tps = 5.780491(including connections establishing)
tps = 5.796646(excluding connections establishing)


In short, about 2x faster when you compare the fsync (no -F) cases,
but slower when you compare the no-fsync cases.  This may just be
because current sources have to do more I/O to write the WAL log as
well as the data files, but I'm not convinced of that... trying to
get some profile info ...

            regards, tom lane
BTW, what -B setting were you running the postmaster with?  While poking
at this, I was reminded that having adequate buffer space really makes
a considerable difference ... especially under WAL, where it's not
necessary to flush dirty buffers to disk at the end of each transaction.
The default -B 64 is certainly too small to get reasonable performance.
I got roughly twice the tps reading (pgbench -t 1000, with -F) at -B 1024.

            regards, tom lane
> -----Original Message-----
> From: Tom Lane [mailto:tgl@sss.pgh.pa.us]
> I got roughly twice the tps reading (pgbench -t 1000, with
> -F) at -B 1024.
>
I tried -B 1024 and got roughly the same results (~50 tps). However, when I change WAL option commit_delay from the default of 5 to 0, I get ~200 tps (which is double what I get with 7.03). I'm not sure I want to do this, do I?
Peter
The <varname>COMMIT_DELAY</varname> parameter defines for how long
the backend will be forced to sleep after writing a commit record
to the log with <function>LogInsert</function> call but before
performing a <function>LogFlush</function>. This delay allows other
backends to add their commit records to the log so as to have all
of them flushed with a single log sync. Unfortunately, this
mechanism is not fully implemented at release 7.1, so there is at
present no point in changing this parameter from its default value
of 5 microseconds.
"Schmidt, Peter" <peter.schmidt@prismedia.com> writes:
> I tried -B 1024 and got roughly the same results (~50 tps).

What were you using before?

> However, when I change WAL option commit_delay from the default of 5
> to 0, I get ~200 tps (which is double what I get with 7.03). I'm not
> sure I want to do this, do I?

Hmm.  There have been several discussions about whether CommitDelay is
a good idea or not.  What happens if you vary it --- try 1 microsecond,
and then various multiples of 1000.  I suspect you may find that there
is no difference in the range 1..10000, then a step, then no change up
to 20000.  In other words, your kernel may be rounding the delay up to
the next multiple of a clock tick, which might be 10 milliseconds.
That would explain a 50-tps limit real well...

BTW, have you tried pgbench with multiple clients (-c) rather than just
one?

            regards, tom lane
[ Charset ISO-8859-1 unsupported, converting... ]
>
>
> > -----Original Message-----
> > From: Tom Lane [mailto:tgl@sss.pgh.pa.us]
> > I got roughly twice the tps reading (pgbench -t 1000, with
> > -F) at -B 1024.
> >
>
> I tried -B 1024 and got roughly the same results (~50 tps). However, when I
> change WAL option commit_delay from the default of 5 to 0, I get ~200 tps
> (which is double what I get with 7.03). I'm not sure I want to do this, do
> I?
>
> Peter
>
> The <varname>COMMIT_DELAY</varname> parameter defines for how long
>    the backend will be forced to sleep after writing a commit record
>    to the log with <function>LogInsert</function> call but before
>    performing a <function>LogFlush</function>. This delay allows other
>    backends to add their commit records to the log so as to have all
>    of them flushed with a single log sync. Unfortunately, this
>    mechanism is not fully implemented at release 7.1, so there is at
>    present no point in changing this parameter from its default value
>    of 5 microseconds.

Woh, I could swear we were going for zero delay for this parameter for
7.1.  The idea was that we should look to see if other backends are
about to commit before doing the delay.  If we don't have time to code
that, the delay itself it just a throttle on performance.  I recommend
setting the default to zero, which is what I thought Vadim agreed to.


--
  Bruce Momjian                        |  http://candle.pha.pa.us
  pgman@candle.pha.pa.us               |  (610) 853-3000
  +  If your life is a hard drive,     |  830 Blythe Avenue
  +  Christ can be your backup.        |  Drexel Hill, Pennsylvania 19026
> The <varname>COMMIT_DELAY</varname> parameter defines for how long
>    the backend will be forced to sleep after writing a commit record
>    to the log with <function>LogInsert</function> call but before
>    performing a <function>LogFlush</function>. This delay allows other
>    backends to add their commit records to the log so as to have all
>    of them flushed with a single log sync. Unfortunately, this
>    mechanism is not fully implemented at release 7.1, so there is at
>    present no point in changing this parameter from its default value
>    of 5 microseconds.

Yes, I see Vadim mentioned the 5 microsecond default, and that was after
we already talked about it, so I guess he still wants the 5 to be there.

My idea was to see if another backend was near a commit, and only wait
in those cases.  We certainly can't keep the code as it is for 7.1
final.

--
  Bruce Momjian                        |  http://candle.pha.pa.us
  pgman@candle.pha.pa.us               |  (610) 853-3000
  +  If your life is a hard drive,     |  830 Blythe Avenue
  +  Christ can be your backup.        |  Drexel Hill, Pennsylvania 19026
> -----Original Message-----
> From: Tom Lane [mailto:tgl@sss.pgh.pa.us]
> Sent: Friday, February 16, 2001 7:13 PM
> To: Schmidt, Peter
> Cc: 'Bruce Momjian'; 'Michael Ansley'; 'pgsql-admin@postgresql.org'
> Subject: Re: [ADMIN] v7.1b4 bad performance
>
>
> "Schmidt, Peter" <peter.schmidt@prismedia.com> writes:
> > I tried -B 1024 and got roughly the same results (~50 tps).
>
> What were you using before?
>
> > However, when I change WAL option commit_delay from the default of 5
> > to 0, I get ~200 tps (which is double what I get with 7.03). I'm not
> > sure I want to do this, do I?
>
> Hmm. There have been several discussions about whether CommitDelay is
> a good idea or not. What happens if you vary it --- try 1
> microsecond,
> and then various multiples of 1000. I suspect you may find that there
> is no difference in the range 1..10000, then a step, then no change up
> to 20000. In other words, your kernel may be rounding the delay up to
> the next multiple of a clock tick, which might be 10 milliseconds.
> That would explain a 50-tps limit real well...
>
> BTW, have you tried pgbench with multiple clients (-c) rather
> than just
> one?
>
> regards, tom lane
>
I get ~50 tps for any commit_delay value > 0. I've tried many values in the range 0 - 999, and always get ~50 tps. commit_delay=0 always gets me ~200+ tps.
Yes, I have tried multiple clients but got stuck on the glaring difference between versions with a single client. The tests that I ran showed the same kind of results you got earlier today i.e. 1 client/1000 transactions = 10 clients/100 transactions.
So, is it OK to use commit_delay=0?
Peter
> I get ~50 tps for any commit_delay value > 0. I've tried many values in the
> range 0 - 999, and always get ~50 tps. commit_delay=0 always gets me ~200+
> tps.
>
> Yes, I have tried multiple clients but got stuck on the glaring difference
> between versions with a single client. The tests that I ran showed the same
> kind of results you got earlier today i.e. 1 client/1000 transactions = 10
> clients/100 transactions.
>
> So, is it OK to use commit_delay=0?

commit_delay was designed to provide better performance in multi-user
workloads.  If you are going to use it with only a single backend, you
certainly should set it to zero.  If you will have multiple backends
committing at the same time, we are not sure if 5 or 0 is the right
value.  If multi-user benchmark shows 0 is faster, we may change the
default.

--
  Bruce Momjian                        |  http://candle.pha.pa.us
  pgman@candle.pha.pa.us               |  (610) 853-3000
  +  If your life is a hard drive,     |  830 Blythe Avenue
  +  Christ can be your backup.        |  Drexel Hill, Pennsylvania 19026
> BTW, have you tried pgbench with multiple clients (-c) rather
> than just
> one?
>
> regards, tom lane
I was wrong about multiple clients...
I've seen as many as 230 tps with CommitDelay=0.
Peter
number of clients: 100
number of transactions per client: 10
number of transactions actually processed: 1000/1000
tps = 47.763389(including connections establishing)
tps = 50.660709(excluding connections establishing)
number of clients: 50
number of transactions per client: 20
number of transactions actually processed: 1000/1000
tps = 76.521240(including connections establishing)
tps = 79.924979(excluding connections establishing)
number of clients: 10
number of transactions per client: 100
number of transactions actually processed: 1000/1000
tps = 103.444345(including connections establishing)
tps = 104.723556(excluding connections establishing)
number of clients: 1
number of transactions per client: 1000
number of transactions actually processed: 1000/1000
tps = 172.223961(including connections establishing)
tps = 172.774743(excluding connections establishing)
"Schmidt, Peter" <peter.schmidt@prismedia.com> writes:
> So, is it OK to use commit_delay=0?

Certainly.  In fact, I think that's about to become the default ;-)

I have now experimented with several different platforms --- HPUX,
FreeBSD, and two considerably different strains of Linux --- and I find
that the minimum delay supported by select(2) is 10 or more milliseconds
on all of them, as much as 20 msec on some popular platforms.  Try it
yourself (my test program is attached).

Thus, our past arguments about whether a few microseconds of delay
before commit are a good idea seem moot; we do not have any portable way
of implementing that, and a ten millisecond delay for commit is clearly
Not Good.

            regards, tom lane


/* To use: gcc test.c, then

    time ./a.out N

N=0 should return almost instantly, if your select(2) does not block as
per spec.  N=1 shows the minimum achievable delay, * 1000 --- for
example, if time reports the elapsed time as 10 seconds, then select
has rounded your 1-microsecond delay request up to 10 milliseconds.

Some Unixen seem to throw in an extra ten millisec of delay just for
good measure, eg, on FreeBSD 4.2 N=1 takes 20 sec, N=20000 takes 30.
*/

#include <stdio.h>
#include <stdlib.h>
#include <sys/stat.h>
#include <sys/time.h>
#include <sys/types.h>

int main(int argc, char** argv)
{
    struct timeval    delay;
    int i, del;

    del = atoi(argv[1]);

    for (i = 0; i < 1000; i++) {
        delay.tv_sec = 0;
        delay.tv_usec = del;
        (void) select(0, NULL, NULL, NULL, &delay);
    }
    return 0;
}
Okay, am going to guess that all four of these results are with
CommitDelay=0, and for each higher number of clients, the results get
better and better ... what if you increase CommitDelay back to 5, for
those various levels of client connections?

On Fri, 16 Feb 2001, Schmidt, Peter wrote:

>
>
> > BTW, have you tried pgbench with multiple clients (-c) rather
> > than just
> > one?
> >
> >             regards, tom lane
>
> I was wrong about multiple clients...
> I've seen as many as 230 tps with CommitDelay=0.
> Peter
>
> number of clients: 100
> number of transactions per client: 10
> number of transactions actually processed: 1000/1000
> tps = 47.763389(including connections establishing)
> tps = 50.660709(excluding connections establishing)
>
> number of clients: 50
> number of transactions per client: 20
> number of transactions actually processed: 1000/1000
> tps = 76.521240(including connections establishing)
> tps = 79.924979(excluding connections establishing)
>
> number of clients: 10
> number of transactions per client: 100
> number of transactions actually processed: 1000/1000
> tps = 103.444345(including connections establishing)
> tps = 104.723556(excluding connections establishing)
>
> number of clients: 1
> number of transactions per client: 1000
> number of transactions actually processed: 1000/1000
> tps = 172.223961(including connections establishing)
> tps = 172.774743(excluding connections establishing)
>

Marc G. Fournier                   ICQ#7615664               IRC Nick: Scrappy
Systems Administrator @ hub.org
primary: scrappy@hub.org           secondary: scrappy@{freebsd|postgresql}.org
> -----Original Message-----
> From: The Hermit Hacker [mailto:scrappy@hub.org]
> Okay, am going to guess that all four of these results are with
> CommitDelay=0,
You guessed right. Here are results for ComitDelay=5.
Peter
number of clients: 100
number of transactions per client: 10
number of transactions actually processed: 1000/1000
tps = 24.302740(including connections establishing)
tps = 24.972620(excluding connections establishing)
number of clients: 50
number of transactions per client: 20
number of transactions actually processed: 1000/1000
tps = 29.500925(including connections establishing)
tps = 30.002143(excluding connections establishing)
number of clients: 10
number of transactions per client: 100
number of transactions actually processed: 1000/1000
tps = 36.948563(including connections establishing)
tps = 37.118906(excluding connections establishing)
number of clients: 1
number of transactions per client: 1000
number of transactions actually processed: 1000/1000
tps = 46.671071(including connections establishing)
tps = 46.713340(excluding connections establishing)
I wrote:
> Thus, our past arguments about whether a few microseconds of delay
> before commit are a good idea seem moot; we do not have any portable way
> of implementing that, and a ten millisecond delay for commit is clearly
> Not Good.

I've now finished running a spectrum of pgbench scenarios, and I find
no case in which commit_delay = 0 is worse than commit_delay > 0.
Now this is just one benchmark on just one platform, but it's pretty
damning...

Platform: HPUX 10.20 on HPPA C180, fast wide SCSI discs, 7200rpm (I think).
Minimum select(2) delay is 10 msec on this platform.

POSTMASTER OPTIONS: -i -B 1024 -N 100

$ PGOPTIONS='-c commit_delay=1' pgbench -c 1 -t 1000 bench
tps = 13.304624(including connections establishing)
tps = 13.323967(excluding connections establishing)

$ PGOPTIONS='-c commit_delay=0' pgbench -c 1 -t 1000 bench
tps = 16.614691(including connections establishing)
tps = 16.645832(excluding connections establishing)

$ PGOPTIONS='-c commit_delay=1' pgbench -c 10 -t 100 bench
tps = 13.612502(including connections establishing)
tps = 13.712996(excluding connections establishing)

$ PGOPTIONS='-c commit_delay=0' pgbench -c 10 -t 100 bench
tps = 14.674477(including connections establishing)
tps = 14.787715(excluding connections establishing)

$ PGOPTIONS='-c commit_delay=1' pgbench -c 30 -t 100 bench
tps = 10.875912(including connections establishing)
tps = 10.932836(excluding connections establishing)

$ PGOPTIONS='-c commit_delay=0' pgbench -c 30 -t 100 bench
tps = 12.853009(including connections establishing)
tps = 12.934365(excluding connections establishing)

$ PGOPTIONS='-c commit_delay=1' pgbench -c 50 -t 100 bench
tps = 9.476856(including connections establishing)
tps = 9.520800(excluding connections establishing)

$ PGOPTIONS='-c commit_delay=0' pgbench -c 50 -t 100 bench
tps = 9.807925(including connections establishing)
tps = 9.854161(excluding connections establishing)

With -F (no fsync), it's the same story:

POSTMASTER OPTIONS: -i -o -F -B 1024 -N 100

$ PGOPTIONS='-c commit_delay=1' pgbench -c 1 -t 1000 bench
tps = 40.584300(including connections establishing)
tps = 40.708855(excluding connections establishing)

$ PGOPTIONS='-c commit_delay=0' pgbench -c 1 -t 1000 bench
tps = 51.585629(including connections establishing)
tps = 51.797280(excluding connections establishing)

$ PGOPTIONS='-c commit_delay=1' pgbench -c 10 -t 100 bench
tps = 35.811729(including connections establishing)
tps = 36.448439(excluding connections establishing)

$ PGOPTIONS='-c commit_delay=0' pgbench -c 10 -t 100 bench
tps = 43.878827(including connections establishing)
tps = 44.856029(excluding connections establishing)

$ PGOPTIONS='-c commit_delay=1' pgbench -c 30 -t 100 bench
tps = 23.490464(including connections establishing)
tps = 23.749558(excluding connections establishing)

$ PGOPTIONS='-c commit_delay=0' pgbench -c 30 -t 100 bench
tps = 23.452935(including connections establishing)
tps = 23.716181(excluding connections establishing)


I vote for commit_delay = 0, unless someone can show cases where
positive delay is significantly better than zero delay.

            regards, tom lane
Tatsuo Ishii <t-ishii@sra.co.jp> writes:
> I agree with Tom. I did some benchmarking tests using pgbench for a
> computer magazine in Japan. I got a almost equal or better result for
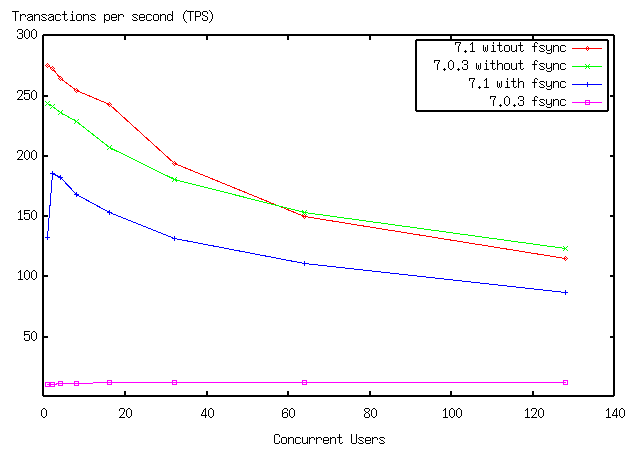
> 7.1 than 7.0.3 if commit_delay=0. See included png file.
Interesting curves. One thing you might like to know is that while
poking around with a profiler this afternoon, I found that the vast
majority of the work done for this benchmark is in the uniqueness
checks driven by the unique indexes. Declare those as plain (non
unique) and the TPS figures would probably go up noticeably. That
doesn't make the test invalid, but it does suggest that pgbench is
emphasizing one aspect of system performance to the exclusion of
others ...
regards, tom lane
My understanding is that the TPC-3 test are not about complex SQL, they are about transaction benching, and as such, it doesn't need to be complex SQL, it just needs to test the transactional speed of the engine. The pgbench appears to be a relatively simple TPC-3 test, which is great, because it's a good starting point. However, the changes made in 7.1 (especially WAL) should make a difference in the performance, complex SQL or not. I haven't completed the testing yet on my dev machine (still getting the hang of running two installations of PG on a single machine at the same time), but as soon as I get it all up (should be by the end of the weekend), we can take a closer look, especially at differences in hardware.
MikeA
-----Original Message-----
From: Bruce Momjian
To: Schmidt, Peter
Cc: 'Tom Lane'; 'Michael Ansley'; 'pgsql-admin@postgresql.org'
Sent: 2-16-01 10:26 PM
Subject: Re: [ADMIN] v7.1b4 bad performance
> > This is very strange. Is there any specific query that is causing
the
> > problem? Does EXPLAIN show the same output on both versions?
> >
>
>
> "pgbench" doesn't execute any complex sql...
>
> Explain shows exactly the same output for both versions(7.03 & 7.1b4):
I see. That is bad. All other reports have been that 7.1b4 is faster
than 7.0.X. I am stumped.
--
Bruce Momjian | http://candle.pha.pa.us
pgman@candle.pha.pa.us | (610) 853-3000
+ If your life is a hard drive, | 830 Blythe Avenue
+ Christ can be your backup. | Drexel Hill, Pennsylvania
19026
 **********************************************************************
 This email and any files transmitted with it are confidential and
 intended solely for the use of the individual or entity to whom they
 are addressed. If you have received this email in error please notify
 Nick West - Global Infrastructure Manager.

 This footnote also confirms that this email message has been swept by
 MIMEsweeper for the presence of computer viruses.

 www.mimesweeper.com
 **********************************************************************
* Tom Lane <tgl@sss.pgh.pa.us> [010216 22:49]:
> "Schmidt, Peter" <peter.schmidt@prismedia.com> writes:
> > So, is it OK to use commit_delay=0?
>
> Certainly.  In fact, I think that's about to become the default ;-)
>
> I have now experimented with several different platforms --- HPUX,
> FreeBSD, and two considerably different strains of Linux --- and I find
> that the minimum delay supported by select(2) is 10 or more milliseconds
> on all of them, as much as 20 msec on some popular platforms.  Try it
> yourself (my test program is attached).
>
> Thus, our past arguments about whether a few microseconds of delay
> before commit are a good idea seem moot; we do not have any portable way
> of implementing that, and a ten millisecond delay for commit is clearly
> Not Good.
>
>             regards, tom lane
Here is another one.  UnixWare 7.1.1 on a P-III 500 256 Meg Ram:

$ cc -o tgl.test -O tgl.test.c
$ time ./tgl.test 0

real    0m0.01s
user    0m0.01s
sys     0m0.00s
$ time ./tgl.test 1

real    0m10.01s
user    0m0.00s
sys     0m0.01s
$ time ./tgl.test 2

real    0m10.01s
user    0m0.00s
sys     0m0.00s
$ time ./tgl.test 3

real    0m10.11s
user    0m0.00s
sys     0m0.01s
$ uname -a
UnixWare lerami 5 7.1.1 i386 x86at SCO UNIX_SVR5
$

--
Larry Rosenman                     http://www.lerctr.org/~ler
Phone: +1 972-414-9812                 E-Mail: ler@lerctr.org
US Mail: 1905 Steamboat Springs Drive, Garland, TX 75044-6749
I would consider this perfectly acceptable. Official benchmarks can only be without the -F switch prior to 7.1, so in raw performance terms (with acceptable safety) you have to compare 7.0.2 without -F to 7.1beta4 with -F, because those are the fastest configurations with acceptable recovery. However, I would also expect 7.0.2 -F to be faster than 7.1beta4 -F, because 7.1beta4 is doing more (WAL specifically). Over the same plans, the engine is doing more work, so must be slower.
Thoughts...
MikeA
-----Original Message-----
From: Tom Lane
To: Schmidt, Peter
Cc: 'Bruce Momjian'; 'Michael Ansley'; 'pgsql-admin@postgresql.org'
Sent: 2-16-01 11:40 PM
Subject: Re: [ADMIN] v7.1b4 bad performance
FWIW, I get the following pgbench results on my machine (HPPA C180,
fast-wide-SCSI drives that I do not recall the specs for):
current sources, with -F
$ pgbench -t 1000 bench
starting vacuum...end.
transaction type: TPC-B (sort of)
scaling factor: 1
number of clients: 1
number of transactions per client: 1000
number of transactions actually processed: 1000/1000
tps = 26.493155(including connections establishing)
tps = 26.558319(excluding connections establishing)
$ pgbench -c 10 -t 100 bench
starting vacuum...end.
transaction type: TPC-B (sort of)
scaling factor: 1
number of clients: 10
number of transactions per client: 100
number of transactions actually processed: 1000/1000
tps = 25.812518(including connections establishing)
tps = 26.161266(excluding connections establishing)
current sources, without -F
$ pgbench -t 1000 bench
starting vacuum...end.
transaction type: TPC-B (sort of)
scaling factor: 1
number of clients: 1
number of transactions per client: 1000
number of transactions actually processed: 1000/1000
tps = 12.843274(including connections establishing)
tps = 12.864183(excluding connections establishing)
$ pgbench -c 10 -t 100 bench
starting vacuum...end.
transaction type: TPC-B (sort of)
scaling factor: 1
number of clients: 10
number of transactions per client: 100
number of transactions actually processed: 1000/1000
tps = 12.593353(including connections establishing)
tps = 12.676020(excluding connections establishing)
7.0.2, with -F
$ pgbench -p 5432 -t 1000 bench
starting vacuum...end.
transaction type: TPC-B (sort of)
scaling factor: 1
number of clients: 1
number of transactions per client: 1000
number of transactions actually processed: 1000/1000
tps = 48.925826(including connections establishing)
tps = 49.199684(excluding connections establishing)
$ pgbench -p 5432 -c 10 -t 100 bench
starting vacuum...end.
transaction type: TPC-B (sort of)
scaling factor: 1
number of clients: 10
number of transactions per client: 100
number of transactions actually processed: 1000/1000
tps = 43.664810(including connections establishing)
tps = 45.067229(excluding connections establishing)
7.0.2, without -F
$ pgbench -p 5432 -t 1000 bench
starting vacuum...end.
transaction type: TPC-B (sort of)
scaling factor: 1
number of clients: 1
number of transactions per client: 1000
number of transactions actually processed: 1000/1000
tps = 5.678665(including connections establishing)
tps = 5.682127(excluding connections establishing)
$ pgbench -p 5432 -c 10 -t 100 bench
starting vacuum...end.
transaction type: TPC-B (sort of)
scaling factor: 1
number of clients: 10
number of transactions per client: 100
number of transactions actually processed: 1000/1000
tps = 5.780491(including connections establishing)
tps = 5.796646(excluding connections establishing)
In short, about 2x faster when you compare the fsync (no -F) cases,
but slower when you compare the no-fsync cases. This may just be
because current sources have to do more I/O to write the WAL log as
well as the data files, but I'm not convinced of that... trying to
get some profile info ...
regards, tom lane
 **********************************************************************
 This email and any files transmitted with it are confidential and
 intended solely for the use of the individual or entity to whom they
 are addressed. If you have received this email in error please notify
 Nick West - Global Infrastructure Manager.

 This footnote also confirms that this email message has been swept by
 MIMEsweeper for the presence of computer viruses.

 www.mimesweeper.com
 **********************************************************************
Michael Ansley <Michael.Ansley@intec-telecom-systems.com> writes:
> I would consider this perfectly acceptable.  Official benchmarks can only be
> without the -F switch prior to 7.1, so in raw performance terms (with
> acceptable safety) you have to compare 7.0.2 without -F to 7.1beta4 with -F,
> because those are the fastest configurations with acceptable recovery.

How's that again?  7.1 with -F is just as much at the mercy of a system
crash as previous releases with -F, because it's not fsync'ing the WAL
log.  In either case, -F is only for those who trust their hardware + OS
+ UPS, or perhaps are running development systems and care more for
speed than data recoverability.

> However, I would also expect 7.0.2 -F to be faster than 7.1beta4 -F, because
> 7.1beta4 is doing more (WAL specifically).  Over the same plans, the engine
> is doing more work, so must be slower.

No, because 7.1 is able to batch writes to data files over multiple
transactions, given enough buffer space (larger -B makes more difference
than it used to).  That buys back some or all of the performance lost to
WAL logfile writes.  See Tatsuo's curves, and the similar numbers posted
by myself and Peter Schmidt.  On that one benchmark, at least, 7.1 is
not slower, even with -F.  (Given zero commit_delay, anyway ;-))

            regards, tom lane
I thought that -F only turned off the shared mem fsyncing. Obviously not. I'll rethink my analysis ;-)
-----Original Message-----
From: Tom Lane
To: Michael Ansley
Cc: 'Schmidt, Peter '; ''Bruce Momjian' '; ''pgsql-admin@postgresql.org' '
Sent: 2-17-01 4:13 PM
Subject: Re: [ADMIN] v7.1b4 bad performance
Michael Ansley <Michael.Ansley@intec-telecom-systems.com> writes:
> I would consider this perfectly acceptable. Official benchmarks can
only be
> without the -F switch prior to 7.1, so in raw performance terms (with
> acceptable safety) you have to compare 7.0.2 without -F to 7.1beta4
with -F,
> because those are the fastest configurations with acceptable recovery.
How's that again? 7.1 with -F is just as much at the mercy of a system
crash as previous releases with -F, because it's not fsync'ing the WAL
log. In either case, -F is only for those who trust their hardware + OS
+ UPS, or perhaps are running development systems and care more for
speed than data recoverability.
> However, I would also expect 7.0.2 -F to be faster than 7.1beta4 -F,
because
> 7.1beta4 is doing more (WAL specifically). Over the same plans, the
engine
> is doing more work, so must be slower.
No, because 7.1 is able to batch writes to data files over multiple
transactions, given enough buffer space (larger -B makes more difference
than it used to). That buys back some or all of the performance lost to
WAL logfile writes. See Tatsuo's curves, and the similar numbers posted
by myself and Peter Schmidt. On that one benchmark, at least, 7.1 is
not slower, even with -F. (Given zero commit_delay, anyway ;-))
regards, tom lane
 **********************************************************************
 This email and any files transmitted with it are confidential and
 intended solely for the use of the individual or entity to whom they
 are addressed. If you have received this email in error please notify
 Nick West - Global Infrastructure Manager.

 This footnote also confirms that this email message has been swept by
 MIMEsweeper for the presence of computer viruses.

 www.mimesweeper.com
 **********************************************************************
On Sat, 17 Feb 2001, Tom Lane wrote:

[skip]

TL> Platform: HPUX 10.20 on HPPA C180, fast wide SCSI discs, 7200rpm (I think).
TL> Minimum select(2) delay is 10 msec on this platform.

[skip]

TL> I vote for commit_delay = 0, unless someone can show cases where
TL> positive delay is significantly better than zero delay.

BTW, for modern versions of FreeBSD kernels, there is HZ kernel option
which describes maximum timeslice granularity (actually, HZ value is
number of timeslice periods per second, with default of 100 = 10 ms). On
modern CPUs HZ may be increased to at least 1000, and sometimes even to
5000 (unfortunately, I haven't test platform by hand).

So, maybe you can test select granularity at ./configure phase and then
define default commit_delay accordingly.

Your thoughts?

Sincerely,
D.Marck                                   [DM5020, DM268-RIPE, DM3-RIPN]
------------------------------------------------------------------------
*** Dmitry Morozovsky --- D.Marck --- Wild Woozle --- marck@rinet.ru ***
------------------------------------------------------------------------
> TL> I vote for commit_delay = 0, unless someone can show cases where
> TL> positive delay is significantly better than zero delay.
>
> BTW, for modern versions of FreeBSD kernels, there is HZ kernel option
> which describes maximum timeslice granularity (actually, HZ value is
> number of timeslice periods per second, with default of 100 = 10 ms). On
> modern CPUs HZ may be increased to at least 1000, and sometimes even to
> 5000 (unfortunately, I haven't test platform by hand).
>
> So, maybe you can test select granularity at ./configure phase and then
> define default commit_delay accordingly.

According to the BSD4.4 book by Karels/McKusick, even though computers
are faster now, increasing the Hz doesn't seem to improve performance.
This is probably because of cache misses from context switches.

--
  Bruce Momjian                        |  http://candle.pha.pa.us
  pgman@candle.pha.pa.us               |  (610) 853-3000
  +  If your life is a hard drive,     |  830 Blythe Avenue
  +  Christ can be your backup.        |  Drexel Hill, Pennsylvania 19026
On Sun, 18 Feb 2001, Dmitry Morozovsky wrote:

I just done the experiment with increasing HZ to 1000 on my own machine
(PII 374). Your test program reports 2 ms instead of 20. The other side
of increasing HZ is surely more overhead to scheduler system. Anyway, it's
a bit of data to dig into, I suppose ;-)

Results for pgbench with 7.1b4: (BTW, machine is FreeBSD 4-stable on IBM
DTLA IDE in ATA66 mode with tag queueing and soft updates turned on)

>> default delay (5 us)

number of clients: 1
number of transactions per client: 1000
number of transactions actually processed: 1000/1000
tps = 96.678008(including connections establishing)
tps = 96.982619(excluding connections establishing)

number of clients: 10
number of transactions per client: 100
number of transactions actually processed: 1000/1000
tps = 77.538398(including connections establishing)
tps = 79.126914(excluding connections establishing)

number of clients: 20
number of transactions per client: 50
number of transactions actually processed: 1000/1000
tps = 68.448429(including connections establishing)
tps = 70.957500(excluding connections establishing)

>> delay of 0

number of clients: 1
number of transactions per client: 1000
number of transactions actually processed: 1000/1000
tps = 111.939751(including connections establishing)
tps = 112.335089(excluding connections establishing)

number of clients: 10
number of transactions per client: 100
number of transactions actually processed: 1000/1000
tps = 84.262936(including connections establishing)
tps = 86.152702(excluding connections establishing)

number of clients: 20
number of transactions per client: 50
number of transactions actually processed: 1000/1000
tps = 79.678831(including connections establishing)
tps = 83.106418(excluding connections establishing)


Results are very close... Another thing to dig into.

BTW, postgres parameters were: -B 256 -F -i -S


DM> BTW, for modern versions of FreeBSD kernels, there is HZ kernel option
DM> which describes maximum timeslice granularity (actually, HZ value is
DM> number of timeslice periods per second, with default of 100 = 10 ms). On
DM> modern CPUs HZ may be increased to at least 1000, and sometimes even to
DM> 5000 (unfortunately, I haven't test platform by hand).
DM>
DM> So, maybe you can test select granularity at ./configure phase and then
DM> define default commit_delay accordingly.
DM>
DM> Your thoughts?
DM>
DM> Sincerely,
DM> D.Marck                                   [DM5020, DM268-RIPE, DM3-RIPN]
DM> ------------------------------------------------------------------------
DM> *** Dmitry Morozovsky --- D.Marck --- Wild Woozle --- marck@rinet.ru ***
DM> ------------------------------------------------------------------------
DM>

Sincerely,
D.Marck                                   [DM5020, DM268-RIPE, DM3-RIPN]
------------------------------------------------------------------------
*** Dmitry Morozovsky --- D.Marck --- Wild Woozle --- marck@rinet.ru ***
------------------------------------------------------------------------
On Sun, 18 Feb 2001, Dmitry Morozovsky wrote:

DM> I just done the experiment with increasing HZ to 1000 on my own machine
DM> (PII 374). Your test program reports 2 ms instead of 20. The other side
DM> of increasing HZ is surely more overhead to scheduler system. Anyway, it's
DM> a bit of data to dig into, I suppose ;-)
DM>
DM> Results for pgbench with 7.1b4: (BTW, machine is FreeBSD 4-stable on IBM
DM> DTLA IDE in ATA66 mode with tag queueing and soft updates turned on)

Oh, I forgot to paste the results from original system (with HZ=100). Here
they are:

>> delay = 5

number of clients: 1
number of transactions per client: 1000
number of transactions actually processed: 1000/1000
tps = 47.422866(including connections establishing)
tps = 47.493439(excluding connections establishing)

number of clients: 10
number of transactions per client: 100
number of transactions actually processed: 1000/1000
tps = 37.930605(including connections establishing)
tps = 38.308613(excluding connections establishing)

number of clients: 20
number of transactions per client: 50
number of transactions actually processed: 1000/1000
tps = 35.757531(including connections establishing)
tps = 36.420532(excluding connections establishing)

>> delay = 0

number of clients: 1
number of transactions per client: 1000
number of transactions actually processed: 1000/1000
tps = 111.521859(including connections establishing)
tps = 111.904026(excluding connections establishing)

number of clients: 10
number of transactions per client: 100
number of transactions actually processed: 1000/1000
tps = 62.808216(including connections establishing)
tps = 63.819590(excluding connections establishing)

number of clients: 20
number of transactions per client: 50
number of transactions actually processed: 1000/1000
tps = 64.250431(including connections establishing)
tps = 66.438067(excluding connections establishing)


So, I suppose (very preliminary, of course ;):

1 -  at least for dedicated PostgreSQL servers it _may_ be
reasonable to increase HZ
2 - there is still no advantages of using delay != 0.

Your ideas?


DM>
DM> >> default delay (5 us)
DM>
DM> number of clients: 1
DM> number of transactions per client: 1000
DM> number of transactions actually processed: 1000/1000
DM> tps = 96.678008(including connections establishing)
DM> tps = 96.982619(excluding connections establishing)
DM>
DM> number of clients: 10
DM> number of transactions per client: 100
DM> number of transactions actually processed: 1000/1000
DM> tps = 77.538398(including connections establishing)
DM> tps = 79.126914(excluding connections establishing)
DM>
DM> number of clients: 20
DM> number of transactions per client: 50
DM> number of transactions actually processed: 1000/1000
DM> tps = 68.448429(including connections establishing)
DM> tps = 70.957500(excluding connections establishing)
DM>
DM> >> delay of 0
DM>
DM> number of clients: 1
DM> number of transactions per client: 1000
DM> number of transactions actually processed: 1000/1000
DM> tps = 111.939751(including connections establishing)
DM> tps = 112.335089(excluding connections establishing)
DM>
DM> number of clients: 10
DM> number of transactions per client: 100
DM> number of transactions actually processed: 1000/1000
DM> tps = 84.262936(including connections establishing)
DM> tps = 86.152702(excluding connections establishing)
DM>
DM> number of clients: 20
DM> number of transactions per client: 50
DM> number of transactions actually processed: 1000/1000
DM> tps = 79.678831(including connections establishing)
DM> tps = 83.106418(excluding connections establishing)
DM>
DM>
DM> Results are very close... Another thing to dig into.
DM>
DM> BTW, postgres parameters were: -B 256 -F -i -S
DM>
DM>
DM>
DM>
DM> DM> BTW, for modern versions of FreeBSD kernels, there is HZ kernel option
DM> DM> which describes maximum timeslice granularity (actually, HZ value is
DM> DM> number of timeslice periods per second, with default of 100 = 10 ms). On
DM> DM> modern CPUs HZ may be increased to at least 1000, and sometimes even to
DM> DM> 5000 (unfortunately, I haven't test platform by hand).
DM> DM>
DM> DM> So, maybe you can test select granularity at ./configure phase and then
DM> DM> define default commit_delay accordingly.
DM> DM>
DM> DM> Your thoughts?
DM> DM>
DM> DM> Sincerely,
DM> DM> D.Marck                                   [DM5020, DM268-RIPE, DM3-RIPN]
DM> DM> ------------------------------------------------------------------------
DM> DM> *** Dmitry Morozovsky --- D.Marck --- Wild Woozle --- marck@rinet.ru ***
DM> DM> ------------------------------------------------------------------------
DM> DM>
DM>
DM> Sincerely,
DM> D.Marck                                   [DM5020, DM268-RIPE, DM3-RIPN]
DM> ------------------------------------------------------------------------
DM> *** Dmitry Morozovsky --- D.Marck --- Wild Woozle --- marck@rinet.ru ***
DM> ------------------------------------------------------------------------
DM>
DM>

Sincerely,
D.Marck                                   [DM5020, DM268-RIPE, DM3-RIPN]
------------------------------------------------------------------------
*** Dmitry Morozovsky --- D.Marck --- Wild Woozle --- marck@rinet.ru ***
------------------------------------------------------------------------
> "Schmidt, Peter" <peter.schmidt@prismedia.com> writes:
> > So, is it OK to use commit_delay=0?
>
> Certainly.  In fact, I think that's about to become the default ;-)

I agree with Tom. I did some benchmarking tests using pgbench for a
computer magazine in Japan. I got a almost equal or better result for
7.1 than 7.0.3 if commit_delay=0. See included png file.
--
Tatsuo Ishii
Вложения
> ... See included png file.

What kind of machine was this run on?

                     - Thomas
I did not realize how much WAL improved performance when using fsync.

> > "Schmidt, Peter" <peter.schmidt@prismedia.com> writes:
> > > So, is it OK to use commit_delay=0?
> >
> > Certainly.  In fact, I think that's about to become the default ;-)
>
> I agree with Tom. I did some benchmarking tests using pgbench for a
> computer magazine in Japan. I got a almost equal or better result for
> 7.1 than 7.0.3 if commit_delay=0. See included png file.
> --
> Tatsuo Ishii

[ Attachment, skipping... ]


--
  Bruce Momjian                        |  http://candle.pha.pa.us
  pgman@candle.pha.pa.us               |  (610) 853-3000
  +  If your life is a hard drive,     |  830 Blythe Avenue
  +  Christ can be your backup.        |  Drexel Hill, Pennsylvania 19026
Hiroshi Inoue <Inoue@tpf.co.jp> writes:
> In your test cases I always see "where bid = 1" at "update branches"
> i.e.
>   update branches set bbalance = bbalance + ... where bid = 1

> ISTM there's no multiple COMMIT in your senario-s due to
> their lock conflicts.

Hmm.  It looks like using a 'scaling factor' larger than 1 is necessary
to spread out the updates of "branches".  AFAIR, the people who reported
runs with scaling factors > 1 got pretty much the same results though.

            regards, tom lane
Hiroshi Inoue <Inoue@tpf.co.jp> writes:
> I've been suspicious if pgbench is an (unique)
> appropiriate test case for evaluaing commit_delay.

Of course it isn't.  Never trust only one benchmark.

I've asked the Great Bridge folks to run their TPC-C benchmark with both
zero and small nonzero commit_delay.  It will be a couple of days before
we have the results, however.  Can anyone else offer any comparisons
based on other multiuser benchmarks?

            regards, tom lane
Hiroshi Inoue <Inoue@tpf.co.jp> writes:
> I changed pgbench so that different connection connects
> to the different database and got the following results.

Hmm, you mean you set up a separate test database for each pgbench
"client", but all under the same postmaster?

> The results of
>     pgbench -c 10 -t 100

> [CommitDelay=0]
> 1st)tps = 18.484611(including connections establishing)
>     tps = 19.827988(excluding connections establishing)
> 2nd)tps = 18.754826(including connections establishing)
>     tps = 19.352268(excluditp connections establishing)
> 3rd)tps = 18.771225(including connections establishing)
>     tps = 19.261843(excluding connections establishing)
> [CommitDelay=1]
> 1st)tps = 20.317649(including connections establishing)
>     tps = 20.975151(excluding connections establishing)
> 2nd)tps = 24.208025(including connections establishing)
>     tps = 24.663665(excluding connections establishing)
> 3rd)tps = 25.821156(including connections establishing)
>     tps = 26.842741(excluding connections establishing)

What platform is this on --- in particular, how long a delay
is CommitDelay=1 in reality?  What -B did you use?

            regards, tom lane
On Sat, 17 Feb 2001, Tom Lane wrote:

> How's that again?  7.1 with -F is just as much at the mercy of a system
> crash as previous releases with -F, because it's not fsync'ing the WAL
> log.  In either case, -F is only for those who trust their hardware + OS
> + UPS, or perhaps are running development systems and care more for
> speed than data recoverability.

What if the WAL log is on a partition that is mounted synchronously?

M Carling
lockhart> > ... See included png file.
lockhart>
lockhart> What kind of machine was this run on?
lockhart>
lockhart>                      - Thomas

Sorry to forget to mention about that.

SONY VAIO Z505CR/K (note PC)
Pentium III 750MHz/256MB memory/20GB IDE HDD
Linux (kernel 2.2.17)
configure --enable-multibyte=EUC_JP
postgresql.conf:
        fsync = on
        max_connections = 128
        shared_buffers = 1024
        silent_mode = on
        commit_delay = 0
postmaster opts for 7.0.3:
        -B 1024 -N 128 -S
pgbench settings:
        scaling factor = 1
        data excludes connetion establishing time
        number of total transactions are always 640
               (see included scripts I ran for the testing)
------------------------------------------------------
#! /bin/sh
pgbench -i test
for i in 1 2 4 8 16 32 64 128
do
    t=`expr 640 / $i`
    pgbench -t $t -c $i test
    echo "===== sync ======"
    sync;sync;sync;sleep 10
    echo "===== sync done ======"
done
------------------------------------------------------
--
Tatsuo Ishii
Hannu Krosing <hannu@tm.ee> writes:
> Is this unmodified pgbench or has it Hiroshi tweaked behaviour of
> connecting each client to its own database, so that locking and such
> does not shade the possible benefits (was it about 15% ?) of delay>1

I didn't much like that approach to altering the test, since it also
means that all the clients are working with separate tables and hence
not able to share read I/O; that doesn't seem like it's the same
benchmark at all.  What would make more sense to me is to increase the
number of rows in the branches table.

Right now, at the default "scale factor" of 1, pgbench makes tables of
these sizes:

accounts    100000
branches    1
history        0        (filled during test)
tellers        10

It seems to me that the branches table should have at least 10 to 100
entries, and tellers about 10 times whatever branches is.  100000
accounts rows seems enough though.

Making such a change would render results not comparable with the prior
pgbench, but that would be true with Hiroshi's change too.

Alternatively we could just say that we won't believe any numbers taken
at scale factors less than, say, 10, but I doubt we really need
million-row accounts tables in order to learn anything...

            regards, tom lane
Tatsuo Ishii <t-ishii@sra.co.jp> writes:
>> It seems to me that the branches table should have at least 10 to 100
>> entries, and tellers about 10 times whatever branches is.  100000
>> accounts rows seems enough though.

> Those numbers are defined in the TPC-B spec.

Ah.  And of course, the TPC bunch never thought anyone would be
interested in the results with scale factors so tiny as one ;-),
so they didn't see any problem with it.

Okay, plan B then: let's ask people to redo their benchmarks with
-s bigger than one.  Now, how much bigger?

To the extent that you think this is a model of a real bank, it should
be obvious that the number of concurrent transactions cannot exceed the
number of tellers; there should never be any write contention on a
teller's table row, because only that teller (client) should be issuing
transactions against it.  Contention on a branch's row is realistic,
but not from more clients than there are tellers in the branch.

As a rule of thumb, then, we could say that the benchmark's results are
not to be believed for numbers of clients exceeding perhaps 5 times the
scale factor, ie, half the number of teller rows (so that it's not too
likely we will have contention on a teller row).

            regards, tom lane
Tom Lane wrote:
>
> I wrote:
> > Thus, our past arguments about whether a few microseconds of delay
> > before commit are a good idea seem moot; we do not have any portable way
> > of implementing that, and a ten millisecond delay for commit is clearly
> > Not Good.
>
> I've now finished running a spectrum of pgbench scenarios, and I find
> no case in which commit_delay = 0 is worse than commit_delay > 0.
> Now this is just one benchmark on just one platform, but it's pretty
> damning...
>

In your test cases I always see "where bid = 1" at "update branches"
i.e.
  update branches set bbalance = bbalance + ... where bid = 1

ISTM there's no multiple COMMIT in your senario-s due to
their lock conflicts.

Regards,
Hiroshi Inoue
Tom Lane wrote:
>
> Hiroshi Inoue <Inoue@tpf.co.jp> writes:
> > I've been suspicious if pgbench is an (unique)
> > appropiriate test case for evaluaing commit_delay.
>
> Of course it isn't.  Never trust only one benchmark.
>
> I've asked the Great Bridge folks to run their TPC-C benchmark with both
> zero and small nonzero commit_delay.  It will be a couple of days before
> we have the results, however.  Can anyone else offer any comparisons
> based on other multiuser benchmarks?
>

I changed pgbench so that different connection connects
to the different database and got the following results.

The results of
    pgbench -c 10 -t 100

[CommitDelay=0]
1st)tps = 18.484611(including connections establishing)
    tps = 19.827988(excluding connections establishing)
2nd)tps = 18.754826(including connections establishing)
    tps = 19.352268(excluditp connections establishing)
3rd)tps = 18.771225(including connections establishing)
    tps = 19.261843(excluding connections establishing)
[CommitDelay=1]
1st)tps = 20.317649(including connections establishing)
    tps = 20.975151(excluding connections establishing)
2nd)tps = 24.208025(including connections establishing)
    tps = 24.663665(excluding connections establishing)
3rd)tps = 25.821156(including connections establishing)
    tps = 26.842741(excluding connections establishing)

Regards,
Hiroshi Inoue
Tom Lane wrote:
>
> Hiroshi Inoue <Inoue@tpf.co.jp> writes:
> > In your test cases I always see "where bid = 1" at "update branches"
> > i.e.
> >   update branches set bbalance = bbalance + ... where bid = 1
>
> > ISTM there's no multiple COMMIT in your senario-s due to
> > their lock conflicts.
>
> Hmm.  It looks like using a 'scaling factor' larger than 1 is necessary
> to spread out the updates of "branches".  AFAIR, the people who reported
> runs with scaling factors > 1 got pretty much the same results though.
>

People seem to believe your results are decisive
and would raise your results if the evidence is
required.
All clients of pgbench execute the same sequence
of queries. There could be various conflicts e.g.
oridinary lock, buffer lock, IO spinlock ...
I've been suspicious if pgbench is an (unique)
appropiriate test case for evaluaing commit_delay.

Regards,
Hiroshi Inoue
> -----Original Message-----
> From: Tom Lane [mailto:tgl@sss.pgh.pa.us]
>
> Hiroshi Inoue <Inoue@tpf.co.jp> writes:
> > I changed pgbench so that different connection connects
> > to the different database and got the following results.
>
> Hmm, you mean you set up a separate test database for each pgbench
> "client", but all under the same postmaster?
>

Yes. Different database is to make the conflict as less as possible.
The conflict among backends is a greatest enemy of CommitDelay.

> > The results of
> >     pgbench -c 10 -t 100
>
> > [CommitDelay=0]
> > 1st)tps = 18.484611(including connections establishing)
> >     tps = 19.827988(excluding connections establishing)
> > 2nd)tps = 18.754826(including connections establishing)
> >     tps = 19.352268(excluditp connections establishing)
> > 3rd)tps = 18.771225(including connections establishing)
> >     tps = 19.261843(excluding connections establishing)
> > [CommitDelay=1]
> > 1st)tps = 20.317649(including connections establishing)
> >     tps = 20.975151(excluding connections establishing)
> > 2nd)tps = 24.208025(including connections establishing)
> >     tps = 24.663665(excluding connections establishing)
> > 3rd)tps = 25.821156(including connections establishing)
> >     tps = 26.842741(excluding connections establishing)
>
> What platform is this on --- in particular, how long a delay
> is CommitDelay=1 in reality?  What -B did you use?
>

platform) i686-pc-linux-gnu, compiled by GCC egcs-2.91.60(turbolinux 4.2)
min delay) 10msec according to your test program.
-B)  64 (all other settings are default)

Regards,
Hiroshi Inoue
Tom Lane wrote:
>
> "Hiroshi Inoue" <Inoue@tpf.co.jp> writes:
> >> Hmm, you mean you set up a separate test database for each pgbench
> >> "client", but all under the same postmaster?
>
> > Yes. Different database is to make the conflict as less as possible.
> > The conflict among backends is a greatest enemy of CommitDelay.
>
> Okay, so this errs in the opposite direction from the original form of
> the benchmark: there will be *no* cross-backend locking delays, except
> for accesses to the common WAL log.  That's good as a comparison point,
> but we shouldn't trust it absolutely either.
>

Of cource it's only one of the test cases.
Because I've ever seen one-sided test cases, I had to
provide this test case unwillingly.
There are some obvious cases that CommitDelay is harmful
and I've seen no test case other than such cases i.e
1) There's only one session.
2) The backends always conflict(e.g pgbench with scaling factor 1).

> >> What platform is this on --- in particular, how long a delay
> >> is CommitDelay=1 in reality?  What -B did you use?
>
> > platform) i686-pc-linux-gnu, compiled by GCC egcs-2.91.60(turbolinux 4.2)
> > min delay) 10msec according to your test program.
> > -B)  64 (all other settings are default)
>
> Thanks.  Could I trouble you to run it again with a larger -B, say
> 1024 or 2048?  What I've found is that at -B 64, the benchmark is
> so constrained by limited buffer space that it doesn't reflect
> performance at a more realistic production setting.
>

OK I would try it later though I'm not sure I could
increase -B that large in my current environment.

Regards,
Hiroshi Inoue
> Okay, plan B then: let's ask people to redo their benchmarks with
> -s bigger than one.  Now, how much bigger?
>
> To the extent that you think this is a model of a real bank, it should
> be obvious that the number of concurrent transactions cannot exceed the
> number of tellers; there should never be any write contention on a
> teller's table row, because only that teller (client) should be issuing
> transactions against it.  Contention on a branch's row is realistic,
> but not from more clients than there are tellers in the branch.
>
> As a rule of thumb, then, we could say that the benchmark's results are
> not to be believed for numbers of clients exceeding perhaps 5 times the
> scale factor, ie, half the number of teller rows (so that it's not too
> likely we will have contention on a teller row).

At least -s 5 seems reasonable for me too. Maybe we should make it as
the default setting for pgbench?
--
Tatsuo Ishii
> I didn't much like that approach to altering the test, since it also
> means that all the clients are working with separate tables and hence
> not able to share read I/O; that doesn't seem like it's the same
> benchmark at all.  What would make more sense to me is to increase the
> number of rows in the branches table.
>
> Right now, at the default "scale factor" of 1, pgbench makes tables of
> these sizes:
>
> accounts    100000
> branches    1
> history        0        (filled during test)
> tellers        10
>
> It seems to me that the branches table should have at least 10 to 100
> entries, and tellers about 10 times whatever branches is.  100000
> accounts rows seems enough though.

Those numbers are defined in the TPC-B spec. But pgbench is not an
official test tool anyway, so you could modify it if you like.
That is the benefit of the open source:-)
--
Tatsuo Ishii
> -----Original Message-----
> From: Tom Lane
>
> Hannu Krosing <hannu@tm.ee> writes:
> > Is this unmodified pgbench or has it Hiroshi tweaked behaviour of
> > connecting each client to its own database, so that locking and such
> > does not shade the possible benefits (was it about 15% ?) of delay>1
>
> I didn't much like that approach to altering the test, since it also
> means that all the clients are working with separate tables and hence
> not able to share read I/O; that doesn't seem like it's the same
> benchmark at all.

I agree with you at this point. Generally speaking the benchmark
has little meaning if it has no conflicts in the test case. I only
borrowed pgbench's source code to implement my test cases.
Note that there's only one database in my last test case. My
modified "pgbench" isn't a pgbench any more and I didn't intend
to change pgbench's spec like that. Probably it was my mistake
that I had posted my test cases using the form of patch.  My
intension was to clarify the difference of my test cases.
However heavy conflicts with scaling factor 1 doesn't seem
preferable at least as the default of pgbench.

Regards,
Hiroshi Inoue
Tom Lane wrote:
>
> > platform) i686-pc-linux-gnu, compiled by GCC egcs-2.91.60(turbolinux 4.2)
> > min delay) 10msec according to your test program.
> > -B)  64 (all other settings are default)
>
> Thanks.  Could I trouble you to run it again with a larger -B, say
> 1024 or 2048?  What I've found is that at -B 64, the benchmark is
> so constrained by limited buffer space that it doesn't reflect
> performance at a more realistic production setting.
>

Hmm the result doesn't seem that obvious.

First I got the following result.
[CommitDelay=0]
1)tps = 23.024648(including connections establishing)
  tps = 23.856420(excluding connections establishing)
2)tps = 30.276270(including connections establishing)
  tps = 30.996459(excluding connections establishing)
[CommitDelay=1]
1)tps = 23.065921(including connections establishing)
  tps = 23.866029(excluding connections establishing)
2)tps = 34.024632(including connections establishing)
  tps = 35.671566(excluding connections establishing)

The result seems inconstant and after disabling
checkpoint process I got the following.

[CommitDelay=0]
1)tps = 24.060970(including connections establishing)
  tps = 24.416851(excluding connections establishing)
2)tps = 21.361134(including connections establishing)
  tps = 21.605583(excluding connections establishing)
3)tps = 20.377635(including connections establishing)
  tps = 20.646523(excluding connections establishing)
[CommitDelay=1]
1)tps = 22.164379(including connections establishing)
  tps = 22.790772(excluding connections establishing)
2)tps = 22.719068(including connections establishing)
  tps = 23.040485(excluding connections establishing)
3)tps = 24.341675(including connections establishing)
  tps = 25.869479(excluding connections establishing)

Unfortunately I have no more time to check today.
Please check the similar test case.

[My test case]
I created and initialized 10 datatabases as follows.
1) create databases.
   createdb inoue1
   craetedb inoue2
   .
   createdb inoue10
2) pgbench -i inoue1
   pgbench -i inoue2
   .
   pgbench -i inoue10
3) invoke a modified pgbench
   pgbench -c 10 -t 100 inoue

I've attached a patch to change pgbench so that
each connection connects to different database
whose name is 'xxxx%d'(xxxx is the specified
database? name).

Regards,
Hiroshi InoueIndex: pgbench.c
===================================================================
RCS file: /home/cvs/pgcurrent/contrib/pgbench/pgbench.c,v
retrieving revision 1.1
diff -c -r1.1 pgbench.c
*** pgbench.c    2001/02/20 07:55:21    1.1
--- pgbench.c    2001/02/20 09:31:13
***************
*** 540,545 ****
--- 540,546 ----

      PGconn       *con;
      PGresult   *res;
+ char dbn[48];

      while ((c = getopt(argc, argv, "ih:nvp:dc:t:s:S")) != EOF)
      {
***************
*** 639,645 ****
      }

      /* opening connection... */
!     con = PQsetdb(pghost, pgport, NULL, NULL, dbName);
      if (PQstatus(con) == CONNECTION_BAD)
      {
          fprintf(stderr, "Connection to database '%s' failed.\n", dbName);
--- 640,648 ----
      }

      /* opening connection... */
!     /*con = PQsetdb(pghost, pgport, NULL, NULL, dbName);*/
! sprintf(dbn, "%s1", dbName);
! con = PQsetdb(pghost, pgport, NULL, NULL, dbn);
      if (PQstatus(con) == CONNECTION_BAD)
      {
          fprintf(stderr, "Connection to database '%s' failed.\n", dbName);
***************
*** 726,732 ****
      /* make connections to the database */
      for (i = 0; i < nclients; i++)
      {
!         state[i].con = PQsetdb(pghost, pgport, NULL, NULL, dbName);
          if (PQstatus(state[i].con) == CONNECTION_BAD)
          {
              fprintf(stderr, "Connection to database '%s' failed.\n", dbName);
--- 729,737 ----
      /* make connections to the database */
      for (i = 0; i < nclients; i++)
      {
!         /*state[i].con = PQsetdb(pghost, pgport, NULL, NULL, dbName);*/
! sprintf(dbn, "%s%d", dbName, i + 1);
! state[i].con = PQsetdb(pghost, pgport, NULL, NULL, dbn);
          if (PQstatus(state[i].con) == CONNECTION_BAD)
          {
              fprintf(stderr, "Connection to database '%s' failed.\n", dbName);
Dmitry Morozovsky wrote:

> On Sun, 18 Feb 2001, Dmitry Morozovsky wrote:
>
> DM> I just done the experiment with increasing HZ to 1000 on my own machine
> DM> (PII 374). Your test program reports 2 ms instead of 20. The other side
> DM> of increasing HZ is surely more overhead to scheduler system. Anyway, it's
> DM> a bit of data to dig into, I suppose ;-)
> DM>
> DM> Results for pgbench with 7.1b4: (BTW, machine is FreeBSD 4-stable on IBM
> DM> DTLA IDE in ATA66 mode with tag queueing and soft updates turned on)

Is this unmodified pgbench or has it Hiroshi tweaked behaviour of
connecting each client to its own database, so that locking and such
does not shade the possible benefits (was it about 15% ?) of delay>1

also, IIRC Tom suggested running with at least -B 1024 if you can.

-----------------
Hannu
On Fri, Feb 23, 2001 at 01:09:37PM +0200, Hannu Krosing wrote:
> Dmitry Morozovsky wrote:
>
> > DM> I just done the experiment with increasing HZ to 1000 on my own machine
> > DM> (PII 374). Your test program reports 2 ms instead of 20. The other side
> > DM> of increasing HZ is surely more overhead to scheduler system. Anyway, it's
> > DM> a bit of data to dig into, I suppose ;-)
> > DM>
> > DM> Results for pgbench with 7.1b4: (BTW, machine is FreeBSD 4-stable on IBM
> > DM> DTLA IDE in ATA66 mode with tag queueing and soft updates turned on)
>
> Is this unmodified pgbench or has it Hiroshi tweaked behaviour of
> connecting each client to its own database, so that locking and such
> does not shade the possible benefits (was it about 15% ?) of delay>1
>
> also, IIRC Tom suggested running with at least -B 1024 if you can.

Just try this:
explain select * from <tablename> where <fieldname>=<any_value>
(Use for fieldname an indexed field).

If postgres is using an sequential scan in stead of an index scan. You have
to vacuum your database. This will REALLY remove deleted data from your indexes.

Hope it will work,

Dave Mertens
System Administrator ISM, Netherlands
On Sat, 17 Feb 2001, Tom Lane wrote:

[skip]

TL> Platform: HPUX 10.20 on HPPA C180, fast wide SCSI discs, 7200rpm (I think).
TL> Minimum select(2) delay is 10 msec on this platform.

[skip]

TL> I vote for commit_delay = 0, unless someone can show cases where
TL> positive delay is significantly better than zero delay.

BTW, for modern versions of FreeBSD kernels, there is HZ kernel option
which describes maximum timeslice granularity (actually, HZ value is
number of timeslice periods per second, with default of 100 = 10 ms). On
modern CPUs HZ may be increased to at least 1000, and sometimes even to
5000 (unfortunately, I haven't test platform by hand).

So, maybe you can test select granularity at ./configure phase and then
define default commit_delay accordingly.

Your thoughts?

Sincerely,
D.Marck                                   [DM5020, DM268-RIPE, DM3-RIPN]
------------------------------------------------------------------------
*** Dmitry Morozovsky --- D.Marck --- Wild Woozle --- marck@rinet.ru ***
------------------------------------------------------------------------