Обсуждение: Disk wait problem...
Hi,
I have a 1.6TB database with over 330 tables on a 4TB NVMe SSD. All
tables are static (no updates); most in 8M and 33M row sizes. Queries have
been great, until recently.
I use SQL-workbench/J (WB) and starting at any table, if I use up/down
arrow to switch to another table, all that happens is WB queries the
table to get the row count and a LIMIT of rows to display.
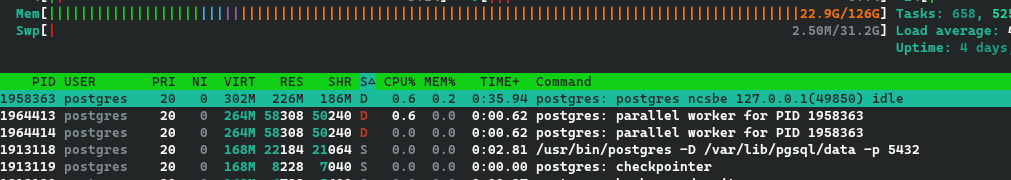
If I set LIMIT to 10, I see one process in disk wait:
$ top -b -n 1 | grep postgre
PID USER PR NI VIRT RES SHR S %CPU %MEM TIME+ COMMAND
1913118 postgres 20 0 172620 22184 21064 S 0.0 0.0 0:04.26 postgres
1913119 postgres 20 0 172744 11428 10240 S 0.0 0.0 0:00.02 postgres
1913120 postgres 20 0 172756 8868 7680 S 0.0 0.0 0:00.42 postgres
1913122 postgres 20 0 172620 9988 8800 S 0.0 0.0 0:00.36 postgres
1913123 postgres 20 0 178300 9508 8160 S 0.0 0.0 0:02.29 postgres
1913124 postgres 20 0 176232 7908 6560 S 0.0 0.0 0:00.02 postgres
1931492 postgres 20 0 178044 21668 18720 S 0.0 0.0 0:00.22 postgres
1977002 postgres 20 0 182984 36992 31360 D 0.0 0.0 0:01.61 postgres
3851279 postgres 20 0 13544 6560 2880 S 0.0 0.0 0:00.01 bash
3854720 postgres 20 0 10716 5416 4456 S 0.0 0.0 0:00.02 psql
With LIMIT set to 500, this table has 2,148,035 rows (disk-wait process
only):
$ top -b -n 1 | grep postgre
PID USER PR NI VIRT RES SHR S %CPU %MEM TIME+ COMMAND
1977002 postgres 20 0 184708 37900 32000 D 0.0 0.0 0:01.83 postgres
2,152,372 rows -- took nearly 30 seconds
$ top -b -n 1 | grep postgre
PID USER PR NI VIRT RES SHR S %CPU %MEM TIME+ COMMAND
1977002 postgres 20 0 184708 37900 32000 D 0.0 0.0 0:01.83 postgres
Earlier, with LIMIT 500, I was seeing 3 processes in disk-wait.
Also attached is the relevant system journal entries for one query that
took 2 seconds and two more that took 62 and 52 seconds... Unlike the
above, these had 3 processes in disk-wait -- see attached screenshot...
I just stopped PG, updated the full backup which was done overnight (so
the update took about a second), restarted PG and the problem persists...
Any suggestions where to look next?
Thanks,
Pierre
Вложения
On 10/23/23 11:54, pf@pfortin.com wrote:
> Hi,
>
> I have a 1.6TB database with over 330 tables on a 4TB NVMe SSD. All
> tables are static (no updates); most in 8M and 33M row sizes. Queries have
> been great, until recently.

> Also attached is the relevant system journal entries for one query that
> took 2 seconds and two more that took 62 and 52 seconds... Unlike the
> above, these had 3 processes in disk-wait -- see attached screenshot...

What happens if you select the tables in the command line client psql?

>
> I just stopped PG, updated the full backup which was done overnight (so
> the update took about a second), restarted PG and the problem persists...
>
> Any suggestions where to look next?
>
> Thanks,
> Pierre

--
Adrian Klaver
adrian.klaver@aklaver.com
> Hi,
>
> I have a 1.6TB database with over 330 tables on a 4TB NVMe SSD. All
> tables are static (no updates); most in 8M and 33M row sizes. Queries have
> been great, until recently.

> Also attached is the relevant system journal entries for one query that
> took 2 seconds and two more that took 62 and 52 seconds... Unlike the
> above, these had 3 processes in disk-wait -- see attached screenshot...
>
> I just stopped PG, updated the full backup which was done overnight (so
> the update took about a second), restarted PG and the problem persists...
>
> Any suggestions where to look next?
>
> Thanks,
> Pierre

Hi Pierre,

I have seen this type of behavior when parallel queries were enabled and
PostgreSQL decided that a parallel sequential scan query was the fastest
option. Try disabling them and see if that helps.

Regards,
Ken
On Mon, 23 Oct 2023 15:09:16 -0500 Ken Marshall wrote:

>> Hi,
>>
>> I have a 1.6TB database with over 330 tables on a 4TB NVMe SSD. All
>> tables are static (no updates); most in 8M and 33M row sizes. Queries have
>> been great, until recently.
>
>> Also attached is the relevant system journal entries for one query that
>> took 2 seconds and two more that took 62 and 52 seconds... Unlike the
>> above, these had 3 processes in disk-wait -- see attached screenshot...
>>
>> I just stopped PG, updated the full backup which was done overnight (so
>> the update took about a second), restarted PG and the problem persists...
>>
>> Any suggestions where to look next?
>>
>> Thanks,
>> Pierre
>
>Hi Pierre,
>
>I have seen this type of behavior when parallel queries were enabled and
>PostgreSQL decided that a parallel sequential scan query was the fastest
>option. Try disabling them and see if that helps.

Hi Ken,  I'm running a bunch of tests for Adrian right now; but I'm
curious: are parallel queries on by default? I have no recollection of
ever seeing that was an option.  Since I'm only running simple:
SELECT count(*) FROM table;  does this imply that PG could be breaking
the query up in parts to count faster, and why I saw up to 3 processes in
D state?

Thanks for this tip,
Pierre

>Regards,
>Ken
>
>
Forgot to mention version:

PostgreSQL 15.4 on x86_64-mageia-linux-gnu, compiled by gcc (Mageia
12.3.0-3.mga9) 12.3.0, 64-bit

Sorry,
Pierre
On 10/23/23 14:55, pf@pfortin.com wrote:
Please reply to list also.
Ccing the list for this post.

> On Mon, 23 Oct 2023 12:44:56 -0700 Adrian Klaver wrote:
>
>> On 10/23/23 11:54, pf@pfortin.com wrote:
>>> Hi,
>>>
>>> I have a 1.6TB database with over 330 tables on a 4TB NVMe SSD. All
>>> tables are static (no updates); most in 8M and 33M row sizes. Queries have
>>> been great, until recently.
>>
>>> Also attached is the relevant system journal entries for one query that
>>> took 2 seconds and two more that took 62 and 52 seconds... Unlike the
>>> above, these had 3 processes in disk-wait -- see attached screenshot...
>>
>> What happens if you select the tables in the command line client psql?
>
> Hi Adrian,
>
> Sorry about everything inline; I think it saves time vs dealing with
> attachments...
>
> Summary:
> * single large partition dedicated to PG
> * only PG seems affected
> * buffered reads are 6x slower when PG queries are in progress
> * psql queries of 30  33M tables shows random results up to 4m51s
> * successful psql queries below 500ms
> * ls -l loop on another directory had no delays.
>
> HTH...
>
> The WB query was in disk-wait, so psql gave:
> ncsbe=# select count(*) from ncvhis_2022_10_29;
> FATAL:  terminating connection due to administrator command
> server closed the connection unexpectedly
>          This probably means the server terminated abnormally
>          before or while processing the request.
> The connection to the server was lost. Attempting reset: Succeeded.
>
> The above query finished a second or two before the WB results
> appeared; then this next query succeeded right after:
> ncsbe=# select count(*) from
> ncvhis_2022_10_29; count
> ----------
>   33861176
> (1 row)
>
> Another table went into disk-wait long enough that I was able to query
> the tmp directory on the same disk just fine.
>
> Querying the same table; no error, canceled it:
> ncsbe=# select count(*) from ncvhis_2022_07_23;
> ^CCancel request sent
> ERROR:  canceling statement due to user request
>
> While this table was still in disk-wait, tried another table which
> returned quickly:
> ncsbe=# select count(*) from ncvhis_2023_10_21;
>    count
> ----------
>   32983343
> (1 row)
>
> Eventually, the WB query did complete...
>
> Next, I made a query list for 30 tables, turned on timing and pasted the
> queries.  Pasting results inline:
> ncsbe=# select count(*) from ncvhis_2012_12_06;
> select count(*) from ncvhis_2016_12_03;
> select count(*) from ncvhis_2020_08_01;
> select count(*) from ncvhis_2020_10_31;
> select count(*) from ncvhis_2020_12_05;
> select count(*) from ncvhis_2020_12_26;
> select count(*) from ncvhis_2021_03_06;
> select count(*) from ncvhis_2021_06_12;
> select count(*) from ncvhis_2022_07_23;
> select count(*) from ncvhis_2022_10_15;
> select count(*) from ncvhis_2022_10_22;
> select count(*) from ncvhis_2022_10_29;
> select count(*) from ncvhis_2022_11_05;
> select count(*) from ncvhis_2022_11_12;
> select count(*) from ncvhis_2022_11_19;
> select count(*) from ncvhis_2022_11_26;
> select count(*) from ncvhis_2022_12_03;
> select count(*) from ncvhis_2022_12_10;
> select count(*) from ncvhis_2022_12_17;
> select count(*) from ncvhis_2022_12_24;
> select count(*) from ncvhis_2022_12_31;
> select count(*) from ncvhis_2023_01_08;
> select count(*) from ncvhis_2023_01_14;
> select count(*) from ncvhis_2023_01_21;
> select count(*) from ncvhis_2023_01_28;
> select count(*) from ncvhis_2023_02_04;
> select count(*) from ncvhis_2023_02_11;
> select count(*) from ncvhis_2023_02_18;
> select count(*) from ncvhis_2023_02_27;
> select count(*) from ncvhis_2023_03_04;
>    count
> ----------
>   31923950
> (1 row)
>
> Time: 72404.786 ms (01:12.405)
>    count
> ----------
>   29701168
> (1 row)
>
> Time: 301.246 ms
>    count
> ----------
>   32172845
> (1 row)
>
> Time: 409.974 ms
>    count
> ----------
>   32162748
> (1 row)
>
> Time: 363.836 ms
>    count
> ----------
>   34679651
> (1 row)
>
> Time: 351.167 ms
>    count
> ----------
>   35006711
> (1 row)
>
> Time: 348.378 ms
>    count
> ----------
>   35003995
> (1 row)
>
> Time: 348.712 ms
>    count
> ----------
>   34994502
> (1 row)
>
> Time: 351.901 ms
>    count
> ----------
>   33686292
> (1 row)
>
> Time: 487.837 ms
>    count
> ----------
>   33861658
> (1 row)
>
> Time: 40987.826 ms (00:40.988)
>    count
> ----------
>   33861381
> (1 row)
>
> Time: 76964.281 ms (01:16.964)
>    count
> ----------
>   33861176
> (1 row)
>
> Time: 483.329 ms
>    count
> ----------
>   33861071
> (1 row)
>
> Time: 18919.267 ms (00:18.919)
>    count
> ----------
>   29344354
> (1 row)
>
> Time: 50896.978 ms (00:50.897)
>    count
> ----------
>   30709227
> (1 row)
>
> Time: 25784.000 ms (00:25.784)
>    count
> ----------
>   32368001
> (1 row)
>
> Time: 45407.599 ms (00:45.408)
>    count
> ----------
>   33126826
> (1 row)
>
> Time: 75171.609 ms (01:15.172)
>   count
> ----------
>   33126808
> (1 row)
>
> Time: 88871.004 ms (01:28.871)
>    count
> ----------
>   33127317
> (1 row)
>
> Time: 128565.127 ms (02:08.565)
>   count
> ----------
>   33127192
> (1 row)
>
> Time: 210248.222 ms (03:30.248)
>    count
> ----------
>   33127117
> (1 row)
>
> Time: 246609.561 ms (04:06.610)   4 minutes!  ;p
>    count
> ----------
>   33124457
> (1 row)
>
> Time: 166406.283 ms (02:46.406)
>    count
> ----------
>   33123714
> (1 row)
>
> Time: 291483.538 ms (04:51.484)  nearly 5 minutes ;p ;p
>    count
> ----------
>   33123313
> (1 row)
>
> Time: 2269.961 ms (00:02.270)
>    count
> ----------
>   33123197
> (1 row)
>
> Time: 413.219 ms
>    count
> ----------
>   33123091
> (1 row)
>
> Time: 433.817 ms
>    count
> ----------
>   33122953
> (1 row)
>
> Time: 395.844 ms
>    count
> ----------
>   33122752
> (1 row)
>
> Time: 7251.637 ms (00:07.252)
>    count
> ----------
>   33122665
> (1 row)
>
> Time: 384.328 ms
>    count
> ----------
>   33122573
> (1 row)
>
> Time: 384.887 ms
> ncsbe=#
>
> I don't see a pattern in the above; matches the randomness I saw using
> WB...
>
> Before the above finished, I issued this command on another konsole...
>
> $ while true; do ls -l > /tmp/ll; date; done
> Mon Oct 23 05:12:54 PM EDT 2023
> Mon Oct 23 05:12:54 PM EDT 2023
> Mon Oct 23 05:12:54 PM EDT 2023
> Mon Oct 23 05:12:54 PM EDT 2023
> Mon Oct 23 05:12:54 PM EDT 2023
> Mon Oct 23 05:12:54 PM EDT 2023
> Mon Oct 23 05:12:54 PM EDT 2023
> Mon Oct 23 05:12:54 PM EDT 2023
> Mon Oct 23 05:12:54 PM EDT 2023
> Mon Oct 23 05:12:54 PM EDT 2023
> Mon Oct 23 05:12:54 PM EDT 2023
> Mon Oct 23 05:12:54 PM EDT 2023
> ...
> Lots of high speed output with no pauses, at 64 loops per second.
>
> So that means only PG is getting disk waits.
>
> This disk is dedicated to PG and a rarely used semi-permanent tmp
> directory on a single partition.
>
> This is from fdisk -l:
> Disk /dev/nvme1n1: 3.64 TiB, 4000787030016 bytes, 7814037168 sectors
> Disk model: Seagate FireCuda 530 ZP4000GM30023
> Units: sectors of 1 * 512 = 512 bytes
> Sector size (logical/physical): 512 bytes / 512 bytes
> I/O size (minimum/optimal): 512 bytes / 512 bytes
> Disklabel type: gpt
> Disk identifier: 9B3C5D73-6FFD-475D-9E1E-26F43B41C690
>
> Device         Start        End    Sectors  Size Type
> /dev/nvme1n1p1  2048 7814035455 7814033408  3.6T Linux filesystem
>
> $ hdparm -Tt /dev/nvme1n1
> /dev/nvme1n1:
>   Timing cached reads:   36820 MB in  2.00 seconds = 18434.72 MB/sec
>   Timing buffered disk reads: 774 MB in  3.00 seconds = 257.74 MB/sec
>
> The 30 queries still hadn't finished at this point...
>
> Interesting: the hdparm buffered read is very slow; once the queries
> finished, the disk performance is back:
> $ hdparm -Tt /dev/nvme1n1
>
> /dev/nvme1n1:
>   Timing cached reads:   37382 MB in  2.00 seconds = 18715.85 MB/sec
>   Timing buffered disk reads: 5002 MB in  3.17 seconds = 1575.89 MB/sec
>
> Over 6x faster...
>
> So far, the only disk waits I see are PG related.  Do have any opinion on
> Ken's comment about parallel queries?
>
> Thanks,
> Pierre
>
>
>>>
>>> I just stopped PG, updated the full backup which was done overnight (so
>>> the update took about a second), restarted PG and the problem persists...
>>>
>>> Any suggestions where to look next?
>>>
>>> Thanks,
>>> Pierre
>>

--
Adrian Klaver
adrian.klaver@aklaver.com
On Mon, 23 Oct 2023 16:31:30 -0700 Adrian Klaver wrote:

>Please reply to list also.
>Ccing the list for this post.

Sorry, got the list's message and one directly from you; looks like I
picked the wrong one to reply to...

I just heard from a remote team member who wrote this:
    !! Eventually found that 3 PG processes are sitting in disk-wait
    (attached
    !! screenshot)... I still can't imagine what would hold onto a
    disk for that
    !! long,

    I wonder if these are abandoned queries that did not properly close
    out.

He forgot to attach his screenshot; trying to get more info from him...

Thanks,
Pierre
After much searching, I eventually discovered that there's a firmware
update for my Samsung Firecuda NVMe drives:
https://www.seagate.com/support/downloads/

Also Seagate:
https://www.dell.com/en-us/shop/workstations-isv-certified/sr/workstations/linux?appliedRefinements=39332

Not sure about the WD drive yet; but it's less urgent...

No idea if this will solve my problems; but a reasonable possibility.
To be honest, this unnerves me; so will do more research before
proceeding...

Thanks Ken and Adrian for your responses which helped me look deeper...
Pierre

On Mon, 23 Oct 2023 18:03:58 -0400 pf@pfortin.com wrote:

>Forgot to mention version:
>
>PostgreSQL 15.4 on x86_64-mageia-linux-gnu, compiled by gcc (Mageia
>12.3.0-3.mga9) 12.3.0, 64-bit
>
>Sorry,
>Pierre
>
>
On 2023-10-23 16:31:30 -0700, Adrian Klaver wrote:
> On 10/23/23 14:55, pf@pfortin.com wrote:
> > Next, I made a query list for 30 tables, turned on timing and pasted the
> > queries.  Pasting results inline:
> > ncsbe=# select count(*) from ncvhis_2012_12_06;
> > select count(*) from ncvhis_2016_12_03;
> > select count(*) from ncvhis_2020_08_01;
> > select count(*) from ncvhis_2020_10_31;
[...]
> > Time: 72404.786 ms (01:12.405)
> > Time: 301.246 ms
> > Time: 409.974 ms
> > Time: 363.836 ms
> > Time: 351.167 ms
> > Time: 348.378 ms
> > Time: 348.712 ms
> > Time: 351.901 ms
> > Time: 487.837 ms
> > Time: 40987.826 ms (00:40.988)
> > Time: 76964.281 ms (01:16.964)
> > Time: 483.329 ms
> > Time: 18919.267 ms (00:18.919)
> > Time: 50896.978 ms (00:50.897)
> > Time: 25784.000 ms (00:25.784)
> > Time: 45407.599 ms (00:45.408)
> > Time: 75171.609 ms (01:15.172)
> > Time: 88871.004 ms (01:28.871)
> > Time: 128565.127 ms (02:08.565)
> > Time: 210248.222 ms (03:30.248)
> > Time: 246609.561 ms (04:06.610)   4 minutes!  ;p
> > Time: 166406.283 ms (02:46.406)
> > Time: 291483.538 ms (04:51.484)  nearly 5 minutes ;p ;p
> > Time: 2269.961 ms (00:02.270)
> > Time: 413.219 ms
> > Time: 433.817 ms
> > Time: 395.844 ms
> > Time: 7251.637 ms (00:07.252)
> > Time: 384.328 ms
> > Time: 384.887 ms
> >
> > I don't see a pattern in the above; matches the randomness I saw using
> > WB...

It would be interesting to see whether there's a difference in plan
between the slow and the fast queries.

If your experiment above is repeatable, you can just prefix every
query with
    explain (analyze, buffers)


explain (analyze, buffers) select count(*) from ncvhis_2016_12_03;
explain (analyze, buffers) select count(*) from ncvhis_2020_08_01;
explain (analyze, buffers) select count(*) from ncvhis_2020_10_31;
...

If it is hard to reproduce (happens only sometimes), the best way to
catch is probably to enable auto_explain
<https://www.postgresql.org/docs/current/auto-explain.html>, possibly
with the auto_explain.log_analyze option and check the logs after it
happened. (auto_explain is generally a good idea, IMHO).


> > Before the above finished, I issued this command on another konsole...
> >
> > $ while true; do ls -l > /tmp/ll; date; done

This is unlikely to generate noticeable disk waits. The current
directory will be in the cache after the first ls and the writes happen
asynchroneously.

        hp

--
   _  | Peter J. Holzer    | Story must make more sense than reality.
|_|_) |                    |
| |   | hjp@hjp.at         |    -- Charles Stross, "Creative writing
__/   | http://www.hjp.at/ |       challenge!"
Вложения
Hi Peter,

All of the following is based on using SQL_workbench/J (WB)  (Mageia Linux
has not provided a viable pgAdmin4 package); WB is setup to autoload the
table row count and 10 rows. I'm sticking to one set of files where they
are all roughly 33.6M rows.

I've been doing a lot of digging and found more interesting info...

At first, I thought the disk was in disk wait the entire time of the
delay; this _appeared_ to be the case since the system journal logged
everything about each query, with every query looking the same; no errors.

I was going to provide some logs; but suffice it to say that the logs,
combined with running iostat every second has been enlightening...

Every time I switch from one table to another, sometimes the results
display in:
* less than a half-second
* one or more seconds
* up to 5+ minutes.
So far, none has failed to eventually return; just l..o..n..g delays...

This morning, I've been using iostat:
$ while true; do echo -n "$(date +%H:%M:%S)  "; iostat /dev/nvme1n1 |
grep nvme1n1; sleep 1; done

When the response is fast; I see iostat report ~225000 bytes read. On the
other hand when the query takes a long time to respond, I see the read
bytes spread over time...  a little every second...  So while htop
appears to report a steady D (disk wait) status, I now suspect the short
transfers are fast and most of the time, htop is going to catch the D
state.

It definitely appears to be a problem with the 4TB NVMe SSD drive which
utilities say it still has 95% life left[1].  The drive is reporting:
Error Information Log Entries:      1,177
which is growing, so I'll be digging into that.  It also reports:

Error Information (NVMe Log 0x01, 16 of 63 entries)
Num   ErrCount  SQId   CmdId  Status  PELoc          LBA  NSID    VS  Message
  0       1177     0  0xc002  0x4004      -            0     1     -  Invalid Field in Command
  1       1176     0  0xb001  0x4004      -            0     1     -  Invalid Field in Command
  2       1175     0  0x801a  0x4004      -            0     1     -  Invalid Field in Command
...
This list is not growing, so I'll look into it later than sooner.

A few moments ago, I decided to switch to the backup which resides on a
17TB mechanical platter drive which is running great.

[1] SSD drives wear out with usage; think of it as a vehicle tire which
slowly wears out.

Also found that there is a firmware update available from:
https://www.seagate.com/support/downloads/

No idea if this will solve the problem; but...

Thanks for your suggestions.

Thought I saw there may be instrumentation within PG which I can access;
suggestions welcome if so...

Cheers,
Pierre


On Thu, 26 Oct 2023 11:50:00 +0200 Peter J. Holzer wrote:

>On 2023-10-23 16:31:30 -0700, Adrian Klaver wrote:
>> On 10/23/23 14:55, pf@pfortin.com wrote:
>> > Next, I made a query list for 30 tables, turned on timing and pasted the
>> > queries.  Pasting results inline:
>> > ncsbe=# select count(*) from ncvhis_2012_12_06;
>> > select count(*) from ncvhis_2016_12_03;
>> > select count(*) from ncvhis_2020_08_01;
>> > select count(*) from ncvhis_2020_10_31;
>[...]
>> > Time: 72404.786 ms (01:12.405)
>> > Time: 301.246 ms
>> > Time: 409.974 ms
>> > Time: 363.836 ms
>> > Time: 351.167 ms
>> > Time: 348.378 ms
>> > Time: 348.712 ms
>> > Time: 351.901 ms
>> > Time: 487.837 ms
>> > Time: 40987.826 ms (00:40.988)
>> > Time: 76964.281 ms (01:16.964)
>> > Time: 483.329 ms
>> > Time: 18919.267 ms (00:18.919)
>> > Time: 50896.978 ms (00:50.897)
>> > Time: 25784.000 ms (00:25.784)
>> > Time: 45407.599 ms (00:45.408)
>> > Time: 75171.609 ms (01:15.172)
>> > Time: 88871.004 ms (01:28.871)
>> > Time: 128565.127 ms (02:08.565)
>> > Time: 210248.222 ms (03:30.248)
>> > Time: 246609.561 ms (04:06.610)   4 minutes!  ;p
>> > Time: 166406.283 ms (02:46.406)
>> > Time: 291483.538 ms (04:51.484)  nearly 5 minutes ;p ;p
>> > Time: 2269.961 ms (00:02.270)
>> > Time: 413.219 ms
>> > Time: 433.817 ms
>> > Time: 395.844 ms
>> > Time: 7251.637 ms (00:07.252)
>> > Time: 384.328 ms
>> > Time: 384.887 ms
>> >
>> > I don't see a pattern in the above; matches the randomness I saw using
>> > WB...
>
>It would be interesting to see whether there's a difference in plan
>between the slow and the fast queries.
>
>If your experiment above is repeatable, you can just prefix every
>query with
>    explain (analyze, buffers)
>
>
>explain (analyze, buffers) select count(*) from ncvhis_2016_12_03;
>explain (analyze, buffers) select count(*) from ncvhis_2020_08_01;
>explain (analyze, buffers) select count(*) from ncvhis_2020_10_31;
>...
>
>If it is hard to reproduce (happens only sometimes), the best way to
>catch is probably to enable auto_explain
><https://www.postgresql.org/docs/current/auto-explain.html>, possibly
>with the auto_explain.log_analyze option and check the logs after it
>happened. (auto_explain is generally a good idea, IMHO).
>
>
>> > Before the above finished, I issued this command on another konsole...
>> >
>> > $ while true; do ls -l > /tmp/ll; date; done
>
>This is unlikely to generate noticeable disk waits. The current
>directory will be in the cache after the first ls and the writes happen
>asynchroneously.
>
>        hp
>
On Thu, 26 Oct 2023 15:50:16 -0400 pf@pfortin.com wrote:

>Hi Peter,
>
>All of the following is based on using SQL_workbench/J (WB)  (Mageia Linux
>has not provided a viable pgAdmin4 package); WB is setup to autoload the
>table row count and 10 rows. I'm sticking to one set of files where they
>are all roughly 33.6M rows.
>
>I've been doing a lot of digging and found more interesting info...
>
>At first, I thought the disk was in disk wait the entire time of the
>delay; this _appeared_ to be the case since the system journal logged
>everything about each query, with every query looking the same; no errors.
>
>I was going to provide some logs; but suffice it to say that the logs,
>combined with running iostat every second has been enlightening...
>
>Every time I switch from one table to another, sometimes the results
>display in:
>* less than a half-second
>* one or more seconds
>* up to 5+ minutes.
>So far, none has failed to eventually return; just l..o..n..g delays...
>
>This morning, I've been using iostat:
>$ while true; do echo -n "$(date +%H:%M:%S)  "; iostat /dev/nvme1n1 |
>grep nvme1n1; sleep 1; done
>
>When the response is fast; I see iostat report ~225000 bytes read. On the
>other hand when the query takes a long time to respond, I see the read
>bytes spread over time...  a little every second...  So while htop
>appears to report a steady D (disk wait) status, I now suspect the short
>transfers are fast and most of the time, htop is going to catch the D
>state.
>
>It definitely appears to be a problem with the 4TB NVMe SSD drive which
>utilities say it still has 95% life left[1].  The drive is reporting:
>Error Information Log Entries:      1,177
>which is growing, so I'll be digging into that.  It also reports:
>
>Error Information (NVMe Log 0x01, 16 of 63 entries)
>Num   ErrCount  SQId   CmdId  Status  PELoc          LBA  NSID    VS  Message
>  0       1177     0  0xc002  0x4004      -            0     1     -  Invalid Field in Command
>  1       1176     0  0xb001  0x4004      -            0     1     -  Invalid Field in Command
>  2       1175     0  0x801a  0x4004      -            0     1     -  Invalid Field in Command
>...
>This list is not growing, so I'll look into it later than sooner.
>
>A few moments ago, I decided to switch to the backup which resides on a
>17TB mechanical platter drive which is running great.
>
>[1] SSD drives wear out with usage; think of it as a vehicle tire which
>slowly wears out.
>
>Also found that there is a firmware update available from:
>https://www.seagate.com/support/downloads/
>
>No idea if this will solve the problem; but...
>
>Thanks for your suggestions.
>
>Thought I saw there may be instrumentation within PG which I can access;
>suggestions welcome if so...
>
>Cheers,
>Pierre
>
>
>On Thu, 26 Oct 2023 11:50:00 +0200 Peter J. Holzer wrote:
>
>>On 2023-10-23 16:31:30 -0700, Adrian Klaver wrote:
>>> On 10/23/23 14:55, pf@pfortin.com wrote:
>>> > Next, I made a query list for 30 tables, turned on timing and pasted the
>>> > queries.  Pasting results inline:
>>> > ncsbe=# select count(*) from ncvhis_2012_12_06;
>>> > select count(*) from ncvhis_2016_12_03;
>>> > select count(*) from ncvhis_2020_08_01;
>>> > select count(*) from ncvhis_2020_10_31;
>>[...]
>>> > Time: 72404.786 ms (01:12.405)
>>> > Time: 301.246 ms
>>> > Time: 409.974 ms
>>> > Time: 363.836 ms
>>> > Time: 351.167 ms
>>> > Time: 348.378 ms
>>> > Time: 348.712 ms
>>> > Time: 351.901 ms
>>> > Time: 487.837 ms
>>> > Time: 40987.826 ms (00:40.988)
>>> > Time: 76964.281 ms (01:16.964)
>>> > Time: 483.329 ms
>>> > Time: 18919.267 ms (00:18.919)
>>> > Time: 50896.978 ms (00:50.897)
>>> > Time: 25784.000 ms (00:25.784)
>>> > Time: 45407.599 ms (00:45.408)
>>> > Time: 75171.609 ms (01:15.172)
>>> > Time: 88871.004 ms (01:28.871)
>>> > Time: 128565.127 ms (02:08.565)
>>> > Time: 210248.222 ms (03:30.248)
>>> > Time: 246609.561 ms (04:06.610)   4 minutes!  ;p
>>> > Time: 166406.283 ms (02:46.406)
>>> > Time: 291483.538 ms (04:51.484)  nearly 5 minutes ;p ;p
>>> > Time: 2269.961 ms (00:02.270)
>>> > Time: 413.219 ms
>>> > Time: 433.817 ms
>>> > Time: 395.844 ms
>>> > Time: 7251.637 ms (00:07.252)
>>> > Time: 384.328 ms
>>> > Time: 384.887 ms
>>> >
>>> > I don't see a pattern in the above; matches the randomness I saw using
>>> > WB...
>>
>>It would be interesting to see whether there's a difference in plan
>>between the slow and the fast queries.
>>
>>If your experiment above is repeatable, you can just prefix every
>>query with
>>    explain (analyze, buffers)
>>
>>
>>explain (analyze, buffers) select count(*) from ncvhis_2016_12_03;
>>explain (analyze, buffers) select count(*) from ncvhis_2020_08_01;
>>explain (analyze, buffers) select count(*) from ncvhis_2020_10_31;
>>...
>>
>>If it is hard to reproduce (happens only sometimes), the best way to
>>catch is probably to enable auto_explain
>><https://www.postgresql.org/docs/current/auto-explain.html>, possibly
>>with the auto_explain.log_analyze option and check the logs after it
>>happened. (auto_explain is generally a good idea, IMHO).
>>
>>
>>> > Before the above finished, I issued this command on another konsole...
>>> >
>>> > $ while true; do ls -l > /tmp/ll; date; done
>>
>>This is unlikely to generate noticeable disk waits. The current
>>directory will be in the cache after the first ls and the writes happen
>>asynchroneously.
>>
>>        hp

Now, I'm not sure what's wrong...  I switched to the backup DB and still
seeing disk wait issues...

Production DB is on PCIe 4TB NVMe SSD Samsung Firecuda 530
(No difference after updating firmware)

Backup DB is on SATA 17TB Seagate ST18000NM000J-2T

I can't think of a common hardware bus/other that would only affect
PostgreSQL disk accesses.

Are there any extra PG low level logs that can be turned on?  I've only
found logging in the journal; that shows nothing unusual, except when
examining the timestamps which show varying query times -- that's the
only clue to slow queries other than the disk wait (D) status and small
transfers seen via iostat...

Pierre
On 2023-10-27 12:03, pf@pfortin.com wrote:
<snip>
> I can't think of a common hardware bus/other that would only affect
> PostgreSQL disk accesses.

Which file system is PostgreSQL being run on?

Asking because I remember seeing weirdness reported with *some* SSD
drives when used with ZFS:

   https://github.com/openzfs/zfs/discussions/14793

Note - that's not PostgreSQL specific or anything, but more of a
"weird stuff showing up with NVMe drives" thing.

Regards and best wishes,

Justin Clift
On 2023-10-26 22:03:25 -0400, pf@pfortin.com wrote:
> Are there any extra PG low level logs that can be turned on?

Have you looked at the query plans as I recommended? (You might also
want to enable track_io_timing to get extra information, but comparing
just the query plans of fast and slow queries would be a first step)

You haven't shown any postgresql logs or your settings, so it's hard to
know what you have already turned on.

There are a ton of logging related parameters.

> I've only found logging in the journal;

By "the journal" you mean the one maintained by journald? (Did you
mention what OS you are using? From several outputs I'm guessing it is
Linux). On Linux systems postgresql is usually set up to log into files
somewhere under /var/log/postgresql (see the log_directory entry in
postgresql.conf) but your setup might be different, of course.

        hp

--
   _  | Peter J. Holzer    | Story must make more sense than reality.
|_|_) |                    |
| |   | hjp@hjp.at         |    -- Charles Stross, "Creative writing
__/   | http://www.hjp.at/ |       challenge!"
Вложения
Peter,

Thanks for your patience; I've been feeling pressure to get this
resolved; so have been lax in providing info here..  Hope the following
helps...

On Fri, 27 Oct 2023 19:07:11 +0200 Peter J. Holzer wrote:

>On 2023-10-26 22:03:25 -0400, pf@pfortin.com wrote:
>> Are there any extra PG low level logs that can be turned on?

$ uname -a
Linux pf.pfortin.com 6.5.3-server-1.mga10 #1 SMP PREEMPT_DYNAMIC
   Sat Sep 16 00:04:28 UTC 2023 x86_64 GNU/Linux

PostgreSQL 15.4 on x86_64-mageia-linux-gnu, compiled by gcc (Mageia
12.3.0-3.mga9) 12.3.0, 64-bit

Operating System: Mageia 10 KDE Plasma
Version: 5.27.8 KDE Frameworks Version: 5.111.0
Qt Version: 5.15.7
Kernel Version: 6.5.3-server-1.mga10 (64-bit)
Graphics Platform: X11
Processors: 20 × 12th Gen Intel® Core™ i7-12700K
Memory: 125.5 GiB of RAM
Graphics Processor: AMD Radeon RX 6600 XT
Manufacturer: Dell Inc.
Product Name: XPS 8950

>Have you looked at the query plans as I recommended? (You might also
>want to enable track_io_timing to get extra information, but comparing
>just the query plans of fast and slow queries would be a first step)

I didn't see how that would help since other than the table name the
queries are identical.  Curious: are you implying PG stores tables
differently?  The tables are probably greater than 90-95% identical rows.
We're still investigating how to best store that type of data which
changes a small number of rows each week...

The query is the built-in row-count query in SQL-workbench/J which is
visible in the attached files.

>explain (analyze, buffers) select count(*) from ncvhis_2016_12_03;
Finalize Aggregate  (cost=404669.65..404669.66 rows=1 width=8) (actual
time=844.158..847.309 rows=1 loops=1) Buffers: shared hit=248 read=25022
  ->  Gather  (cost=404669.43..404669.65 rows=2 width=8) (actual
time=844.133..847.301 rows=3 loops=1) Workers Planned: 2
        Workers Launched: 2
        Buffers: shared hit=248 read=25022
        ->  Partial Aggregate  (cost=403669.43..403669.45 rows=1 width=8)
(actual time=838.772..838.772 rows=1 loops=3) Buffers: shared hit=248
read=25022 ->  Parallel Index Only Scan using
ncvhis_2016_12_03_voted_party_cd_idx on ncvhis_2016_12_03
(cost=0.44..372735.05 rows=12373755 width=0) (actual time=18.277..592.473
rows=9900389 loops=3) Heap Fetches: 0 Buffers: shared hit=248 read=25022
Planning Time: 0.069 ms JIT:
  Functions: 8
  Options: Inlining false, Optimization false, Expressions true,
Deforming true Timing: Generation 0.284 ms, Inlining 0.000 ms,
Optimization 0.268 ms, Emission 3.590 ms, Total 4.143 ms Execution Time:
847.498 ms

>explain (analyze, buffers) select count(*) from ncvhis_2020_08_01;
Finalize Aggregate  (cost=438377.94..438377.95 rows=1 width=8) (actual
time=624.700..628.024 rows=1 loops=1) Buffers: shared hit=286 read=27084
  ->  Gather  (cost=438377.73..438377.94 rows=2 width=8) (actual
time=624.669..628.016 rows=3 loops=1) Workers Planned: 2
        Workers Launched: 2
        Buffers: shared hit=286 read=27084
        ->  Partial Aggregate  (cost=437377.73..437377.74 rows=1 width=8)
(actual time=619.297..619.297 rows=1 loops=3) Buffers: shared hit=286
read=27084 ->  Parallel Index Only Scan using
ncvhis_2020_08_01_voted_party_cd_idx on ncvhis_2020_08_01
(cost=0.44..403856.78 rows=13408379 width=0) (actual time=0.029..357.697
rows=10724282 loops=3) Heap Fetches: 0 Buffers: shared hit=286 read=27084
Planning Time: 0.072 ms JIT:
  Functions: 8
  Options: Inlining false, Optimization false, Expressions true,
Deforming true Timing: Generation 0.285 ms, Inlining 0.000 ms,
Optimization 0.218 ms, Emission 3.933 ms, Total 4.435 ms Execution Time:
628.216 ms

>explain (analyze, buffers) select count(*) from ncvhis_2020_10_31;
Finalize Aggregate  (cost=438179.73..438179.74 rows=1 width=8) (actual
time=1090.209..1092.976 rows=1 loops=1) Buffers: shared hit=276 read=27095
  ->  Gather  (cost=438179.52..438179.73 rows=2 width=8) (actual
time=1090.141..1092.967 rows=3 loops=1) Workers Planned: 2
        Workers Launched: 2
        Buffers: shared hit=276 read=27095
        ->  Partial Aggregate  (cost=437179.52..437179.53 rows=1 width=8)
(actual time=1084.766..1084.767 rows=1 loops=3) Buffers: shared hit=276
read=27095 ->  Parallel Index Only Scan using
ncvhis_2020_10_31_voted_party_cd_idx on ncvhis_2020_10_31
(cost=0.44..403675.53 rows=13401595 width=0) (actual
time=222.686..816.447 rows=10720916 loops=3) Heap Fetches: 0 Buffers:
shared hit=276 read=27095
Planning Time: 0.131 ms JIT:
  Functions: 8
  Options: Inlining false, Optimization false, Expressions true,
Deforming true Timing: Generation 0.322 ms, Inlining 0.000 ms,
Optimization 0.261 ms, Emission 3.648 ms, Total 4.231 ms Execution Time:
1093.209 ms


Those responses are reasonably quick...  A suggestion from the Linux list
was to run "fstrim -v /mnt/work" which is the NVMe mount point for the DB:
 fstrim -nv /mnt/work
/mnt/work: 0 B (dry run) trimmed

$ fstrim -v /mnt/work
/mnt/work: 2 TiB (2248993087488 bytes) trimmed

but that didn't change anything noticeable.

Something I hadn't noticed before: SQL-workbench/J (build 129.6) displays
an execution timer at the bottom of the window.  I see all the queries
reporting 0-47ms which it plenty fast. It's the results that often take a
long time to display.


>You haven't shown any postgresql logs or your settings, so it's hard to
>know what you have already turned on.

data/pg_hba.conf:
local   all             all                                     trust
host    all             all             127.0.0.1/32            trust
host    all             all             ::1/128                 trust
local   replication     all                                     trust
host    replication     all             127.0.0.1/32            trust
host    replication     all             ::1/128                 trust


data/postgresql.conf:
max_connections = 100
shared_buffers = 128MB
dynamic_shared_memory_type = posix
max_wal_size = 4GB
min_wal_size = 80MB
log_statement = 'all'
log_timezone = 'America/New_York'
datestyle = 'iso, mdy'
timezone = 'America/New_York'
lc_messages = 'C'
lc_monetary = 'C'
lc_numeric = 'C'
lc_time = 'C'
default_text_search_config = 'pg_catalog.english'


>There are a ton of logging related parameters.

I'll turn some more on...  The only log I found which had info I could use
was the journald -- see attached files. The queries were automatically
triggered when selecting the tables in SQL-workbench/J.

Attached files:

Journal: contains several queries:
1. under 1 second
2. under 1 second
3. under 1 second; i/o response split across 2 iostat queries
4. under 1 second; i/o response split across 2 iostat queries
5. about 2 seconds; i/o response split across 2 iostat queries -- re-read?
6. under 1 second

journal2: contains a table where the i/o dribbled out slowly over ~97
seconds.
The tables that respond slowly are random and the time to respond is
random.

In case I didn't share this: I get new tables on Sat. mornings. The
entire DB is backed up (cron job) by stopping PG on Sun. morning, doing a
"cp -auf" to a platter drive; PG restart.  When I switched (via symlinks)
from the DB to the backup, the backup responds the same way; which is why
I no longer believe it's absolutely hardware -- until it's found _and_
fixed, I'll keep investigating.

>> I've only found logging in the journal;
>
>By "the journal" you mean the one maintained by journald? (Did you
>mention what OS you are using? From several outputs I'm guessing it is
>Linux). On Linux systems postgresql is usually set up to log into files
>somewhere under /var/log/postgresql (see the log_directory entry in
>postgresql.conf) but your setup might be different, of course.

Answered above.

I've been responding to a number of suggestions. Not sure I mentioned
this here:  I found and installed a firmware update to the NVMe SSD; but
that didn't change anything.

>        hp
>
Вложения
On 10/27/23 16:46, pf@pfortin.com wrote:
> Peter,
>
> Thanks for your patience; I've been feeling pressure to get this
> resolved; so have been lax in providing info here..  Hope the following
> helps...
>


> Something I hadn't noticed before: SQL-workbench/J (build 129.6) displays
> an execution timer at the bottom of the window.  I see all the queries
> reporting 0-47ms which it plenty fast. It's the results that often take a
> long time to display.

Which is not surprising as building GUI elements is an expensive
operation. If the time to display is your wait issue then this is not
really a disk issue. What happens if you use psql as the client?


--
Adrian Klaver
adrian.klaver@aklaver.com
On Fri, 27 Oct 2023 21:21:18 -0700 Adrian Klaver wrote:

>On 10/27/23 16:46, pf@pfortin.com wrote:
>> Peter,
>>
>> Thanks for your patience; I've been feeling pressure to get this
>> resolved; so have been lax in providing info here..  Hope the following
>> helps...
>>
>
>
>> Something I hadn't noticed before: SQL-workbench/J (build 129.6) displays
>> an execution timer at the bottom of the window.  I see all the queries
>> reporting 0-47ms which it plenty fast. It's the results that often take a
>> long time to display.
>
>Which is not surprising as building GUI elements is an expensive
>operation.

True; but not to this extent (minutes).

>If the time to display is your wait issue then this is not
>really a disk issue.

Guessing you didn't look at attachment "journal2"... it clearly shows
data from the disk coming out VERY slowly...

>What happens if you use psql as the client?

I see my reply on the 23rd only went to you (I'm still forgetting to
check which message I'm replying to -- this is unlike the other lists I
participate in, where the headers are set to force all messages through
the list server), my reply contained the psql info where psql shows long
delays too:

Hi Adrian,

Sorry about everything inline; I think it saves time vs dealing with
attachments...

Summary:
* single large partition dedicated to PG
* only PG seems affected
* buffered reads are 6x slower when PG queries are in progress
* psql queries of 30  33M [row] tables shows random results up to 4m51s
* successful psql queries below 500ms
* ls -l loop on another directory had no delays.

HTH...

The WB query was in disk-wait, so psql gave:
ncsbe=# select count(*) from ncvhis_2022_10_29;
FATAL:  terminating connection due to administrator command
server closed the connection unexpectedly
        This probably means the server terminated abnormally
        before or while processing the request.
The connection to the server was lost. Attempting reset: Succeeded.

The above query finished a second or two before the WB results
appeared; then this next query succeeded right after:
ncsbe=# select count(*) from
ncvhis_2022_10_29; count
----------
 33861176
(1 row)

Another table went into disk-wait long enough that I was able to query
the tmp directory on the same disk just fine.

Querying the same table; no error, canceled it:
ncsbe=# select count(*) from ncvhis_2022_07_23;
^CCancel request sent
ERROR:  canceling statement due to user request

While this table was still in disk-wait, tried another table which
returned quickly:
ncsbe=# select count(*) from ncvhis_2023_10_21;
  count
----------
 32983343
(1 row)

Eventually, the WB query did complete...

Next, I made a query list for 30 tables, turned on timing and pasted the
queries.  Pasting results inline:
ncsbe=# select count(*) from ncvhis_2012_12_06;
select count(*) from ncvhis_2016_12_03;
select count(*) from ncvhis_2020_08_01;
select count(*) from ncvhis_2020_10_31;
select count(*) from ncvhis_2020_12_05;
select count(*) from ncvhis_2020_12_26;
select count(*) from ncvhis_2021_03_06;
select count(*) from ncvhis_2021_06_12;
select count(*) from ncvhis_2022_07_23;
select count(*) from ncvhis_2022_10_15;
select count(*) from ncvhis_2022_10_22;
select count(*) from ncvhis_2022_10_29;
select count(*) from ncvhis_2022_11_05;
select count(*) from ncvhis_2022_11_12;
select count(*) from ncvhis_2022_11_19;
select count(*) from ncvhis_2022_11_26;
select count(*) from ncvhis_2022_12_03;
select count(*) from ncvhis_2022_12_10;
select count(*) from ncvhis_2022_12_17;
select count(*) from ncvhis_2022_12_24;
select count(*) from ncvhis_2022_12_31;
select count(*) from ncvhis_2023_01_08;
select count(*) from ncvhis_2023_01_14;
select count(*) from ncvhis_2023_01_21;
select count(*) from ncvhis_2023_01_28;
select count(*) from ncvhis_2023_02_04;
select count(*) from ncvhis_2023_02_11;
select count(*) from ncvhis_2023_02_18;
select count(*) from ncvhis_2023_02_27;
select count(*) from ncvhis_2023_03_04;
  count
----------
 31923950
(1 row)

Time: 72404.786 ms (01:12.405)
  count
----------
 29701168
(1 row)

Time: 301.246 ms
  count
----------
 32172845
(1 row)

Time: 409.974 ms
  count
----------
 32162748
(1 row)

Time: 363.836 ms
  count
----------
 34679651
(1 row)

Time: 351.167 ms
  count
----------
 35006711
(1 row)

Time: 348.378 ms
  count
----------
 35003995
(1 row)

Time: 348.712 ms
  count
----------
 34994502
(1 row)

Time: 351.901 ms
  count
----------
 33686292
(1 row)

Time: 487.837 ms
  count
----------
 33861658
(1 row)

Time: 40987.826 ms (00:40.988)
  count
----------
 33861381
(1 row)

Time: 76964.281 ms (01:16.964)
  count
----------
 33861176
(1 row)

Time: 483.329 ms
  count
----------
 33861071
(1 row)

Time: 18919.267 ms (00:18.919)
  count
----------
 29344354
(1 row)

Time: 50896.978 ms (00:50.897)
  count
----------
 30709227
(1 row)

Time: 25784.000 ms (00:25.784)
  count
----------
 32368001
(1 row)

Time: 45407.599 ms (00:45.408)
  count
----------
 33126826
(1 row)

Time: 75171.609 ms (01:15.172)
 count
----------
 33126808
(1 row)

Time: 88871.004 ms (01:28.871)
  count
----------
 33127317
(1 row)

Time: 128565.127 ms (02:08.565)
 count
----------
 33127192
(1 row)

Time: 210248.222 ms (03:30.248)
  count
----------
 33127117
(1 row)

Time: 246609.561 ms (04:06.610)   4 minutes!  ;p
  count
----------
 33124457
(1 row)

Time: 166406.283 ms (02:46.406)
  count
----------
 33123714
(1 row)

Time: 291483.538 ms (04:51.484)  nearly 5 minutes ;p ;p
  count
----------
 33123313
(1 row)

Time: 2269.961 ms (00:02.270)
  count
----------
 33123197
(1 row)

Time: 413.219 ms
  count
----------
 33123091
(1 row)

Time: 433.817 ms
  count
----------
 33122953
(1 row)

Time: 395.844 ms
  count
----------
 33122752
(1 row)

Time: 7251.637 ms (00:07.252)
  count
----------
 33122665
(1 row)

Time: 384.328 ms
  count
----------
 33122573
(1 row)

Time: 384.887 ms
ncsbe=#

I don't see a pattern in the above; matches the randomness I saw using
WB...

Before the above finished, I issued this command on another konsole...

$ while true; do ls -l > /tmp/ll; date; done
Mon Oct 23 05:12:54 PM EDT 2023
Mon Oct 23 05:12:54 PM EDT 2023
Mon Oct 23 05:12:54 PM EDT 2023
Mon Oct 23 05:12:54 PM EDT 2023
Mon Oct 23 05:12:54 PM EDT 2023
Mon Oct 23 05:12:54 PM EDT 2023
Mon Oct 23 05:12:54 PM EDT 2023
Mon Oct 23 05:12:54 PM EDT 2023
Mon Oct 23 05:12:54 PM EDT 2023
Mon Oct 23 05:12:54 PM EDT 2023
Mon Oct 23 05:12:54 PM EDT 2023
Mon Oct 23 05:12:54 PM EDT 2023
...
Lots of high speed output with no pauses, at 64 loops per second.

So that means only PG is getting disk waits.

This disk is dedicated to PG and a rarely used semi-permanent tmp
directory on a single partition.

This is from fdisk -l:
Disk /dev/nvme1n1: 3.64 TiB, 4000787030016 bytes, 7814037168 sectors
Disk model: Seagate FireCuda 530 ZP4000GM30023
Units: sectors of 1 * 512 = 512 bytes
Sector size (logical/physical): 512 bytes / 512 bytes
I/O size (minimum/optimal): 512 bytes / 512 bytes
Disklabel type: gpt
Disk identifier: 9B3C5D73-6FFD-475D-9E1E-26F43B41C690

Device         Start        End    Sectors  Size Type
/dev/nvme1n1p1  2048 7814035455 7814033408  3.6T Linux filesystem

$ hdparm -Tt /dev/nvme1n1
/dev/nvme1n1:
 Timing cached reads:   36820 MB in  2.00 seconds = 18434.72 MB/sec
 Timing buffered disk reads: 774 MB in  3.00 seconds = 257.74 MB/sec

The 30 queries still hadn't finished at this point...

Interesting: the hdparm buffered read is very slow; once the queries
finished, the disk performance is back:
$ hdparm -Tt /dev/nvme1n1

/dev/nvme1n1:
 Timing cached reads:   37382 MB in  2.00 seconds = 18715.85 MB/sec
 Timing buffered disk reads: 5002 MB in  3.17 seconds = 1575.89 MB/sec

Over 6x faster...

So far, the only disk waits I see are PG related.  Do have any opinion on
Ken's comment about parallel queries?

Thanks,
Pierre
On Fri, Oct 27, 2023 at 7:46 PM <pf@pfortin.com> wrote:
Memory: 125.5 GiB of RAM
It looks like you have a large amount of memory allocated to the server
But your plans are doing reads instead of pulling things from shared buffers
>explain (analyze, buffers) select count(*) from ncvhis_2016_12_03;
Finalize Aggregate (cost=404669.65..404669.66 rows=1 width=8) (actual
time=844.158..847.309 rows=1 loops=1) Buffers: shared hit=248 read=25022
-> Gather (cost=404669.43..404669.65 rows=2 width=8) (actual
time=844.133..847.301 rows=3 loops=1) Workers Planned: 2
Workers Launched: 2
Buffers: shared hit=248 read=25022
-> Partial Aggregate (cost=403669.43..403669.45 rows=1 width=8)
(actual time=838.772..838.772 rows=1 loops=3) Buffers: shared hit=248
read=25022 -> Parallel Index Only Scan using
ncvhis_2016_12_03_voted_party_cd_idx on ncvhis_2016_12_03
(cost=0.44..372735.05 rows=12373755 width=0) (actual time=18.277..592.473
rows=9900389 loops=3) Heap Fetches: 0 Buffers: shared hit=248 read=25022
Planning Time: 0.069 ms JIT:
Functions: 8
Options: Inlining false, Optimization false, Expressions true,
Deforming true Timing: Generation 0.284 ms, Inlining 0.000 ms,
Optimization 0.268 ms, Emission 3.590 ms, Total 4.143 ms Execution Time:
847.498 ms
data/postgresql.conf:
max_connections = 100
shared_buffers = 128MB
On Sat, 28 Oct 2023 18:34:50 -0400 Jim Mlodgenski wrote:

Looking like a GOLD star for Jim...

>On Fri, Oct 27, 2023 at 7:46 PM <pf@pfortin.com> wrote:
>
>> Memory: 125.5 GiB of RAM
>>
>It looks like you have a large amount of memory allocated to the server
>
>But your plans are doing reads instead of pulling things from shared
>buffers

Assuming you are referring to "Buffers: shared hit=248 read=25022" ?

>>explain (analyze, buffers) select count(*) from ncvhis_2016_12_03;
>> Finalize Aggregate  (cost=404669.65..404669.66 rows=1 width=8) (actual
>> time=844.158..847.309 rows=1 loops=1) Buffers: shared hit=248 read=25022
>>   ->  Gather  (cost=404669.43..404669.65 rows=2 width=8) (actual
>> time=844.133..847.301 rows=3 loops=1) Workers Planned: 2
>>         Workers Launched: 2
>>         Buffers: shared hit=248 read=25022
>>         ->  Partial Aggregate  (cost=403669.43..403669.45 rows=1
>> width=8) (actual time=838.772..838.772 rows=1 loops=3) Buffers: shared
>> hit=248 read=25022 ->  Parallel Index Only Scan using
>> ncvhis_2016_12_03_voted_party_cd_idx on ncvhis_2016_12_03
>> (cost=0.44..372735.05 rows=12373755 width=0) (actual
>> time=18.277..592.473 rows=9900389 loops=3) Heap Fetches: 0 Buffers:
>> shared hit=248 read=25022 Planning Time: 0.069 ms JIT:
>>   Functions: 8
>>   Options: Inlining false, Optimization false, Expressions true,
>> Deforming true Timing: Generation 0.284 ms, Inlining 0.000 ms,
>> Optimization 0.268 ms, Emission 3.590 ms, Total 4.143 ms Execution
>> Time: 847.498 ms
>>
>>
>
>
>data/postgresql.conf:
>> max_connections = 100
>> shared_buffers = 128MB

I semi-misquoted; it was running on 128MB when first reported; then 512MB
when I sent this message.

>It looks like you are running with the stock config for shared_buffers.
>With only 128MB dedicated for shared_buffers and such a big database,
>you'll be thrashing the cache pretty hard. With 125GB on the server, try
>upping shared_buffers to something more like 32GB.

WOW!  Some tables now have a barely noticeable delay; on the whole,
looking MUCH better. Testing with a just created copy[1] on the NVMe,
it's better; but it's slowly going back to longer delays. Looks like
count(*) may have easily-missed side-effects (more below). My team
members were suggesting a possible motherboard issue since the problem
happened on both the NVMe M.2 SSD, and on a backup SATA-3 platter drive.
Your suggestion arrived just in time as I was about to wipe out the SSD
and re-import everything fresh.

Another thing that bothers me is that when I copied the DB, the:
   cp -a ./var ./var2   # same drive, same partition
replicating the DB onto free space on the same SSD, it was experiencing
slow reads 18-20KB/sec; the writes were quick, large blocks; so I was
suspecting something with the SSD...  System buffers..?


How autoload row count (or count(*)) can hurt:

The queries which triggered this issue are all the same (WB built-in):
   SELECT count(*) FROM table;    # WB = SQL-workbench/J

These are all static tables. Does PG maintain a table row count so as to
avoid having to count each time?  WB is setup to:
* autoload table row count
* autoload table data (restricted with LIMIT)

Walking through these 8M & 33M row tables (3.8GB & 5.2GB respectively)
must be filling the shared_buffers and thrashing even 32GB...

Ah-ha! Turning off "autoload table row count" has "resolved" this issue. I
can now scroll through all the tables at high speed (hold down the arrow
key to walk through all the tables. Not very useful; but walking through
the tables with only 128MB shared-buffers would have been the ultimate
buffer thrashing... ;p  Even walking through the tables to collect their
row counts (whether manually or programmatically. ).

That said, the 32GB shared-buffers may now be masking NVMe drive issues...

Thanks!!!,
Pierre

Time and complexity to find the cause of an issue is inversely
proportional to the simplicity of the issue...
On 2023-10-27 19:46:09 -0400, pf@pfortin.com wrote:
> On Fri, 27 Oct 2023 19:07:11 +0200 Peter J. Holzer wrote:
> >Have you looked at the query plans as I recommended? (You might also
> >want to enable track_io_timing to get extra information, but comparing
> >just the query plans of fast and slow queries would be a first step)
>
> I didn't see how that would help since other than the table name the
> queries are identical.  Curious: are you implying PG stores tables
> differently?

No, but Postgres decides on the query depending on the statistics stored
about that table. If those statistics are off, the query plan can be
wildly different and very inefficient. So checking whether the plans are
plausible should be one of the first things you do when performance is
not what you expect. Indeed, on
https://wiki.postgresql.org/wiki/Slow_Query_Questions it is the very
first bullet point in the section "Things to Try Before You Post".

When you have established that the plan looks fine even when the
performance is poor then you have to look elsewhere. But even then it
helps to know what the database is actually trying to do.

        hp


--
   _  | Peter J. Holzer    | Story must make more sense than reality.
|_|_) |                    |
| |   | hjp@hjp.at         |    -- Charles Stross, "Creative writing
__/   | http://www.hjp.at/ |       challenge!"
Вложения
On 2023-10-29 09:21:46 -0400, pf@pfortin.com wrote:
> These are all static tables. Does PG maintain a table row count so as to
> avoid having to count each time?

No. To count the rows in a table, Postgres has to actually read the
whole table (or an index, if a suitable index (e.g. a primary key)
exists).

However, the table statistics contain an estimate for the number of
rows:

hjp=> select schemaname, relname, n_live_tup from pg_stat_user_tables order by 3 desc;
╔════════════╤═══════════════════════════╤════════════╗
║ schemaname │          relname          │ n_live_tup ║
╟────────────┼───────────────────────────┼────────────╢
║ public     │ ncvhis_2016_12_03         │    9999977 ║
║ public     │ random_test               │    1000000 ║
║ public     │ beislindex                │        351 ║
║ public     │ delivery                  │          6 ║
...


This is an estimate, not the actual count, so it might be wrong
(sometimes very wrong), but accessing it is fast and it might be good
enough for your purposes.

> WB is setup to:
> * autoload table row count
> * autoload table data (restricted with LIMIT)

Maybe WB can be set up to get n_live_tup instead of the real row count?

        hp

--
   _  | Peter J. Holzer    | Story must make more sense than reality.
|_|_) |                    |
| |   | hjp@hjp.at         |    -- Charles Stross, "Creative writing
__/   | http://www.hjp.at/ |       challenge!"
Вложения
On Sun, 29 Oct 2023 16:00:46 +0100 Peter J. Holzer wrote:

>On 2023-10-27 19:46:09 -0400, pf@pfortin.com wrote:
>> On Fri, 27 Oct 2023 19:07:11 +0200 Peter J. Holzer wrote:
>> >Have you looked at the query plans as I recommended? (You might also
>> >want to enable track_io_timing to get extra information, but comparing
>> >just the query plans of fast and slow queries would be a first step)
>>
>> I didn't see how that would help since other than the table name the
>> queries are identical.  Curious: are you implying PG stores tables
>> differently?
>
>No, but Postgres decides on the query depending on the statistics stored
>about that table. If those statistics are off, the query plan can be
>wildly different and very inefficient. So checking whether the plans are
>plausible should be one of the first things you do when performance is
>not what you expect. Indeed, on
>https://wiki.postgresql.org/wiki/Slow_Query_Questions it is the very
>first bullet point in the section "Things to Try Before You Post".
>
>When you have established that the plan looks fine even when the
>performance is poor then you have to look elsewhere. But even then it
>helps to know what the database is actually trying to do.
>
>        hp

Peter,

Thanks for this and the link... Thanks to Jim's post, I came to a similar
conclusion; but the above link could use a bit more emphasis on
shared_buffers.  I'm no longer enabling "autoload table row count" and
pointing out to our team that SELECT count(*) FROM table; is OK *unless*
done in a loop across many tables where shared-buffers may never be
enough to prevent thrashing...

Thanks,
Pierre
On Sun, 29 Oct 2023 16:16:05 +0100 Peter J. Holzer wrote:

>On 2023-10-29 09:21:46 -0400, pf@pfortin.com wrote:
>> These are all static tables. Does PG maintain a table row count so as to
>> avoid having to count each time?
>
>No. To count the rows in a table, Postgres has to actually read the
>whole table (or an index, if a suitable index (e.g. a primary key)
>exists).

Am I correct to assume count(fieldname) would only load that column for
counting?  In other words: we should be specific (avoid "*") in general?

>However, the table statistics contain an estimate for the number of
>rows:
>
>hjp=> select schemaname, relname, n_live_tup from pg_stat_user_tables order by 3 desc;
>╔════════════╤═══════════════════════════╤════════════╗
>║ schemaname │          relname          │ n_live_tup ║
>╟────────────┼───────────────────────────┼────────────╢
>║ public     │ ncvhis_2016_12_03         │    9999977 ║
>║ public     │ random_test               │    1000000 ║
>║ public     │ beislindex                │        351 ║
>║ public     │ delivery                  │          6 ║
>...

Are there prerequisites for this query?
Every (264) n_live_tup returned was zero...  though, VERY fast.. :)

>This is an estimate, not the actual count, so it might be wrong
>(sometimes very wrong), but accessing it is fast and it might be good
>enough for your purposes.

Thanks for sharing...  We're learning fast... :)

>> WB is setup to:
>> * autoload table row count
>> * autoload table data (restricted with LIMIT)
>
>Maybe WB can be set up to get n_live_tup instead of the real row count?

It appears this is hard-coded [on/off only]; but I thought I saw the WB
author post on this list recently...

>        hp
>
On 10/29/23 11:45, pf@pfortin.com wrote:
> On Sun, 29 Oct 2023 16:16:05 +0100 Peter J. Holzer wrote:
>
>> On 2023-10-29 09:21:46 -0400, pf@pfortin.com wrote:
>>> These are all static tables. Does PG maintain a table row count so as to
>>> avoid having to count each time?
>> No. To count the rows in a table, Postgres has to actually read the
>> whole table (or an index, if a suitable index (e.g. a primary key)
>> exists).
> Am I correct to assume count(fieldname) would only load that column for
> counting?

The OS reads (chunks of) blocks, not individual bytes, and Postgresql is
record oriented, not column-oriented.

> In other words: we should be specific (avoid "*") in general?

No.

--
Born in Arizona, moved to Babylonia.
On 10/29/23 09:45, pf@pfortin.com wrote:
> On Sun, 29 Oct 2023 16:16:05 +0100 Peter J. Holzer wrote:
>
>> On 2023-10-29 09:21:46 -0400, pf@pfortin.com wrote:
>>> These are all static tables. Does PG maintain a table row count so as to
>>> avoid having to count each time?
>>
>> No. To count the rows in a table, Postgres has to actually read the
>> whole table (or an index, if a suitable index (e.g. a primary key)
>> exists).
>
> Am I correct to assume count(fieldname) would only load that column for
> counting?  In other words: we should be specific (avoid "*") in general?

Read:

https://wiki.postgresql.org/wiki/Slow_Counting


>>> WB is setup to:
>>> * autoload table row count
>>> * autoload table data (restricted with LIMIT)
>>
>> Maybe WB can be set up to get n_live_tup instead of the real row count?

So basically you are dealing with a client issue.

>
> It appears this is hard-coded [on/off only]; but I thought I saw the WB
> author post on this list recently...
>
>>         hp
>>
>
>

--
Adrian Klaver
adrian.klaver@aklaver.com
On 2023-10-29 12:45:08 -0400, pf@pfortin.com wrote:
> On Sun, 29 Oct 2023 16:16:05 +0100 Peter J. Holzer wrote:
> >However, the table statistics contain an estimate for the number of
> >rows:
> >
> >hjp=> select schemaname, relname, n_live_tup from pg_stat_user_tables order by 3 desc;
> >╔════════════╤═══════════════════════════╤════════════╗
> >║ schemaname │          relname          │ n_live_tup ║
> >╟────────────┼───────────────────────────┼────────────╢
> >║ public     │ ncvhis_2016_12_03         │    9999977 ║
> >║ public     │ random_test               │    1000000 ║
> >║ public     │ beislindex                │        351 ║
> >║ public     │ delivery                  │          6 ║
> >...
>
> Are there prerequisites for this query?
> Every (264) n_live_tup returned was zero...  though, VERY fast.. :)

You need to ANALYZE the tables. Autovacuum should do this automatically
when it detects that a table has changed "enough" since the last
analyze, but for slowly growing tables that can sometimes take a long
time (indeed, I did an "analyze beislindex" just before the query above
because it showed only 25 tuples and I knew that wasn't right).

A count of 0 for a large table is weird, though.
Unless ... did you do a major version upgrade recently? That nukes the
statistics and you have to analyze everything again. Also, I'm not sure
if pg_restore triggers an analyze.

        hp

--
   _  | Peter J. Holzer    | Story must make more sense than reality.
|_|_) |                    |
| |   | hjp@hjp.at         |    -- Charles Stross, "Creative writing
__/   | http://www.hjp.at/ |       challenge!"