Обсуждение: Pgadmin4 System Stats Extension Design
Dear all,

I am working on pgadmin4 to let users see their system-level statistics on the dashboard. In this mail, I've attached the wireframe to display system stats on the existing dashboard.
I am open to hearing your thoughts and suggestions on the design.
Thanks,
Sahil
Вложения
Hi Sahil
At first glance, it looks good to me. Seems you have created a new tab System Statistics instead of using the existing dashboard.
On Tue, Jun 13, 2023 at 4:27 PM Sahil Harpal <sahilharpal1234@gmail.com> wrote:
Dear all,I am working on pgadmin4 to let users see their system-level statistics on the dashboard. In this mail, I've attached the wireframe to display system stats on the existing dashboard.I am open to hearing your thoughts and suggestions on the design.Thanks,Sahil
Thank you, Akshay, for your feedback.
Here are a few more designs that I have created based on the discussion with my mentors. I would love to know your thoughts on them.
Design 1 - Using an additional new tab for system statistics
Design 2 - Added buttons to toggle between existing dashboard data and system statistics.
Thanks,
Design 2 - Added buttons to toggle between existing dashboard data and system statistics.
Thanks,
Sahil

On Wed, 14 Jun 2023 at 10:12, Akshay Joshi <akshay.joshi@enterprisedb.com> wrote:
Hi SahilAt first glance, it looks good to me. Seems you have created a new tab System Statistics instead of using the existing dashboard.On Tue, Jun 13, 2023 at 4:27 PM Sahil Harpal <sahilharpal1234@gmail.com> wrote:Dear all,I am working on pgadmin4 to let users see their system-level statistics on the dashboard. In this mail, I've attached the wireframe to display system stats on the existing dashboard.I am open to hearing your thoughts and suggestions on the design.Thanks,Sahil

Вложения
Hi Sahil
On Thu, Jun 15, 2023 at 1:42 AM Sahil Harpal <sahilharpal1234@gmail.com> wrote:
Thank you, Akshay, for your feedback.Here are a few more designs that I have created based on the discussion with my mentors. I would love to know your thoughts on them.Design 1 - Using an additional new tab for system statistics
Design 2 - Added buttons to toggle between existing dashboard data and system statistics.
I personally like Design 2 as we have only one main tab "Dashboard" and then two sub-tabs "General"(Can be changed) and "System Statistics".
Thanks,SahilOn Wed, 14 Jun 2023 at 10:12, Akshay Joshi <akshay.joshi@enterprisedb.com> wrote:Hi SahilAt first glance, it looks good to me. Seems you have created a new tab System Statistics instead of using the existing dashboard.On Tue, Jun 13, 2023 at 4:27 PM Sahil Harpal <sahilharpal1234@gmail.com> wrote:Dear all,I am working on pgadmin4 to let users see their system-level statistics on the dashboard. In this mail, I've attached the wireframe to display system stats on the existing dashboard.I am open to hearing your thoughts and suggestions on the design.Thanks,Sahil
Hi Sahil,
I would suggest club OS, CPU, Process, Disk and I/O in a tabbed control. (Taking inspiration from the task manager).
It will reduce the network calls, cluttering and improve DOM performance.
On Thu, Jun 15, 2023 at 11:08 AM Akshay Joshi <akshay.joshi@enterprisedb.com> wrote:
Hi SahilOn Thu, Jun 15, 2023 at 1:42 AM Sahil Harpal <sahilharpal1234@gmail.com> wrote:Thank you, Akshay, for your feedback.Here are a few more designs that I have created based on the discussion with my mentors. I would love to know your thoughts on them.Design 1 - Using an additional new tab for system statistics
Design 2 - Added buttons to toggle between existing dashboard data and system statistics.I personally like Design 2 as we have only one main tab "Dashboard" and then two sub-tabs "General"(Can be changed) and "System Statistics".
Thanks,SahilOn Wed, 14 Jun 2023 at 10:12, Akshay Joshi <akshay.joshi@enterprisedb.com> wrote:Hi SahilAt first glance, it looks good to me. Seems you have created a new tab System Statistics instead of using the existing dashboard.On Tue, Jun 13, 2023 at 4:27 PM Sahil Harpal <sahilharpal1234@gmail.com> wrote:Dear all,I am working on pgadmin4 to let users see their system-level statistics on the dashboard. In this mail, I've attached the wireframe to display system stats on the existing dashboard.I am open to hearing your thoughts and suggestions on the design.Thanks,Sahil
Thanks,
Aditya Toshniwal
"Don't Complain about Heat, Plant a TREE"
Hi Aditya,
Thank you for pointing this out. It would also be more convenient for users to navigate to specific statistics easily.
So, can we finalise the following design?
- Single dashboard with buttons to toggle between General (existing graphs/stats) and System Statistics.
- Clubbing OS, CPU, Process, Disk and I/O in tabbed control.
So, can we finalise the following design?
- Single dashboard with buttons to toggle between General (existing graphs/stats) and System Statistics.
- Clubbing OS, CPU, Process, Disk and I/O in tabbed control.
Thanks,
Sahil

On Thu, 15 Jun 2023 at 11:21, Aditya Toshniwal <aditya.toshniwal@enterprisedb.com> wrote:
Hi Sahil,I would suggest club OS, CPU, Process, Disk and I/O in a tabbed control. (Taking inspiration from the task manager).It will reduce the network calls, cluttering and improve DOM performance.On Thu, Jun 15, 2023 at 11:08 AM Akshay Joshi <akshay.joshi@enterprisedb.com> wrote:Hi SahilOn Thu, Jun 15, 2023 at 1:42 AM Sahil Harpal <sahilharpal1234@gmail.com> wrote:Thank you, Akshay, for your feedback.Here are a few more designs that I have created based on the discussion with my mentors. I would love to know your thoughts on them.Design 1 - Using an additional new tab for system statistics
Design 2 - Added buttons to toggle between existing dashboard data and system statistics.I personally like Design 2 as we have only one main tab "Dashboard" and then two sub-tabs "General"(Can be changed) and "System Statistics".
Thanks,SahilOn Wed, 14 Jun 2023 at 10:12, Akshay Joshi <akshay.joshi@enterprisedb.com> wrote:Hi SahilAt first glance, it looks good to me. Seems you have created a new tab System Statistics instead of using the existing dashboard.On Tue, Jun 13, 2023 at 4:27 PM Sahil Harpal <sahilharpal1234@gmail.com> wrote:Dear all,I am working on pgadmin4 to let users see their system-level statistics on the dashboard. In this mail, I've attached the wireframe to display system stats on the existing dashboard.I am open to hearing your thoughts and suggestions on the design.Thanks,Sahil--Thanks,Aditya Toshniwal"Don't Complain about Heat, Plant a TREE"
On Thu, 15 Jun 2023 at 09:55, Sahil Harpal <sahilharpal1234@gmail.com> wrote:
Hi Aditya,Thank you for pointing this out. It would also be more convenient for users to navigate to specific statistics easily.
So, can we finalise the following design?
- Single dashboard with buttons to toggle between General (existing graphs/stats) and System Statistics.
Why use buttons and not tabs? Tabs are far more flexible as they can be re-arranged, docked differently etc.
- Clubbing OS, CPU, Process, Disk and I/O in tabbed control.
I think the current design has too much on one big page, so yes, I'd want to see those split up onto different tabs. Not sure about the grouping though. Maybe:
Summary (OS info, system specs etc)
CPU
Memory
Storage (including I/O)
Process info would be included on each tab as related to that tab's content - e.g. CPU per process on the CPU tab, memory per process on the memory tab, etc..)
Thanks,SahilOn Thu, 15 Jun 2023 at 11:21, Aditya Toshniwal <aditya.toshniwal@enterprisedb.com> wrote:Hi Sahil,I would suggest club OS, CPU, Process, Disk and I/O in a tabbed control. (Taking inspiration from the task manager).It will reduce the network calls, cluttering and improve DOM performance.On Thu, Jun 15, 2023 at 11:08 AM Akshay Joshi <akshay.joshi@enterprisedb.com> wrote:Hi SahilOn Thu, Jun 15, 2023 at 1:42 AM Sahil Harpal <sahilharpal1234@gmail.com> wrote:Thank you, Akshay, for your feedback.Here are a few more designs that I have created based on the discussion with my mentors. I would love to know your thoughts on them.Design 1 - Using an additional new tab for system statistics
Design 2 - Added buttons to toggle between existing dashboard data and system statistics.I personally like Design 2 as we have only one main tab "Dashboard" and then two sub-tabs "General"(Can be changed) and "System Statistics".
Thanks,SahilOn Wed, 14 Jun 2023 at 10:12, Akshay Joshi <akshay.joshi@enterprisedb.com> wrote:Hi SahilAt first glance, it looks good to me. Seems you have created a new tab System Statistics instead of using the existing dashboard.On Tue, Jun 13, 2023 at 4:27 PM Sahil Harpal <sahilharpal1234@gmail.com> wrote:Dear all,I am working on pgadmin4 to let users see their system-level statistics on the dashboard. In this mail, I've attached the wireframe to display system stats on the existing dashboard.I am open to hearing your thoughts and suggestions on the design.Thanks,Sahil--Thanks,Aditya Toshniwal"Don't Complain about Heat, Plant a TREE"
Regarding I/O analysis, what would be more beneficial, combining total read/total write etc., per disk OR Sahil doing a different graph for each parameter for all the disks?
On Thu, Jun 15, 2023 at 3:22 PM Dave Page <dpage@pgadmin.org> wrote:
On Thu, 15 Jun 2023 at 09:55, Sahil Harpal <sahilharpal1234@gmail.com> wrote:Hi Aditya,Thank you for pointing this out. It would also be more convenient for users to navigate to specific statistics easily.
So, can we finalise the following design?
- Single dashboard with buttons to toggle between General (existing graphs/stats) and System Statistics.Why use buttons and not tabs? Tabs are far more flexible as they can be re-arranged, docked differently etc.- Clubbing OS, CPU, Process, Disk and I/O in tabbed control.I think the current design has too much on one big page, so yes, I'd want to see those split up onto different tabs. Not sure about the grouping though. Maybe:Summary (OS info, system specs etc)CPUMemoryStorage (including I/O)Process info would be included on each tab as related to that tab's content - e.g. CPU per process on the CPU tab, memory per process on the memory tab, etc..)Thanks,SahilOn Thu, 15 Jun 2023 at 11:21, Aditya Toshniwal <aditya.toshniwal@enterprisedb.com> wrote:Hi Sahil,I would suggest club OS, CPU, Process, Disk and I/O in a tabbed control. (Taking inspiration from the task manager).It will reduce the network calls, cluttering and improve DOM performance.On Thu, Jun 15, 2023 at 11:08 AM Akshay Joshi <akshay.joshi@enterprisedb.com> wrote:Hi SahilOn Thu, Jun 15, 2023 at 1:42 AM Sahil Harpal <sahilharpal1234@gmail.com> wrote:Thank you, Akshay, for your feedback.Here are a few more designs that I have created based on the discussion with my mentors. I would love to know your thoughts on them.Design 1 - Using an additional new tab for system statistics
Design 2 - Added buttons to toggle between existing dashboard data and system statistics.I personally like Design 2 as we have only one main tab "Dashboard" and then two sub-tabs "General"(Can be changed) and "System Statistics".
Thanks,SahilOn Wed, 14 Jun 2023 at 10:12, Akshay Joshi <akshay.joshi@enterprisedb.com> wrote:Hi SahilAt first glance, it looks good to me. Seems you have created a new tab System Statistics instead of using the existing dashboard.On Tue, Jun 13, 2023 at 4:27 PM Sahil Harpal <sahilharpal1234@gmail.com> wrote:Dear all,I am working on pgadmin4 to let users see their system-level statistics on the dashboard. In this mail, I've attached the wireframe to display system stats on the existing dashboard.I am open to hearing your thoughts and suggestions on the design.Thanks,Sahil--Thanks,Aditya Toshniwal"Don't Complain about Heat, Plant a TREE"--
On Thu, 15 Jun 2023 at 11:07, Khushboo Vashi <khushboo.vashi@enterprisedb.com> wrote:
Regarding I/O analysis, what would be more beneficial, combining total read/total write etc., per disk OR Sahil doing a different graph for each parameter for all the disks?
I think combining R/W is fine, as long as it uses two scales in case the values are wildly different (which is likely).
On Thu, Jun 15, 2023 at 3:22 PM Dave Page <dpage@pgadmin.org> wrote:On Thu, 15 Jun 2023 at 09:55, Sahil Harpal <sahilharpal1234@gmail.com> wrote:Hi Aditya,Thank you for pointing this out. It would also be more convenient for users to navigate to specific statistics easily.
So, can we finalise the following design?
- Single dashboard with buttons to toggle between General (existing graphs/stats) and System Statistics.Why use buttons and not tabs? Tabs are far more flexible as they can be re-arranged, docked differently etc.- Clubbing OS, CPU, Process, Disk and I/O in tabbed control.I think the current design has too much on one big page, so yes, I'd want to see those split up onto different tabs. Not sure about the grouping though. Maybe:Summary (OS info, system specs etc)CPUMemoryStorage (including I/O)Process info would be included on each tab as related to that tab's content - e.g. CPU per process on the CPU tab, memory per process on the memory tab, etc..)Thanks,SahilOn Thu, 15 Jun 2023 at 11:21, Aditya Toshniwal <aditya.toshniwal@enterprisedb.com> wrote:Hi Sahil,I would suggest club OS, CPU, Process, Disk and I/O in a tabbed control. (Taking inspiration from the task manager).It will reduce the network calls, cluttering and improve DOM performance.On Thu, Jun 15, 2023 at 11:08 AM Akshay Joshi <akshay.joshi@enterprisedb.com> wrote:Hi SahilOn Thu, Jun 15, 2023 at 1:42 AM Sahil Harpal <sahilharpal1234@gmail.com> wrote:Thank you, Akshay, for your feedback.Here are a few more designs that I have created based on the discussion with my mentors. I would love to know your thoughts on them.Design 1 - Using an additional new tab for system statistics
Design 2 - Added buttons to toggle between existing dashboard data and system statistics.I personally like Design 2 as we have only one main tab "Dashboard" and then two sub-tabs "General"(Can be changed) and "System Statistics".
Thanks,SahilOn Wed, 14 Jun 2023 at 10:12, Akshay Joshi <akshay.joshi@enterprisedb.com> wrote:Hi SahilAt first glance, it looks good to me. Seems you have created a new tab System Statistics instead of using the existing dashboard.On Tue, Jun 13, 2023 at 4:27 PM Sahil Harpal <sahilharpal1234@gmail.com> wrote:Dear all,I am working on pgadmin4 to let users see their system-level statistics on the dashboard. In this mail, I've attached the wireframe to display system stats on the existing dashboard.I am open to hearing your thoughts and suggestions on the design.Thanks,Sahil--Thanks,Aditya Toshniwal"Don't Complain about Heat, Plant a TREE"--

I think combining R/W is fine, as long as it uses two scales in case the values are wildly different (which is likely).
| | Sender notified by Mailtrack | 16/06/23, 14:14:28 |
On Thu, 15 Jun 2023 at 16:27, Dave Page <dpage@pgadmin.org> wrote:
On Thu, 15 Jun 2023 at 11:07, Khushboo Vashi <khushboo.vashi@enterprisedb.com> wrote:Regarding I/O analysis, what would be more beneficial, combining total read/total write etc., per disk OR Sahil doing a different graph for each parameter for all the disks?I think combining R/W is fine, as long as it uses two scales in case the values are wildly different (which is likely).On Thu, Jun 15, 2023 at 3:22 PM Dave Page <dpage@pgadmin.org> wrote:On Thu, 15 Jun 2023 at 09:55, Sahil Harpal <sahilharpal1234@gmail.com> wrote:Hi Aditya,Thank you for pointing this out. It would also be more convenient for users to navigate to specific statistics easily.
So, can we finalise the following design?
- Single dashboard with buttons to toggle between General (existing graphs/stats) and System Statistics.Why use buttons and not tabs? Tabs are far more flexible as they can be re-arranged, docked differently etc.- Clubbing OS, CPU, Process, Disk and I/O in tabbed control.I think the current design has too much on one big page, so yes, I'd want to see those split up onto different tabs. Not sure about the grouping though. Maybe:Summary (OS info, system specs etc)CPUMemoryStorage (including I/O)Process info would be included on each tab as related to that tab's content - e.g. CPU per process on the CPU tab, memory per process on the memory tab, etc..)Thanks,SahilOn Thu, 15 Jun 2023 at 11:21, Aditya Toshniwal <aditya.toshniwal@enterprisedb.com> wrote:Hi Sahil,I would suggest club OS, CPU, Process, Disk and I/O in a tabbed control. (Taking inspiration from the task manager).It will reduce the network calls, cluttering and improve DOM performance.On Thu, Jun 15, 2023 at 11:08 AM Akshay Joshi <akshay.joshi@enterprisedb.com> wrote:Hi SahilOn Thu, Jun 15, 2023 at 1:42 AM Sahil Harpal <sahilharpal1234@gmail.com> wrote:Thank you, Akshay, for your feedback.Here are a few more designs that I have created based on the discussion with my mentors. I would love to know your thoughts on them.Design 1 - Using an additional new tab for system statistics
Design 2 - Added buttons to toggle between existing dashboard data and system statistics.I personally like Design 2 as we have only one main tab "Dashboard" and then two sub-tabs "General"(Can be changed) and "System Statistics".
Thanks,SahilOn Wed, 14 Jun 2023 at 10:12, Akshay Joshi <akshay.joshi@enterprisedb.com> wrote:Hi SahilAt first glance, it looks good to me. Seems you have created a new tab System Statistics instead of using the existing dashboard.On Tue, Jun 13, 2023 at 4:27 PM Sahil Harpal <sahilharpal1234@gmail.com> wrote:Dear all,I am working on pgadmin4 to let users see their system-level statistics on the dashboard. In this mail, I've attached the wireframe to display system stats on the existing dashboard.I am open to hearing your thoughts and suggestions on the design.Thanks,Sahil--Thanks,Aditya Toshniwal"Don't Complain about Heat, Plant a TREE"----
Hi Dave,
Could you please confirm whether we can proceed with the following grouping?
1. Summary
Could you please confirm whether we can proceed with the following grouping?
1. Summary
- OS information
- Sys CPU Information
- Sys Process Information
2. CPU
I have also attached the dashboard layout, as you suggested.
Thanks,
- Sys CPU Usage Information
- Sys Load Avg Information
- Process Name/Pid - CPU Usage (From Process)
- Sys Memory Information
- Process Name/Pid - Memory Usage and Memory Bytes (From Process)
- Sys Disk Information
- Sys I/O Analysis Information
I have also attached the dashboard layout, as you suggested.
Thanks,
Sahil

On Thu, 15 Jun 2023 at 15:22, Dave Page <dpage@pgadmin.org> wrote:
On Thu, 15 Jun 2023 at 09:55, Sahil Harpal <sahilharpal1234@gmail.com> wrote:Hi Aditya,Thank you for pointing this out. It would also be more convenient for users to navigate to specific statistics easily.
So, can we finalise the following design?
- Single dashboard with buttons to toggle between General (existing graphs/stats) and System Statistics.Why use buttons and not tabs? Tabs are far more flexible as they can be re-arranged, docked differently etc.- Clubbing OS, CPU, Process, Disk and I/O in tabbed control.I think the current design has too much on one big page, so yes, I'd want to see those split up onto different tabs. Not sure about the grouping though. Maybe:Summary (OS info, system specs etc)CPUMemoryStorage (including I/O)Process info would be included on each tab as related to that tab's content - e.g. CPU per process on the CPU tab, memory per process on the memory tab, etc..)Thanks,SahilOn Thu, 15 Jun 2023 at 11:21, Aditya Toshniwal <aditya.toshniwal@enterprisedb.com> wrote:Hi Sahil,I would suggest club OS, CPU, Process, Disk and I/O in a tabbed control. (Taking inspiration from the task manager).It will reduce the network calls, cluttering and improve DOM performance.On Thu, Jun 15, 2023 at 11:08 AM Akshay Joshi <akshay.joshi@enterprisedb.com> wrote:Hi SahilOn Thu, Jun 15, 2023 at 1:42 AM Sahil Harpal <sahilharpal1234@gmail.com> wrote:Thank you, Akshay, for your feedback.Here are a few more designs that I have created based on the discussion with my mentors. I would love to know your thoughts on them.Design 1 - Using an additional new tab for system statistics
Design 2 - Added buttons to toggle between existing dashboard data and system statistics.I personally like Design 2 as we have only one main tab "Dashboard" and then two sub-tabs "General"(Can be changed) and "System Statistics".
Thanks,SahilOn Wed, 14 Jun 2023 at 10:12, Akshay Joshi <akshay.joshi@enterprisedb.com> wrote:Hi SahilAt first glance, it looks good to me. Seems you have created a new tab System Statistics instead of using the existing dashboard.On Tue, Jun 13, 2023 at 4:27 PM Sahil Harpal <sahilharpal1234@gmail.com> wrote:Dear all,I am working on pgadmin4 to let users see their system-level statistics on the dashboard. In this mail, I've attached the wireframe to display system stats on the existing dashboard.I am open to hearing your thoughts and suggestions on the design.Thanks,Sahil--Thanks,Aditya Toshniwal"Don't Complain about Heat, Plant a TREE"--
Вложения
On Sat, 17 Jun 2023 at 10:01, Sahil Harpal <sahilharpal1234@gmail.com> wrote:
Hi Dave,
Could you please confirm whether we can proceed with the following grouping?
1. Summary
- OS information
- Sys CPU Information
- Sys Process Information
2. CPU3. Memory
- Sys CPU Usage Information
- Sys Load Avg Information
- Process Name/Pid - CPU Usage (From Process)
4. Storage (including I/O)
- Sys Memory Information
- Process Name/Pid - Memory Usage and Memory Bytes (From Process)
- Sys Disk Information
- Sys I/O Analysis Information
I have also attached the dashboard layout, as you suggested.
Seems reasonable to me. A wireframe would seem like the best next step, to confirm we're all happy with what's proposed. It's hard to visualise from a list of bullet points.
On Mon, Jun 19, 2023 at 2:07 PM Dave Page <dpage@pgadmin.org> wrote:
On Sat, 17 Jun 2023 at 10:01, Sahil Harpal <sahilharpal1234@gmail.com> wrote:Hi Dave,
Could you please confirm whether we can proceed with the following grouping?
1. Summary
- OS information
- Sys CPU Information
- Sys Process Information
2. CPU3. Memory
- Sys CPU Usage Information
- Sys Load Avg Information
- Process Name/Pid - CPU Usage (From Process)
4. Storage (including I/O)
- Sys Memory Information
- Process Name/Pid - Memory Usage and Memory Bytes (From Process)
- Sys Disk Information
- Sys I/O Analysis Information
Can we please remove the 'Sys' prefix from these chart titles? (It looks redundant to me).
I have also attached the dashboard layout, as you suggested.Seems reasonable to me. A wireframe would seem like the best next step, to confirm we're all happy with what's proposed. It's hard to visualise from a list of bullet points.
--
Ashesh Vashi

On Fri, 16 Jun 2023 at 14:15, Sahil Harpal <sahilharpal1234@gmail.com> wrote:
I think combining R/W is fine, as long as it uses two scales in case the values are wildly different (which is likely).So should I combine all the parameters (Total read/write operations, Total Bytes read/write, and time spent) in a single graph for one disk or just the total number of read/write operations?
Could you please also clarify this?
On Fri, 16 Jun 2023 at 14:15, Sahil Harpal <sahilharpal1234@gmail.com> wrote:
I think combining R/W is fine, as long as it uses two scales in case the values are wildly different (which is likely).So should I combine all the parameters (Total read/write operations, Total Bytes read/write, and time spent) in a single graph for one disk or just the total number of read/write operations?

Sender notified by
Mailtrack16/06/23, 14:14:28 On Thu, 15 Jun 2023 at 16:27, Dave Page <dpage@pgadmin.org> wrote:On Thu, 15 Jun 2023 at 11:07, Khushboo Vashi <khushboo.vashi@enterprisedb.com> wrote:Regarding I/O analysis, what would be more beneficial, combining total read/total write etc., per disk OR Sahil doing a different graph for each parameter for all the disks?I think combining R/W is fine, as long as it uses two scales in case the values are wildly different (which is likely).On Thu, Jun 15, 2023 at 3:22 PM Dave Page <dpage@pgadmin.org> wrote:On Thu, 15 Jun 2023 at 09:55, Sahil Harpal <sahilharpal1234@gmail.com> wrote:Hi Aditya,Thank you for pointing this out. It would also be more convenient for users to navigate to specific statistics easily.
So, can we finalise the following design?
- Single dashboard with buttons to toggle between General (existing graphs/stats) and System Statistics.Why use buttons and not tabs? Tabs are far more flexible as they can be re-arranged, docked differently etc.- Clubbing OS, CPU, Process, Disk and I/O in tabbed control.I think the current design has too much on one big page, so yes, I'd want to see those split up onto different tabs. Not sure about the grouping though. Maybe:Summary (OS info, system specs etc)CPUMemoryStorage (including I/O)Process info would be included on each tab as related to that tab's content - e.g. CPU per process on the CPU tab, memory per process on the memory tab, etc..)Thanks,SahilOn Thu, 15 Jun 2023 at 11:21, Aditya Toshniwal <aditya.toshniwal@enterprisedb.com> wrote:Hi Sahil,I would suggest club OS, CPU, Process, Disk and I/O in a tabbed control. (Taking inspiration from the task manager).It will reduce the network calls, cluttering and improve DOM performance.On Thu, Jun 15, 2023 at 11:08 AM Akshay Joshi <akshay.joshi@enterprisedb.com> wrote:Hi SahilOn Thu, Jun 15, 2023 at 1:42 AM Sahil Harpal <sahilharpal1234@gmail.com> wrote:Thank you, Akshay, for your feedback.Here are a few more designs that I have created based on the discussion with my mentors. I would love to know your thoughts on them.Design 1 - Using an additional new tab for system statistics
Design 2 - Added buttons to toggle between existing dashboard data and system statistics.I personally like Design 2 as we have only one main tab "Dashboard" and then two sub-tabs "General"(Can be changed) and "System Statistics".
Thanks,SahilOn Wed, 14 Jun 2023 at 10:12, Akshay Joshi <akshay.joshi@enterprisedb.com> wrote:Hi SahilAt first glance, it looks good to me. Seems you have created a new tab System Statistics instead of using the existing dashboard.On Tue, Jun 13, 2023 at 4:27 PM Sahil Harpal <sahilharpal1234@gmail.com> wrote:Dear all,I am working on pgadmin4 to let users see their system-level statistics on the dashboard. In this mail, I've attached the wireframe to display system stats on the existing dashboard.I am open to hearing your thoughts and suggestions on the design.Thanks,Sahil--Thanks,Aditya Toshniwal"Don't Complain about Heat, Plant a TREE"----
On Mon, 19 Jun 2023 at 15:30, Sahil Harpal <sahilharpal1234@gmail.com> wrote:
On Fri, 16 Jun 2023 at 14:15, Sahil Harpal <sahilharpal1234@gmail.com> wrote:I think combining R/W is fine, as long as it uses two scales in case the values are wildly different (which is likely).So should I combine all the parameters (Total read/write operations, Total Bytes read/write, and time spent) in a single graph for one disk or just the total number of read/write operations?Could you please also clarify this?
Don't combine ops/time/bytes etc, but you can combine read/write, input/output etc. as we do on the existing graphs.
On Fri, 16 Jun 2023 at 14:15, Sahil Harpal <sahilharpal1234@gmail.com> wrote:I think combining R/W is fine, as long as it uses two scales in case the values are wildly different (which is likely).So should I combine all the parameters (Total read/write operations, Total Bytes read/write, and time spent) in a single graph for one disk or just the total number of read/write operations?
Sender notified by
Mailtrack16/06/23, 14:14:28 On Thu, 15 Jun 2023 at 16:27, Dave Page <dpage@pgadmin.org> wrote:On Thu, 15 Jun 2023 at 11:07, Khushboo Vashi <khushboo.vashi@enterprisedb.com> wrote:Regarding I/O analysis, what would be more beneficial, combining total read/total write etc., per disk OR Sahil doing a different graph for each parameter for all the disks?I think combining R/W is fine, as long as it uses two scales in case the values are wildly different (which is likely).On Thu, Jun 15, 2023 at 3:22 PM Dave Page <dpage@pgadmin.org> wrote:On Thu, 15 Jun 2023 at 09:55, Sahil Harpal <sahilharpal1234@gmail.com> wrote:Hi Aditya,Thank you for pointing this out. It would also be more convenient for users to navigate to specific statistics easily.
So, can we finalise the following design?
- Single dashboard with buttons to toggle between General (existing graphs/stats) and System Statistics.Why use buttons and not tabs? Tabs are far more flexible as they can be re-arranged, docked differently etc.- Clubbing OS, CPU, Process, Disk and I/O in tabbed control.I think the current design has too much on one big page, so yes, I'd want to see those split up onto different tabs. Not sure about the grouping though. Maybe:Summary (OS info, system specs etc)CPUMemoryStorage (including I/O)Process info would be included on each tab as related to that tab's content - e.g. CPU per process on the CPU tab, memory per process on the memory tab, etc..)Thanks,SahilOn Thu, 15 Jun 2023 at 11:21, Aditya Toshniwal <aditya.toshniwal@enterprisedb.com> wrote:Hi Sahil,I would suggest club OS, CPU, Process, Disk and I/O in a tabbed control. (Taking inspiration from the task manager).It will reduce the network calls, cluttering and improve DOM performance.On Thu, Jun 15, 2023 at 11:08 AM Akshay Joshi <akshay.joshi@enterprisedb.com> wrote:Hi SahilOn Thu, Jun 15, 2023 at 1:42 AM Sahil Harpal <sahilharpal1234@gmail.com> wrote:Thank you, Akshay, for your feedback.Here are a few more designs that I have created based on the discussion with my mentors. I would love to know your thoughts on them.Design 1 - Using an additional new tab for system statistics
Design 2 - Added buttons to toggle between existing dashboard data and system statistics.I personally like Design 2 as we have only one main tab "Dashboard" and then two sub-tabs "General"(Can be changed) and "System Statistics".
Thanks,SahilOn Wed, 14 Jun 2023 at 10:12, Akshay Joshi <akshay.joshi@enterprisedb.com> wrote:Hi SahilAt first glance, it looks good to me. Seems you have created a new tab System Statistics instead of using the existing dashboard.On Tue, Jun 13, 2023 at 4:27 PM Sahil Harpal <sahilharpal1234@gmail.com> wrote:Dear all,I am working on pgadmin4 to let users see their system-level statistics on the dashboard. In this mail, I've attached the wireframe to display system stats on the existing dashboard.I am open to hearing your thoughts and suggestions on the design.Thanks,Sahil--Thanks,Aditya Toshniwal"Don't Complain about Heat, Plant a TREE"----
On Mon, 19 Jun 2023 at 14:07, Dave Page <dpage@pgadmin.org> wrote:

Seems reasonable to me. A wireframe would seem like the best next step, to confirm we're all happy with what's proposed. It's hard to visualise from a list of bullet points.
Hi all,
I am attaching the updated wireframes.
Thanks,
Sahil
Вложения
On Mon, 19 Jun 2023 at 16:11, Sahil Harpal <sahilharpal1234@gmail.com> wrote:
On Mon, 19 Jun 2023 at 14:07, Dave Page <dpage@pgadmin.org> wrote:Seems reasonable to me. A wireframe would seem like the best next step, to confirm we're all happy with what's proposed. It's hard to visualise from a list of bullet points.Hi all,I am attaching the updated wireframes.
Hi,
It's not quite what I was suggesting - you have Read for 4 disks on one graph, and Write for 4 on another etc. (and then total reads and writes separately for each disk). I was suggesting one graph per disk (as you did for reads/writes) for each pair of read/write metrics.
I'd aim for 3 graphs per row on a normal display (Total Reads/Total Writes, Bytes Read/Bytes Written, Time Reading/Time Writing), and 1 for small displays (never 2, as that will always look unbalanced).
As Ashesh noted, you should also omit the "Sys" part of the names (and various other labels will need to be cleaned up), but there's no need to do that on the wireframe.

Hi Dave,
On Mon, 19 Jun 2023 at 20:51, Dave Page <dpage@pgadmin.org> wrote:
I'd aim for 3 graphs per row on a normal display (Total Reads/Total Writes, Bytes Read/Bytes Written, Time Reading/Time Writing).
I am attaching the new design.
I have added 3 graphs per row for every Disk separately. Could you please confirm whether it is what you are suggesting?
Вложения
On Mon, 19 Jun 2023 at 21:01, Sahil Harpal <sahilharpal1234@gmail.com> wrote:
Hi Dave,On Mon, 19 Jun 2023 at 20:51, Dave Page <dpage@pgadmin.org> wrote:I'd aim for 3 graphs per row on a normal display (Total Reads/Total Writes, Bytes Read/Bytes Written, Time Reading/Time Writing).I am attaching the new design.I have added 3 graphs per row for every Disk separately. Could you please confirm whether it is what you are suggesting?
Looks good to me!
I tried combining the process and handle count in a single graph. But as you can see in the attached image, insights are not properly visible since the difference between the values is too large. Even when the process count is 320, without tooltips, it appears as zero. Can we draw separate graphs for both? Or do you think the current single combined version is fine?

Вложения
Can you add a different scale on the right hand side? I haven’t familiarised myself with the library we’re using now, but others I’ve used can do that.
On Sat, 24 Jun 2023 at 22:02, Sahil Harpal <sahilharpal1234@gmail.com> wrote:
I tried combining the process and handle count in a single graph. But as you can see in the attached image, insights are not properly visible since the difference between the values is too large. Even when the process count is 320, without tooltips, it appears as zero. Can we draw separate graphs for both? Or do you think the current single combined version is fine?
On Sun, Jun 25, 2023, 3:02 AM Dave Page <dpage@pgadmin.org> wrote:
Can you add a different scale on the right hand side? I haven’t familiarised myself with the library we’re using now, but others I’ve used can do that.
Yeah sure. I think we can do this by passing few additional configuration options. I'll let you know it that works.
Hi,
I have written code for the Summary and CPU tabs and would like to post it here for review.
I'm currently displaying the static values in the process info pie chart because of a minor bug. The pg_sys_process_info() query takes much longer (around 2 mins) to execute and prevents the updation of other graphs and tables. I tried adding it in separate useInterval with larger pollDelay, but it didn't work. In the patch, I commented out that snippet (In Summary.jsx).
I'm attaching the WIP.patch file which contains the latest changes and also the SS of the Summary and CPU tabs.

Вложения
On Tue, Jul 11, 2023 at 11:58 AM Sahil Harpal <sahilharpal1234@gmail.com> wrote:
Hi,I have written code for the Summary and CPU tabs and would like to post it here for review.
I'm currently displaying the static values in the process info pie chart because of a minor bug. The pg_sys_process_info() query takes much longer (around 2 mins) to execute and prevents the updation of other graphs and tables. I tried adding it in separate useInterval with larger pollDelay, but it didn't work. In the patch, I commented out that snippet (In Summary.jsx).
Try preloading the extension in the PostgreSQL server.
e.g. Add this extension in the 'shared_preload_libraries' in postgresql.conf.
Reference: https://pgpedia.info/s/shared_preload_libraries.html
e.g. Add this extension in the 'shared_preload_libraries' in postgresql.conf.
Reference: https://pgpedia.info/s/shared_preload_libraries.html
-- Ashesh
I'm attaching the WIP.patch file which contains the latest changes and also the SS of the Summary and CPU tabs.
On Tue, 11 Jul 2023 at 12:04, Ashesh Vashi <ashesh.vashi@enterprisedb.com> wrote:

Try preloading the extension in the PostgreSQL server.
e.g. Add this extension in the 'shared_preload_libraries' in postgresql.conf.
Reference: https://pgpedia.info/s/shared_preload_libraries.html
Thank you, Ashesh! I will try this and provide you with an update.
On Tue, 11 Jul 2023 at 12:39, Aditya Toshniwal <aditya.toshniwal@enterprisedb.com> wrote:
Hi Sahil,Just to mention, make sure you're not using any chart component other than StreamingChart if the data is frequently updated.We have faced performance issues for continuously updating charts with Chart.js.
Also, as Aditya has mentioned, yeah, it will definitely affect the performance, as re-rendering the charts would be costly. So, would love to know suggestions for Disk info and Process info, as we have decided to use pie and bar charts over there.
Either we can reload the charts only when the tab changes, or we can use StreamingChart for them too?Also, currently, StreamingChart is not formatting the axis values and takes much space in case of larger values eg. memory_usage, handle_count etc. Can we add a custom formatter for y-axis values? I have attached the images for the same.
Вложения
Hi Sahil,
On Tue, Jul 11, 2023 at 2:29 PM Sahil Harpal <sahilharpal1234@gmail.com> wrote:
On Tue, 11 Jul 2023 at 12:04, Ashesh Vashi <ashesh.vashi@enterprisedb.com> wrote:Try preloading the extension in the PostgreSQL server.
e.g. Add this extension in the 'shared_preload_libraries' in postgresql.conf.
Reference: https://pgpedia.info/s/shared_preload_libraries.htmlThank you, Ashesh! I will try this and provide you with an update.On Tue, 11 Jul 2023 at 12:39, Aditya Toshniwal <aditya.toshniwal@enterprisedb.com> wrote:Hi Sahil,Just to mention, make sure you're not using any chart component other than StreamingChart if the data is frequently updated.We have faced performance issues for continuously updating charts with Chart.js.Also, as Aditya has mentioned, yeah, it will definitely affect the performance, as re-rendering the charts would be costly. So, would love to know suggestions for Disk info and Process info, as we have decided to use pie and bar charts over there.
Disk info doesn't need to be updated live. You can update it once on every tab change. I feel process info should be a bar chart. The categories are fixed in number and we can use StreamingChart for bar chart.
Either we can reload the charts only when the tab changes, or we can use StreamingChart for them too?Also, currently, StreamingChart is not formatting the axis values and takes much space in case of larger values eg. memory_usage, handle_count etc. Can we add a custom formatter for y-axis values? I have attached the images for the same.
Sure, you can tweak StreamingChart.
Thanks,
Aditya Toshniwal
"Don't Complain about Heat, Plant a TREE"

On Tue, Jul 11, 2023 at 2:29 PM Sahil Harpal <sahilharpal1234@gmail.com> wrote:
On Tue, 11 Jul 2023 at 12:04, Ashesh Vashi <ashesh.vashi@enterprisedb.com> wrote:Try preloading the extension in the PostgreSQL server.
e.g. Add this extension in the 'shared_preload_libraries' in postgresql.conf.
Reference: https://pgpedia.info/s/shared_preload_libraries.htmlThank you, Ashesh! I will try this and provide you with an update.
I tried adding 'system_stats' in the 'shared_preload_libraries', but it doesn't work.
On Tue, 11 Jul 2023 at 14:38, Aditya Toshniwal <aditya.toshniwal@enterprisedb.com> wrote:
Disk info doesn't need to be updated live. You can update it once on every tab change. I feel process info should be a bar chart. The categories are fixed in number and we can use StreamingChart for bar chart.
Okay sure.
Please ignore the previous WIP.patch file. I missed to include few untracked changes.
I have attached the new patch file. Sorry for the inconvenience.
New patch consist:
- Single dashboard with option to toggle between General and System Statistics
- Summary tab (except process info details).
- CPU Details
- Memory Details
Thanks,
Sahil
Вложения
On Tue, Jul 11, 2023 at 8:45 PM Sahil Harpal <sahilharpal1234@gmail.com> wrote:
On Tue, Jul 11, 2023 at 2:29 PM Sahil Harpal <sahilharpal1234@gmail.com> wrote:On Tue, 11 Jul 2023 at 12:04, Ashesh Vashi <ashesh.vashi@enterprisedb.com> wrote:Try preloading the extension in the PostgreSQL server.
e.g. Add this extension in the 'shared_preload_libraries' in postgresql.conf.
Reference: https://pgpedia.info/s/shared_preload_libraries.htmlThank you, Ashesh! I will try this and provide you with an update.I tried adding 'system_stats' in the 'shared_preload_libraries', but it doesn't work.
Did you restart the database server?
-- Ashesh
On Tue, 11 Jul 2023 at 14:38, Aditya Toshniwal <aditya.toshniwal@enterprisedb.com> wrote:Disk info doesn't need to be updated live. You can update it once on every tab change. I feel process info should be a bar chart. The categories are fixed in number and we can use StreamingChart for bar chart.Okay sure.Please ignore the previous WIP.patch file. I missed to include few untracked changes.I have attached the new patch file. Sorry for the inconvenience.New patch consist:
- Single dashboard with option to toggle between General and System Statistics
- Summary tab (except process info details).
- CPU Details
- Memory Details
Thanks,Sahil
On Tue, Jul 11, 2023 at 8:45 PM Sahil Harpal <sahilharpal1234@gmail.com> wrote:
On Tue, Jul 11, 2023 at 2:29 PM Sahil Harpal <sahilharpal1234@gmail.com> wrote:On Tue, 11 Jul 2023 at 12:04, Ashesh Vashi <ashesh.vashi@enterprisedb.com> wrote:Try preloading the extension in the PostgreSQL server.
e.g. Add this extension in the 'shared_preload_libraries' in postgresql.conf.
Reference: https://pgpedia.info/s/shared_preload_libraries.htmlThank you, Ashesh! I will try this and provide you with an update.I tried adding 'system_stats' in the 'shared_preload_libraries', but it doesn't work.On Tue, 11 Jul 2023 at 14:38, Aditya Toshniwal <aditya.toshniwal@enterprisedb.com> wrote:Disk info doesn't need to be updated live. You can update it once on every tab change. I feel process info should be a bar chart. The categories are fixed in number and we can use StreamingChart for bar chart.Okay sure.Please ignore the previous WIP.patch file. I missed to include few untracked changes.I have attached the new patch file. Sorry for the inconvenience.New patch consist:
- Single dashboard with option to toggle between General and System Statistics
- Summary tab (except process info details).
- CPU Details
- Memory Details
It fails while applying. Can you please rebase your patch and send it?
Thanks,Sahil
On Wed, 12 Jul 2023 at 10:47, Khushboo Vashi <khushboo.vashi@enterprisedb.com> wrote:

It fails while applying. Can you please rebase your patch and send it?
Could you please try the attached patch.
Вложения
On Wed, 12 Jul 2023 at 10:26, Ashesh Vashi <ashesh.vashi@enterprisedb.com> wrote:

On Tue, Jul 11, 2023 at 8:45 PM Sahil Harpal <sahilharpal1234@gmail.com> wrote:On Tue, Jul 11, 2023 at 2:29 PM Sahil Harpal <sahilharpal1234@gmail.com> wrote:On Tue, 11 Jul 2023 at 12:04, Ashesh Vashi <ashesh.vashi@enterprisedb.com> wrote:Try preloading the extension in the PostgreSQL server.
e.g. Add this extension in the 'shared_preload_libraries' in postgresql.conf.
Reference: https://pgpedia.info/s/shared_preload_libraries.htmlThank you, Ashesh! I will try this and provide you with an update.I tried adding 'system_stats' in the 'shared_preload_libraries', but it doesn't work.Did you restart the database server?
Yep.
On Wed, Jul 12, 2023 at 4:20 PM Sahil Harpal <sahilharpal1234@gmail.com> wrote:
On Wed, 12 Jul 2023 at 10:26, Ashesh Vashi <ashesh.vashi@enterprisedb.com> wrote:On Tue, Jul 11, 2023 at 8:45 PM Sahil Harpal <sahilharpal1234@gmail.com> wrote:On Tue, Jul 11, 2023 at 2:29 PM Sahil Harpal <sahilharpal1234@gmail.com> wrote:On Tue, 11 Jul 2023 at 12:04, Ashesh Vashi <ashesh.vashi@enterprisedb.com> wrote:Try preloading the extension in the PostgreSQL server.
e.g. Add this extension in the 'shared_preload_libraries' in postgresql.conf.
Reference: https://pgpedia.info/s/shared_preload_libraries.htmlThank you, Ashesh! I will try this and provide you with an update.I tried adding 'system_stats' in the 'shared_preload_libraries', but it doesn't work.Did you restart the database server?Yep.
If it is an extension issue, you may want to create an issue in its github repo with reproduction steps, current & expected behaviour.
-- Ashesh
On Wed, Jul 12, 2023, 4:33 PM Ashesh Vashi <ashesh.vashi@enterprisedb.com> wrote:
If it is an extension issue, you may want to create an issue in its github repo with reproduction steps, current & expected behaviour.
I think the issue is mostly with windows systems can anyone please confirm whether the pg_sys_process_info() take long time to execute on Linux or Mac systems also? Like in case of Windows it call Win32_Process.
If we somehow we able to execute this query seperately, I think we would probably resolve this issue as then it won't block others.
On Wed, Jul 12, 2023, 3:58 PM Sahil Harpal <sahilharpal1234@gmail.com> wrote:
Could you please try the attached patch.
Could you please confirm whether it's working or not? Also is there anything that we can improve in this patch.
Thanks,
Sahil
Hello all,
Regarding the storage tab and the disk information charts, we have decided to display two charts:
We need to find a suitable label or identifier to distinguish all the disks correctly. Any suggestions or solutions to this problem?
Please find the attached image showing the output of a query for your reference.
Regarding the storage tab and the disk information charts, we have decided to display two charts:
- A pie chart to represent the proportion of total space.
- A bar chart to display the space available and used.
We need to find a suitable label or identifier to distinguish all the disks correctly. Any suggestions or solutions to this problem?
Please find the attached image showing the output of a query for your reference.
Thanks,
Sahil

Вложения
On Mon, Jul 24, 2023 at 1:30 AM Sahil Harpal <sahilharpal1234@gmail.com> wrote:
Hello all,
Regarding the storage tab and the disk information charts, we have decided to display two charts:However, I'm facing an issue with the output of a query, as it is returning null values for "mount_point" and "drive_letter," and the same names for "file_system." This makes it difficult to distinguish between different disks.
- A pie chart to represent the proportion of total space.
- A bar chart to display the space available and used.
Please share the exact output of the query to get any suggestions.
-- Ashesh
We need to find a suitable label or identifier to distinguish all the disks correctly. Any suggestions or solutions to this problem?
Please find the attached image showing the output of a query for your reference.Thanks,Sahil
On Mon, 24 Jul 2023 at 10:57, Ashesh Vashi <ashesh.vashi@enterprisedb.com> wrote:

Please share the exact output of the query to get any suggestions.
The following is the output returned by the query:
mount_point | file_system | drive_letter | drive_type | file_system_type | total_space | used_space | free_space | total_inodes | used_inodes | free_inodes
-------------+-------------+--------------+------------+------------------+--------------+--------------+--------------+--------------+-------------+-------------
| NTFS | C: | 3 | | 499350761472 | 86123380736 | 413227380736 | | |
| NTFS | | 3 | | 633335808 | 543641600 | 89694208 | | |
| NTFS | | 3 | | 500913139712 | 106947141632 | 393965998080 | | |
| NTFS | | 3 | | 499288895488 | 237867192320 | 261421703168 | | |
| FAT32 | | 3 | | 100663296 | 52180992 | 48482304 | | |
(5 rows)
On Mon, 24 Jul 2023 at 10:30, Sahil Harpal <sahilharpal1234@gmail.com> wrote:
On Mon, 24 Jul 2023 at 10:57, Ashesh Vashi <ashesh.vashi@enterprisedb.com> wrote:Please share the exact output of the query to get any suggestions.The following is the output returned by the query:mount_point | file_system | drive_letter | drive_type | file_system_type | total_space | used_space | free_space | total_inodes | used_inodes | free_inodes
-------------+-------------+--------------+------------+------------------+--------------+--------------+--------------+--------------+-------------+-------------
| NTFS | C: | 3 | | 499350761472 | 86123380736 | 413227380736 | | |
| NTFS | | 3 | | 633335808 | 543641600 | 89694208 | | |
| NTFS | | 3 | | 500913139712 | 106947141632 | 393965998080 | | |
| NTFS | | 3 | | 499288895488 | 237867192320 | 261421703168 | | |
| FAT32 | | 3 | | 100663296 | 52180992 | 48482304 | | |
(5 rows)
On your system, what are the volumes without letters etc? If they're things like swap/pagefile, recovery partition etc, then they can probably be omitted (e.g. SELECT ... WHERE mount_point IS NOT NULL OR drive_letter IS NOT NULL).
On Mon, 24 Jul 2023 at 15:34, Dave Page <dpage@pgadmin.org> wrote:

On your system, what are the volumes without letters etc? If they're things like swap/pagefile, recovery partition etc, then they can probably be omitted (e.g. SELECT ... WHERE mount_point IS NOT NULL OR drive_letter IS NOT NULL).
On my system, the SSD is assigned the letter C, and I have partitioned my HDD into two partitions with the letters F and G.
On Mon, 24 Jul 2023 at 11:47, Sahil Harpal <sahilharpal1234@gmail.com> wrote:
On Mon, 24 Jul 2023 at 15:34, Dave Page <dpage@pgadmin.org> wrote:On your system, what are the volumes without letters etc? If they're things like swap/pagefile, recovery partition etc, then they can probably be omitted (e.g. SELECT ... WHERE mount_point IS NOT NULL OR drive_letter IS NOT NULL).On my system, the SSD is assigned the letter C, and I have partitioned my HDD into two partitions with the letters F and G.
OK, so F and G are not being shown in the query results (or more correctly, they are there, but the drive letter is showing as NULL?). If so, that seems like a bug in the extension.
On Mon, 24 Jul 2023 at 16:39, Dave Page <dpage@pgadmin.org> wrote:

OK, so F and G are not being shown in the query results (or more correctly, they are there, but the drive letter is showing as NULL?). If so, that seems like a bug in the extension.
Yeah, it's showing NULL for the F and G drives. Can anyone please confirm this once to just ensure it's not my system's fault?

On Wed, 12 Jul 2023 at 15:58, Sahil Harpal <sahilharpal1234@gmail.com> wrote:
On Wed, 12 Jul 2023 at 10:47, Khushboo Vashi <khushboo.vashi@enterprisedb.com> wrote:It fails while applying. Can you please rebase your patch and send it?Could you please try the attached patch.
Just a follow-up email to check if I can proceed with a similar structure and logic for the remaining disk tab.
If anyone has faced any issues while using it or has any suggestions for improvement, please let me know, and I will make the necessary changes and follow the same approach for the disk tab. Although there is an issue with drive's letters, the I/O analysis of block devices is working just fine on my system, so I can probably start working on it parallelly.
Thanks,
Sahil
Вложения
Hi Sahil,
On Thu, Jul 27, 2023 at 1:09 PM Sahil Harpal <sahilharpal1234@gmail.com> wrote:
On Wed, 12 Jul 2023 at 15:58, Sahil Harpal <sahilharpal1234@gmail.com> wrote:On Wed, 12 Jul 2023 at 10:47, Khushboo Vashi <khushboo.vashi@enterprisedb.com> wrote:It fails while applying. Can you please rebase your patch and send it?Could you please try the attached patch.Just a follow-up email to check if I can proceed with a similar structure and logic for the remaining disk tab.If anyone has faced any issues while using it or has any suggestions for improvement, please let me know, and I will make the necessary changes and follow the same approach for the disk tab. Although there is an issue with drive's letters, the I/O analysis of block devices is working just fine on my system, so I can probably start working on it parallelly.
Some initial review comments.
- While applying the patch, I got warnings; please fix those.
- Fix PEP-8 errors (yarn run pep8)
- Fix the linter errors. Run yarn run bundle:dev instead of yarn run webpacker so you will get the linter errors on every run.
- If the System Stat extension does not exist, display the appropriate message instead of blank graphs.
- For the first time, graphs start from the opposite side, and after the following API call, those get adjusted; please fix that.
- Please consider the refresh rate for the API calls (preferences settings > Dashboards > Refresh rates)
The code review is in progress; I will send my review comments once completed.
Thanks,
Khushboo
Thanks,Sahil
Вложения
On Thu, Jul 27, 2023 at 1:59 PM Khushboo Vashi <khushboo.vashi@enterprisedb.com> wrote:
Hi Sahil,On Thu, Jul 27, 2023 at 1:09 PM Sahil Harpal <sahilharpal1234@gmail.com> wrote:On Wed, 12 Jul 2023 at 15:58, Sahil Harpal <sahilharpal1234@gmail.com> wrote:On Wed, 12 Jul 2023 at 10:47, Khushboo Vashi <khushboo.vashi@enterprisedb.com> wrote:It fails while applying. Can you please rebase your patch and send it?Could you please try the attached patch.Just a follow-up email to check if I can proceed with a similar structure and logic for the remaining disk tab.
You have made different files tab-wise; it would be more manageable if you could put them under a subfolder OR start a name with system_state or something like that.
If anyone has faced any issues while using it or has any suggestions for improvement, please let me know, and I will make the necessary changes and follow the same approach for the disk tab. Although there is an issue with drive's letters, the I/O analysis of block devices is working just fine on my system, so I can probably start working on it parallelly.Some initial review comments.- While applying the patch, I got warnings; please fix those.- Fix PEP-8 errors (yarn run pep8)- Fix the linter errors. Run yarn run bundle:dev instead of yarn run webpacker so you will get the linter errors on every run.- If the System Stat extension does not exist, display the appropriate message instead of blank graphs.- For the first time, graphs start from the opposite side, and after the following API call, those get adjusted; please fix that.- Please consider the refresh rate for the API calls (preferences settings > Dashboards > Refresh rates)The code review is in progress; I will send my review comments once completed.Thanks,KhushbooThanks,Sahil
Вложения
Hi Khushboo,
On Thu, 27 Jul 2023 at 16:26, Khushboo Vashi <khushboo.vashi@enterprisedb.com> wrote:

You have made different files tab-wise; it would be more manageable if you could put them under a subfolder OR start a name with system_state or something like that.On Thu, Jul 27, 2023 at 1:59 PM Khushboo Vashi <khushboo.vashi@enterprisedb.com> wrote:Some initial review comments.- While applying the patch, I got warnings; please fix those.- Fix PEP-8 errors (yarn run pep8)- Fix the linter errors. Run yarn run bundle:dev instead of yarn run webpacker so you will get the linter errors on every run.- If the System Stat extension does not exist, display the appropriate message instead of blank graphs.- For the first time, graphs start from the opposite side, and after the following API call, those get adjusted; please fix that.- Please consider the refresh rate for the API calls (preferences settings > Dashboards > Refresh rates)
Thank you for the feedback. I have made all the changes as you have suggested, except for the issue where graphs are starting from opposite sides. I am using the same StreamingChart component that is already there. I just made a few changes to handle multiple Y-axes. I tried debugging it, but haven't found a solution yet. However, I also checked the pgAdmin4 desktop application, and I observed a similar behavior there. The initial graphs start from the opposite side and then get adjusted automatically, but the transition is a little faster there. Could you please help identify what might be causing this issue?
Thank you,
Sahil
Hi Sahil,
On Wed, Aug 2, 2023 at 6:14 PM Sahil Harpal <sahilharpal1234@gmail.com> wrote:
Hi Khushboo,On Thu, 27 Jul 2023 at 16:26, Khushboo Vashi <khushboo.vashi@enterprisedb.com> wrote:You have made different files tab-wise; it would be more manageable if you could put them under a subfolder OR start a name with system_state or something like that.On Thu, Jul 27, 2023 at 1:59 PM Khushboo Vashi <khushboo.vashi@enterprisedb.com> wrote:Some initial review comments.- While applying the patch, I got warnings; please fix those.- Fix PEP-8 errors (yarn run pep8)- Fix the linter errors. Run yarn run bundle:dev instead of yarn run webpacker so you will get the linter errors on every run.- If the System Stat extension does not exist, display the appropriate message instead of blank graphs.- For the first time, graphs start from the opposite side, and after the following API call, those get adjusted; please fix that.- Please consider the refresh rate for the API calls (preferences settings > Dashboards > Refresh rates)Thank you for the feedback. I have made all the changes as you have suggested, except for the issue where graphs are starting from opposite sides. I am using the same StreamingChart component that is already there. I just made a few changes to handle multiple Y-axes. I tried debugging it, but haven't found a solution yet. However, I also checked the pgAdmin4 desktop application, and I observed a similar behavior there. The initial graphs start from the opposite side and then get adjusted automatically, but the transition is a little faster there. Could you please help identify what might be causing this issue?
Because it is the default behaviour of streaming. You can add a prop reverse=true to StreamingChart and change the code ret.reverse(); based on condition.
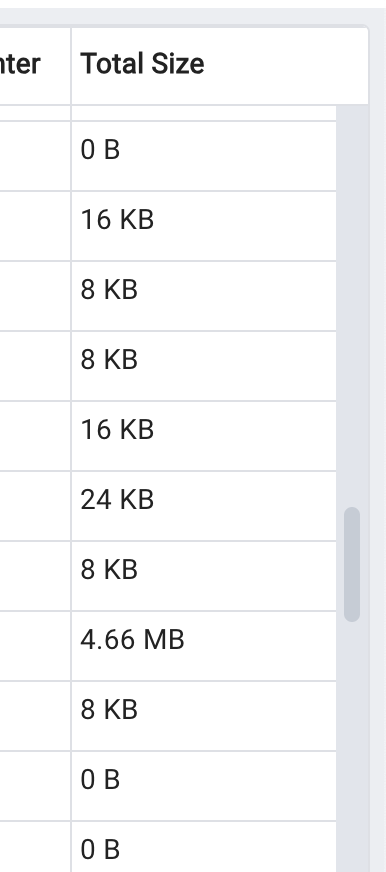
Unrelated to this, I think instead of showing disk sizes in bytes you can show them in a human readable format like below used in Statistics tab of Tables collection node.
Thank you,Sahil
Thanks,
Aditya Toshniwal
"Don't Complain about Heat, Plant a TREE"
Вложения
Hi Aditya,
On Thu, 3 Aug 2023 at 09:32, Aditya Toshniwal <aditya.toshniwal@enterprisedb.com> wrote

Because it is the default behaviour of streaming. You can add a prop reverse=true to StreamingChart and change the code ret.reverse(); based on condition.
So basically, you are suggesting to add one additional property to the streaming chart, right? Based on its value, apply ret.reverse(). This means if reverse is true, apply ret.reverse(), otherwise don't. But it is required to reverse our data every time, otherwise, I believe the most recent data point will be at the beginning of our plot.
I've tried one more approach here. If our data array is full, this graph shifting won't happen. So, if we initialize our data list with null values, there won't be any visible shift. What do you think about this solution?
I've tried one more approach here. If our data array is full, this graph shifting won't happen. So, if we initialize our data list with null values, there won't be any visible shift. What do you think about this solution?
Unrelated to this, I think instead of showing disk sizes in bytes you can show them in a human readable format like below used in Statistics tab of Tables collection node.
Sure I'll do this!
Hi Sahil,
On Sun, Aug 6, 2023 at 1:21 PM Sahil Harpal <sahilharpal1234@gmail.com> wrote:
Hi Aditya,On Thu, 3 Aug 2023 at 09:32, Aditya Toshniwal <aditya.toshniwal@enterprisedb.com> wroteBecause it is the default behaviour of streaming. You can add a prop reverse=true to StreamingChart and change the code ret.reverse(); based on condition.So basically, you are suggesting to add one additional property to the streaming chart, right? Based on its value, apply ret.reverse(). This means if reverse is true, apply ret.reverse(), otherwise don't. But it is required to reverse our data every time, otherwise, I believe the most recent data point will be at the beginning of our plot.
I've tried one more approach here. If our data array is full, this graph shifting won't happen. So, if we initialize our data list with null values, there won't be any visible shift. What do you think about this solution?
I would suggest changing the behaviour in StreamingChart so that it can be used at other places. If you want to reverse it then you can still do it. I had achieved reverse direction with the following piece of code. Basically, creating an array of 75 points, filling it with available points and reverse. You can change it based on reverse=true flag. In your case, simply reverse, not need of 75 points.
Array.from(new Array(xRange).keys()),
...(data.datasets?.map((d)=>{
let ret = [...d.data];
ret.reverse();
return ret;
})??{}),
Unrelated to this, I think instead of showing disk sizes in bytes you can show them in a human readable format like below used in Statistics tab of Tables collection node.Sure I'll do this!
Thanks,
Aditya Toshniwal
"Don't Complain about Heat, Plant a TREE"
Hi Aditya,
On Mon, 7 Aug 2023 at 11:01, Aditya Toshniwal <aditya.toshniwal@enterprisedb.com> wrote:

Hi Sahil,I would suggest changing the behaviour in StreamingChart so that it can be used at other places. If you want to reverse it then you can still do it. I had achieved reverse direction with the following piece of code. Basically, creating an array of 75 points, filling it with available points and reverse. You can change it based on reverse=true flag. In your case, simply reverse, not need of 75 points.Array.from(new Array(xRange).keys()),...(data.datasets?.map((d)=>{let ret = [...d.data];ret.reverse();return ret;})??{}),
I'm a little confused here. So, the code snippet above is exactly what's used to initialize the data currently.
The expected behavior is that the graph should start from the right side only. However, currently, when the page loads, for a few seconds, the graphs are visible on the left side and then shift to the right.
I think we can skip the reverse if we make changes in the statsReducer method.
The expected behavior is that the graph should start from the right side only. However, currently, when the page loads, for a few seconds, the graphs are visible on the left side and then shift to the right.
I think we can skip the reverse if we make changes in the statsReducer method.
action.counter ? action.incoming[label] - action.counterData[label] : action.incoming[label],
...state[label].slice(0, X_AXIS_LENGTH-1),
Here, we are adding new data to the beginning and selecting the first X_AXIS_LENGTH-1 datapoints from the previous state. However, an alternative approach would be to initially take the X_AXIS_LENGTH-1 elements from the end of the array, then add a new element to the end. This would eliminate the need to reverse the array.
I believe this reversal isn't causing any issues, but something might be occurring during graph plotting. Reversing just ensures that the most recent data point remains on the right within the stream.
I believe this reversal isn't causing any issues, but something might be occurring during graph plotting. Reversing just ensures that the most recent data point remains on the right within the stream.
Thank you,
Sahil
On Mon, Aug 7, 2023 at 4:47 PM Sahil Harpal <sahilharpal1234@gmail.com> wrote:
Hi Aditya,On Mon, 7 Aug 2023 at 11:01, Aditya Toshniwal <aditya.toshniwal@enterprisedb.com> wrote:Hi Sahil,I would suggest changing the behaviour in StreamingChart so that it can be used at other places. If you want to reverse it then you can still do it. I had achieved reverse direction with the following piece of code. Basically, creating an array of 75 points, filling it with available points and reverse. You can change it based on reverse=true flag. In your case, simply reverse, not need of 75 points.Array.from(new Array(xRange).keys()),...(data.datasets?.map((d)=>{let ret = [...d.data];ret.reverse();return ret;})??{}),I'm a little confused here. So, the code snippet above is exactly what's used to initialize the data currently.
The expected behavior is that the graph should start from the right side only. However, currently, when the page loads, for a few seconds, the graphs are visible on the left side and then shift to the right.
I think we can skip the reverse if we make changes in the statsReducer method.action.counter ? action.incoming[label] - action.counterData[label] : action.incoming[label],...state[label].slice(0, X_AXIS_LENGTH-1),Here, we are adding new data to the beginning and selecting the first X_AXIS_LENGTH-1 datapoints from the previous state. However, an alternative approach would be to initially take the X_AXIS_LENGTH-1 elements from the end of the array, then add a new element to the end. This would eliminate the need to reverse the array.
I believe this reversal isn't causing any issues, but something might be occurring during graph plotting. Reversing just ensures that the most recent data point remains on the right within the stream.
OK I thought you wanted the graph to go from left to right. Yeah, I have seen that glitch a few times (but rare). I think you can ignore it for now, we can look into it once we get time. It is not a priority.
The reason data reversing and stuff is maintained in StreaminChart is - Pass the data points and StreamingChart will appear from right to left. Don't want the source to take efforts to reverse and fill.
Thank you,Sahil
Thanks,
Aditya Toshniwal
"Don't Complain about Heat, Plant a TREE"
Hi all,
Pending Work:

I have attached the updated patch with recent changes.
New changes:
- Displayed the appropriate message If the System Stat extension does not exist.
- Provided option to configure refresh rates for the API calls (Preferences settings > Dashboards > Refresh rates).
- Added I/O analysis of block devices under the storage tab.
- Fixed PEP-8 errors.
- Fixed the linter errors.
- Moved all the system stats related .jsx files under a seperate folder "dashboard/static/js/SystemStats".
- Added formatter to convert disk sizes (in bytes) to human readable format.
- Process information -
- Issue: The pg_sys_process_info() query takes much longer (more than 2 mins) to execute and prevents the updation of other graphs and tables.
- Disk information -
- Issue: The pg_sys_disk_info() query returns NULL value for some of the drive letters.
- StreamingChart -
- Issue: Graph shifting glitch. For the first time, graphs start from the opposite side, and after the following API call or a few seconds later, those get adjusted.
I need suggestions for labels for different tables and charts. Also, could you please clarify the use of the counterData variable, which is used for some of the charts (tps_stats, ti_stats, to_stats, and bio_stats)?
Thank you,
Sahil
Вложения
Hi,
This email is regarding the recent patch I shared with you. Have you encountered any issues or identified areas for improvement? Additionally, could you assist me in resolving the challenges I'm currently facing and provide suggestions for chart titles?
Thanks,
Sahil

On Thu, 10 Aug 2023 at 00:37, Sahil Harpal <sahilharpal1234@gmail.com> wrote:
Hi all,I have attached the updated patch with recent changes.New changes:Pending Work:
- Displayed the appropriate message If the System Stat extension does not exist.
- Provided option to configure refresh rates for the API calls (Preferences settings > Dashboards > Refresh rates).
- Added I/O analysis of block devices under the storage tab.
- Fixed PEP-8 errors.
- Fixed the linter errors.
- Moved all the system stats related .jsx files under a seperate folder "dashboard/static/js/SystemStats".
- Added formatter to convert disk sizes (in bytes) to human readable format.
- Process information -
- Issue: The pg_sys_process_info() query takes much longer (more than 2 mins) to execute and prevents the updation of other graphs and tables.
- Disk information -
- Issue: The pg_sys_disk_info() query returns NULL value for some of the drive letters.
- StreamingChart -
- Issue: Graph shifting glitch. For the first time, graphs start from the opposite side, and after the following API call or a few seconds later, those get adjusted.
I need suggestions for labels for different tables and charts. Also, could you please clarify the use of the counterData variable, which is used for some of the charts (tps_stats, ti_stats, to_stats, and bio_stats)?Thank you,Sahil
Can you please rebase the patch and send it again?
On Thu, Aug 10, 2023 at 12:37 AM Sahil Harpal <sahilharpal1234@gmail.com> wrote:
Hi all,I have attached the updated patch with recent changes.New changes:Pending Work:
- Displayed the appropriate message If the System Stat extension does not exist.
- Provided option to configure refresh rates for the API calls (Preferences settings > Dashboards > Refresh rates).
- Added I/O analysis of block devices under the storage tab.
- Fixed PEP-8 errors.
- Fixed the linter errors.
- Moved all the system stats related .jsx files under a seperate folder "dashboard/static/js/SystemStats".
- Added formatter to convert disk sizes (in bytes) to human readable format.
- Process information -
- Issue: The pg_sys_process_info() query takes much longer (more than 2 mins) to execute and prevents the updation of other graphs and tables.
- Disk information -
- Issue: The pg_sys_disk_info() query returns NULL value for some of the drive letters.
- StreamingChart -
- Issue: Graph shifting glitch. For the first time, graphs start from the opposite side, and after the following API call or a few seconds later, those get adjusted.
I need suggestions for labels for different tables and charts. Also, could you please clarify the use of the counterData variable, which is used for some of the charts (tps_stats, ti_stats, to_stats, and bio_stats)?Thank you,Sahil

On Wed, Aug 16, 2023 at 11:09 AM Sahil Harpal <sahilharpal1234@gmail.com> wrote:
Could you please try this attached patch.
Still failing.

Вложения
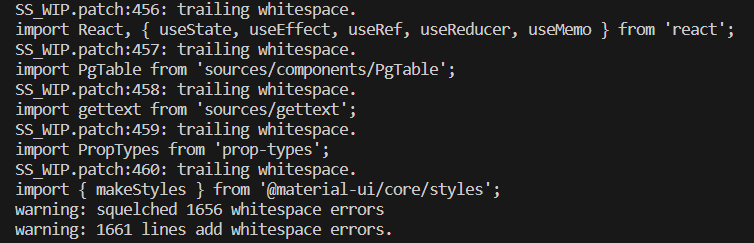
I've noticed something here. I cleared all the errors using 'yarn run bundle:dev,' except for the unused 'counterData' variable, which I'll correct soon. But when I attempted to apply this patch on a freshly cloned repository, it displayed the following warnings. However, it didn't fail, and all the files and folders were created successfully.

I removed all the whitespaces before creating the patch, and I have also checked all these lines where it is showing the trailing whitespace, but there are no trailing whitespaces. The 'yarn run bundle:dev' command also does not give any prompt for this. Could you please suggest what to do?

On Wed, 16 Aug 2023 at 11:08, Sahil Harpal <sahilharpal1234@gmail.com> wrote:
Could you please try this attached patch.
Вложения
I have pushed the recent changes to my GitHub repository.
If you are still unable to apply the patch, you can pull it from here. In the meantime, I'll check what might be wrong with this patch file.

On Wed, 16 Aug 2023 at 11:51, Sahil Harpal <sahilharpal1234@gmail.com> wrote:
I've noticed something here. I cleared all the errors using 'yarn run bundle:dev,' except for the unused 'counterData' variable, which I'll correct soon. But when I attempted to apply this patch on a freshly cloned repository, it displayed the following warnings. However, it didn't fail, and all the files and folders were created successfully.I removed all the whitespaces before creating the patch, and I have also checked all these lines where it is showing the trailing whitespace, but there are no trailing whitespaces. The 'yarn run bundle:dev' command also does not give any prompt for this. Could you please suggest what to do?On Wed, 16 Aug 2023 at 11:08, Sahil Harpal <sahilharpal1234@gmail.com> wrote:Could you please try this attached patch.

Вложения
Hi Sahil,
On Wed, Aug 16, 2023 at 3:25 PM Sahil Harpal <sahilharpal1234@gmail.com> wrote:
I have pushed the recent changes to my GitHub repository.If you are still unable to apply the patch, you can pull it from here. In the meantime, I'll check what might be wrong with this patch file.
Can you please fix the below JS error ? Due to this CPU and Memory tabs are not working.
Thanks,
Khushboo
On Wed, 16 Aug 2023 at 11:51, Sahil Harpal <sahilharpal1234@gmail.com> wrote:I've noticed something here. I cleared all the errors using 'yarn run bundle:dev,' except for the unused 'counterData' variable, which I'll correct soon. But when I attempted to apply this patch on a freshly cloned repository, it displayed the following warnings. However, it didn't fail, and all the files and folders were created successfully.I removed all the whitespaces before creating the patch, and I have also checked all these lines where it is showing the trailing whitespace, but there are no trailing whitespaces. The 'yarn run bundle:dev' command also does not give any prompt for this. Could you please suggest what to do?On Wed, 16 Aug 2023 at 11:08, Sahil Harpal <sahilharpal1234@gmail.com> wrote:Could you please try this attached patch.
Вложения

Hi Khushboo,
For me, it's working properly. I think in your case, the system is returning a null value for some of the processes. Could you please confirm this? If it is so, then either we can set a default value of 0 or simply a null string. Using console.log(), you can see what it is returning.
On Thu, 17 Aug 2023 at 10:39, Khushboo Vashi <khushboo.vashi@enterprisedb.com> wrote:
Can you please fix the below JS error ? Due to this CPU and Memory tabs are not working.
if(data.hasOwnProperty('pmu_stats')){
let pmu_info_list = [];
const pmu_info_obj = data['pmu_stats'];
console.log(pmu_info_obj); // It will print entire list in the console
for (const key in pmu_info_obj) {
pmu_info_list.push({ icon: '', pid: pmu_info_obj[key]['pid'], name: pmu_info_obj[key]['name'],
memory_usage: formatBytes(pmu_info_obj[key]['memory_usage']), memory_bytes: formatBytes(pmu_info_obj[key]['memory_bytes']) });
}
setProcessMemoryUsageStats(pmu_info_list);
}
Вложения
On Thu, Aug 17, 2023 at 11:48 AM Sahil Harpal <sahilharpal1234@gmail.com> wrote:
Hi Khushboo,On Thu, 17 Aug 2023 at 10:39, Khushboo Vashi <khushboo.vashi@enterprisedb.com> wrote:Can you please fix the below JS error ? Due to this CPU and Memory tabs are not working.For me, it's working properly. I think in your case, the system is returning a null value for some of the processes. Could you please confirm this? If it is so, then either we can set a default value of 0 or simply a null string. Using console.log(), you can see what it is returning.
Sample data of my system to fix this issue:
- process331:
- memory_bytes: null
- memory_usage: null
- name: "QuickLookUIServi"
- pid: 938
- row_number: 331
if(data.hasOwnProperty('pmu_stats')){let pmu_info_list = [];const pmu_info_obj = data['pmu_stats'];console.log(pmu_info_obj); // It will print entire list in the consolefor (const key in pmu_info_obj) {pmu_info_list.push({ icon: '', pid: pmu_info_obj[key]['pid'], name: pmu_info_obj[key]['name'],memory_usage: formatBytes(pmu_info_obj[key]['memory_usage']), memory_bytes: formatBytes(pmu_info_obj[key]['memory_bytes']) });}setProcessMemoryUsageStats(pmu_info_list);}
Вложения

On Thu, 17 Aug 2023 at 14:39, Khushboo Vashi <khushboo.vashi@enterprisedb.com> wrote:
Sample data of my system to fix this issue:
- process331:
- memory_bytes:null
- memory_usage:null
- name:"QuickLookUIServi"
- pid:938
- row_number:331
Okay, so it is an issue of null value then.
Are null values being returned for all processes or only for specific ones?
Also can you please verify it by running "SELECT * FROM pg_sys_cpu_memory_by_process();" query in the query tool? Just want to ensure I'm not making mistakes while processing the queries output.
Are null values being returned for all processes or only for specific ones?
Also can you please verify it by running "SELECT * FROM pg_sys_cpu_memory_by_process();" query in the query tool? Just want to ensure I'm not making mistakes while processing the queries output.
On Thu, Aug 17, 2023 at 2:50 PM Sahil Harpal <sahilharpal1234@gmail.com> wrote:
On Thu, 17 Aug 2023 at 14:39, Khushboo Vashi <khushboo.vashi@enterprisedb.com> wrote:Sample data of my system to fix this issue:
- process331:
- memory_bytes:null
- memory_usage:null
- name:"QuickLookUIServi"
- pid:938
- row_number:331
Okay, so it is an issue of null value then.
Are null values being returned for all processes or only for specific ones?
It returns null for some of the processes, not for all.
Also can you please verify it by running "SELECT * FROM pg_sys_cpu_memory_by_process();" query in the query tool? Just want to ensure I'm not making mistakes while processing the queries output.
On Thu, 17 Aug 2023 at 14:53, Khushboo Vashi <khushboo.vashi@enterprisedb.com> wrote:

On Thu, Aug 17, 2023 at 2:50 PM Sahil Harpal <sahilharpal1234@gmail.com> wrote:On Thu, 17 Aug 2023 at 14:39, Khushboo Vashi <khushboo.vashi@enterprisedb.com> wrote:Sample data of my system to fix this issue:
- process331:
- memory_bytes:null
- memory_usage:null
- name:"QuickLookUIServi"
- pid:938
- row_number:331
Okay, so it is an issue of null value then.
Are null values being returned for all processes or only for specific ones?It returns null for some of the processes, not for all.
Okay, great. So should we display null for those processes or 0B?
On Thu, 17 Aug 2023 at 10:36, Sahil Harpal <sahilharpal1234@gmail.com> wrote:
On Thu, 17 Aug 2023 at 14:53, Khushboo Vashi <khushboo.vashi@enterprisedb.com> wrote:On Thu, Aug 17, 2023 at 2:50 PM Sahil Harpal <sahilharpal1234@gmail.com> wrote:On Thu, 17 Aug 2023 at 14:39, Khushboo Vashi <khushboo.vashi@enterprisedb.com> wrote:Sample data of my system to fix this issue:
- process331:
- memory_bytes:null
- memory_usage:null
- name:"QuickLookUIServi"
- pid:938
- row_number:331
Okay, so it is an issue of null value then.
Are null values being returned for all processes or only for specific ones?It returns null for some of the processes, not for all.Okay, great. So should we display null for those processes or 0B?
null. We don't have any info, which is not the same as 0B.
On Thu, 17 Aug 2023 at 15:08, Dave Page <dpage@pgadmin.org> wrote:

On Thu, 17 Aug 2023 at 10:36, Sahil Harpal <sahilharpal1234@gmail.com> wrote:On Thu, 17 Aug 2023 at 14:53, Khushboo Vashi <khushboo.vashi@enterprisedb.com> wrote:On Thu, Aug 17, 2023 at 2:50 PM Sahil Harpal <sahilharpal1234@gmail.com> wrote:On Thu, 17 Aug 2023 at 14:39, Khushboo Vashi <khushboo.vashi@enterprisedb.com> wrote:Sample data of my system to fix this issue:
- process331:
- memory_bytes:null
- memory_usage:null
- name:"QuickLookUIServi"
- pid:938
- row_number:331
Okay, so it is an issue of null value then.
Are null values being returned for all processes or only for specific ones?It returns null for some of the processes, not for all.Okay, great. So should we display null for those processes or 0B?null. We don't have any info, which is not the same as 0B.
Understood. Thank you!
Вложения
Hi Khushboo,
I have made the necessary changes and pushed them to the same repository. Let me know if that resolves this null value issue.
Thank you,
Sahil

Hi Sahil,
Please find the below review comments:
- Do not use the Title case for the graph/chart’s heading. For example, CPU Usage should be CPU usage.
- If I select any database without an extension installed and then select the database with the extension, the message (Extension is not installed) remains on the page. The database change doesn’t reflect on the UI.
- CPU Usage () - What are these empty parentheses?
- Please use the same grey background shades on the entire page.
- Storage tab: If possible, please display the disk name in the heading
- The Tooltip for graph points remains on the page. Please refer to the below screenshot.
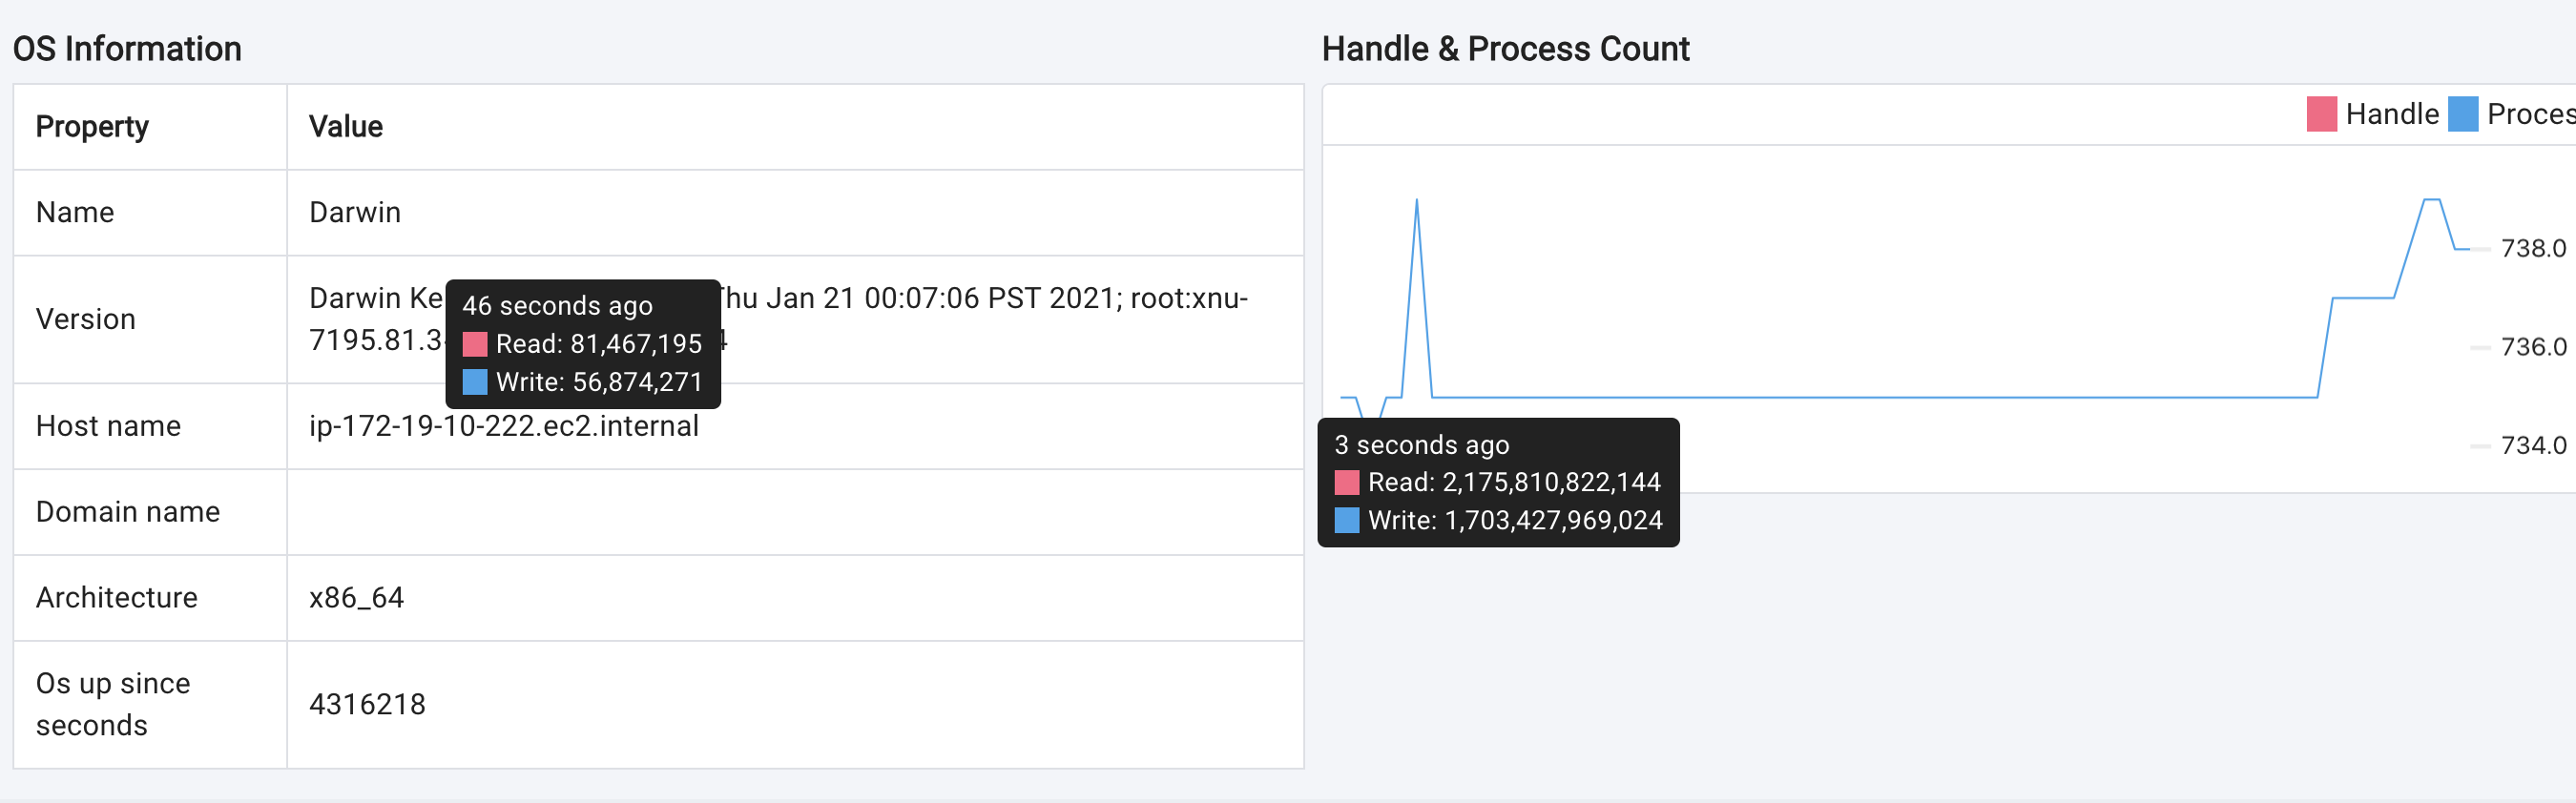
- Please use rounded corners for all the tables (same as graphs).
- Sometimes graphs start from left and then shift to right. This issue I have reported in my initial review too.
Thanks,
Khushboo
On Thu, Aug 17, 2023 at 3:43 PM Sahil Harpal <sahilharpal1234@gmail.com> wrote:
Hi Khushboo,I have made the necessary changes and pushed them to the same repository. Let me know if that resolves this null value issue.Thank you,Sahil
Вложения

On Thu, 17 Aug 2023 at 17:57, Khushboo Vashi <khushboo.vashi@enterprisedb.com> wrote:
- The Tooltip for graph points remains on the page. Please refer to the below screenshot.
For me, it's working fine if I move the cursor within the graph area, but I can also sometimes observe this glitch when I attempt to change the screen width and quickly move the cursor within the graph area.
On Thu, 17 Aug 2023 at 17:57, Khushboo Vashi <khushboo.vashi@enterprisedb.com> wrote:

- Sometimes graphs start from left and then shift to right. This issue I have reported in my initial review too.
For StreamingChart should I ignore it for now?
On Mon, 7 Aug 2023 at 17:12, Aditya Toshniwal <aditya.toshniwal@enterprisedb.com> wrote:
OK I thought you wanted the graph to go from left to right. Yeah, I have seen that glitch a few times (but rare). I think you can ignore it for now, we can look into it once we get time. It is not a priority.
Or try the solution below?
On Sun, 6 Aug 2023 at 13:21, Sahil Harpal <sahilharpal1234@gmail.com> wrote:
I've tried one more approach here. If our data array is full, this graph shifting won't happen. So, if we initialize our data list with null values, there won't be any visible shift. What do you think about this solution?
Thank you,
Sahil

On Thu, 10 Aug 2023 at 00:37, Sahil Harpal <sahilharpal1234@gmail.com> wrote:
Pending Work:
- Process information -
- Issue: The pg_sys_process_info() query takes much longer (more than 2 mins) to execute and prevents the updation of other graphs and tables.
- Disk information -
- Issue: The pg_sys_disk_info() query returns NULL value for some of the drive letters.
- StreamingChart -
- Issue: Graph shifting glitch. For the first time, graphs start from the opposite side, and after the following API call or a few seconds later, those get adjusted.
I need suggestions for labels for different tables and charts. Also, could you please clarify the use of the counterData variable, which is used for some of the charts (tps_stats, ti_stats, to_stats, and bio_stats)?
Could you please help me with these blockers and doubts?
Thank you,
Sahil
On Fri, Aug 18, 2023 at 10:08 AM Sahil Harpal <sahilharpal1234@gmail.com> wrote:
Is this happening simply by moving the cursor within the graph area or when resizing the screen?On Thu, 17 Aug 2023 at 17:57, Khushboo Vashi <khushboo.vashi@enterprisedb.com> wrote:
- The Tooltip for graph points remains on the page. Please refer to the below screenshot.
This is happening by simply moving the cursor across the graphs on each tab. Maybe you can try to reduce the graph refresh rate to 1 second and try.
For me, it's working fine if I move the cursor within the graph area, but I can also sometimes observe this glitch when I attempt to change the screen width and quickly move the cursor within the graph area.
On Sat, Aug 19, 2023 at 4:21 PM Sahil Harpal <sahilharpal1234@gmail.com> wrote:
On Thu, 10 Aug 2023 at 00:37, Sahil Harpal <sahilharpal1234@gmail.com> wrote:Pending Work:
- Process information -
- Issue: The pg_sys_process_info() query takes much longer (more than 2 mins) to execute and prevents the updation of other graphs and tables.
This may happen on Windows, can you try to fetch these details separately (not combining with other charts) only for Windows?
- Disk information -
- Issue: The pg_sys_disk_info() query returns NULL value for some of the drive letters.
If it returns NULL then do not show anything for that field for particular Disk.
- StreamingChart -
- Issue: Graph shifting glitch. For the first time, graphs start from the opposite side, and after the following API call or a few seconds later, those get adjusted.
I need suggestions for labels for different tables and charts. Also, could you please clarify the use of the counterData variable, which is used for some of the charts (tps_stats, ti_stats, to_stats, and bio_stats)?Could you please help me with these blockers and doubts?Thank you,Sahil
Sahil, once the issues get resolved, please raise the PR and we will do the final review there.
On Mon, Aug 21, 2023 at 9:59 AM Khushboo Vashi <khushboo.vashi@enterprisedb.com> wrote:
On Sat, Aug 19, 2023 at 4:21 PM Sahil Harpal <sahilharpal1234@gmail.com> wrote:On Thu, 10 Aug 2023 at 00:37, Sahil Harpal <sahilharpal1234@gmail.com> wrote:Pending Work:
- Process information -
- Issue: The pg_sys_process_info() query takes much longer (more than 2 mins) to execute and prevents the updation of other graphs and tables.
This may happen on Windows, can you try to fetch these details separately (not combining with other charts) only for Windows?
- Disk information -
- Issue: The pg_sys_disk_info() query returns NULL value for some of the drive letters.
If it returns NULL then do not show anything for that field for particular Disk.
- StreamingChart -
- Issue: Graph shifting glitch. For the first time, graphs start from the opposite side, and after the following API call or a few seconds later, those get adjusted.
I need suggestions for labels for different tables and charts. Also, could you please clarify the use of the counterData variable, which is used for some of the charts (tps_stats, ti_stats, to_stats, and bio_stats)?Could you please help me with these blockers and doubts?Thank you,Sahil
Hi Khushboo,
On Mon, 21 Aug 2023 at 09:55, Khushboo Vashi <khushboo.vashi@enterprisedb.com> wrote:

On Fri, Aug 18, 2023 at 10:08 AM Sahil Harpal <sahilharpal1234@gmail.com> wrote:Is this happening simply by moving the cursor within the graph area or when resizing the screen?On Thu, 17 Aug 2023 at 17:57, Khushboo Vashi <khushboo.vashi@enterprisedb.com> wrote:
- The Tooltip for graph points remains on the page. Please refer to the below screenshot.
This is happening by simply moving the cursor across the graphs on each tab. Maybe you can try to reduce the graph refresh rate to 1 second and try.
I'm unable to reproduce the issue even after modifying the refresh rate to 1 second. I have attached a screen recording to illustrate how it is functioning on my end.
Do you have any thoughts on why the cursor issue might be happening?
Hello Khushboo,
Thank you for sharing this with me. As you can see, towards the end, when you encountered the tooltip issue, the size of the graph container was changing. I even found this bug in the actual pgAdmin4 application installed on my system. Please see the attached video.
Here's what I believe is happening: When the container's size changes, it seems that tooltips continue to accumulate without being properly removed.
The method we use to display tooltips involves inserting a new element into the DOM with the class name "uplot-tooltip". So, if we remove all the existing tooltip elements before inserting a new one, it could potentially resolve the issue. Would like to know your thoughts on this.
Thank you,
Sahil

On Mon, 21 Aug 2023 at 11:11, Khushboo Vashi <khushboo.vashi@enterprisedb.com> wrote:
See the attachment.On Mon, Aug 21, 2023 at 10:51 AM Sahil Harpal <sahilharpal1234@gmail.com> wrote:Hi Khushboo,On Mon, 21 Aug 2023 at 09:55, Khushboo Vashi <khushboo.vashi@enterprisedb.com> wrote:On Fri, Aug 18, 2023 at 10:08 AM Sahil Harpal <sahilharpal1234@gmail.com> wrote:Is this happening simply by moving the cursor within the graph area or when resizing the screen?On Thu, 17 Aug 2023 at 17:57, Khushboo Vashi <khushboo.vashi@enterprisedb.com> wrote:
- The Tooltip for graph points remains on the page. Please refer to the below screenshot.
This is happening by simply moving the cursor across the graphs on each tab. Maybe you can try to reduce the graph refresh rate to 1 second and try.I'm unable to reproduce the issue even after modifying the refresh rate to 1 second. I have attached a screen recording to illustrate how it is functioning on my end.Do you have any thoughts on why the cursor issue might be happening?
Вложения
Hi Sahil,
On Tue, Aug 22, 2023 at 1:19 PM Sahil Harpal <sahilharpal1234@gmail.com> wrote:
Hello Khushboo,
Thank you for sharing this with me. As you can see, towards the end, when you encountered the tooltip issue, the size of the graph container was changing. I even found this bug in the actual pgAdmin4 application installed on my system. Please see the attached video.
Here's what I believe is happening: When the container's size changes, it seems that tooltips continue to accumulate without being properly removed.
The method we use to display tooltips involves inserting a new element into the DOM with the class name "uplot-tooltip". So, if we remove all the existing tooltip elements before inserting a new one, it could potentially resolve the issue. Would like to know your thoughts on this.
It would be good if you fix this issue as you already investigated and found the root cause. But if you have other things to complete as the deadline is approaching you can create this issue at pgAdmin repo as it is an existing one.
Thanks,
Khushboo
Thank you,SahilOn Mon, 21 Aug 2023 at 11:11, Khushboo Vashi <khushboo.vashi@enterprisedb.com> wrote:See the attachment.On Mon, Aug 21, 2023 at 10:51 AM Sahil Harpal <sahilharpal1234@gmail.com> wrote:Hi Khushboo,On Mon, 21 Aug 2023 at 09:55, Khushboo Vashi <khushboo.vashi@enterprisedb.com> wrote:On Fri, Aug 18, 2023 at 10:08 AM Sahil Harpal <sahilharpal1234@gmail.com> wrote:Is this happening simply by moving the cursor within the graph area or when resizing the screen?On Thu, 17 Aug 2023 at 17:57, Khushboo Vashi <khushboo.vashi@enterprisedb.com> wrote:
- The Tooltip for graph points remains on the page. Please refer to the below screenshot.
This is happening by simply moving the cursor across the graphs on each tab. Maybe you can try to reduce the graph refresh rate to 1 second and try.I'm unable to reproduce the issue even after modifying the refresh rate to 1 second. I have attached a screen recording to illustrate how it is functioning on my end.Do you have any thoughts on why the cursor issue might be happening?
On Tue, 22 Aug 2023 at 16:02, Khushboo Vashi <khushboo.vashi@enterprisedb.com> wrote:

Hi Sahil,On Tue, Aug 22, 2023 at 1:19 PM Sahil Harpal <sahilharpal1234@gmail.com> wrote:Hello Khushboo,
Thank you for sharing this with me. As you can see, towards the end, when you encountered the tooltip issue, the size of the graph container was changing. I even found this bug in the actual pgAdmin4 application installed on my system. Please see the attached video.
Here's what I believe is happening: When the container's size changes, it seems that tooltips continue to accumulate without being properly removed.
The method we use to display tooltips involves inserting a new element into the DOM with the class name "uplot-tooltip". So, if we remove all the existing tooltip elements before inserting a new one, it could potentially resolve the issue. Would like to know your thoughts on this.It would be good if you fix this issue as you already investigated and found the root cause. But if you have other things to complete as the deadline is approaching you can create this issue at pgAdmin repo as it is an existing one.
Sure, I'll try to fix this.
On Mon, 21 Aug 2023 at 09:59, Khushboo Vashi <khushboo.vashi@enterprisedb.com> wrote:

On Sat, Aug 19, 2023 at 4:21 PM Sahil Harpal <sahilharpal1234@gmail.com> wrote:On Thu, 10 Aug 2023 at 00:37, Sahil Harpal <sahilharpal1234@gmail.com> wrote:Pending Work:
- Process information -
- Issue: The pg_sys_process_info() query takes much longer (more than 2 mins) to execute and prevents the updation of other graphs and tables.
This may happen on Windows, can you try to fetch these details separately (not combining with other charts) only for Windows?
I tried this, but it didn't work. I even created a separate endpoint to fetch the data; however, it's still not working as expected. I believe it's more of a server-side problem. I'm not entirely certain, but I think we're executing the queries sequentially (Single threaded). This could be preventing the updating of other graphs and tables.
Since the deadline is approaching, I'll first try to resolve other issues and after that I'll look into this.
- Disk information -
- Issue: The pg_sys_disk_info() query returns NULL value for some of the drive letters.
If it returns NULL then do not show anything for that field for particular Disk.
For disk statistics, we have decided to use pie and bar charts, and we need drive letters for labeling. I just observed that the query is now returning drive letters for both SSD and HDD partitions, which were failing earlier. Maybe it was my system's fault. However, there are still some entries for which the drive letter is missing.

But as @Dave Page suggested:
On Mon, 24 Jul 2023 at 15:34, Dave Page <dpage@pgadmin.org> wrote:
On your system, what are the volumes without letters etc? If they're things like swap/pagefile, recovery partition etc, then they can probably be omitted (e.g. SELECT ... WHERE mount_point IS NOT NULL OR drive_letter IS NOT NULL).
Can I omit the rows with null values?
Вложения
Also. what should I use for labeling: mount_point or drive_letter? It's possible that the query might not return either of these values on some systems.
For instance, in my case, it's returning values for drive_letter but null for mount_point. However, in the example provided (here), it's returning paths for mount_point and null for drive_letter.

On Tue, 22 Aug 2023 at 23:34, Sahil Harpal <sahilharpal1234@gmail.com> wrote:
On Mon, 21 Aug 2023 at 09:59, Khushboo Vashi <khushboo.vashi@enterprisedb.com> wrote:On Sat, Aug 19, 2023 at 4:21 PM Sahil Harpal <sahilharpal1234@gmail.com> wrote:On Thu, 10 Aug 2023 at 00:37, Sahil Harpal <sahilharpal1234@gmail.com> wrote:Pending Work:
- Process information -
- Issue: The pg_sys_process_info() query takes much longer (more than 2 mins) to execute and prevents the updation of other graphs and tables.
This may happen on Windows, can you try to fetch these details separately (not combining with other charts) only for Windows?I tried this, but it didn't work. I even created a separate endpoint to fetch the data; however, it's still not working as expected. I believe it's more of a server-side problem. I'm not entirely certain, but I think we're executing the queries sequentially (Single threaded). This could be preventing the updating of other graphs and tables.Since the deadline is approaching, I'll first try to resolve other issues and after that I'll look into this.
- Disk information -
- Issue: The pg_sys_disk_info() query returns NULL value for some of the drive letters.
If it returns NULL then do not show anything for that field for particular Disk.For disk statistics, we have decided to use pie and bar charts, and we need drive letters for labeling. I just observed that the query is now returning drive letters for both SSD and HDD partitions, which were failing earlier. Maybe it was my system's fault. However, there are still some entries for which the drive letter is missing.But as @Dave Page suggested:On Mon, 24 Jul 2023 at 15:34, Dave Page <dpage@pgadmin.org> wrote:On your system, what are the volumes without letters etc? If they're things like swap/pagefile, recovery partition etc, then they can probably be omitted (e.g. SELECT ... WHERE mount_point IS NOT NULL OR drive_letter IS NOT NULL).Can I omit the rows with null values?

Вложения
On Tue, Aug 22, 2023 at 11:35 PM Sahil Harpal <sahilharpal1234@gmail.com> wrote:
On Mon, 21 Aug 2023 at 09:59, Khushboo Vashi <khushboo.vashi@enterprisedb.com> wrote:On Sat, Aug 19, 2023 at 4:21 PM Sahil Harpal <sahilharpal1234@gmail.com> wrote:On Thu, 10 Aug 2023 at 00:37, Sahil Harpal <sahilharpal1234@gmail.com> wrote:Pending Work:
- Process information -
- Issue: The pg_sys_process_info() query takes much longer (more than 2 mins) to execute and prevents the updation of other graphs and tables.
This may happen on Windows, can you try to fetch these details separately (not combining with other charts) only for Windows?I tried this, but it didn't work. I even created a separate endpoint to fetch the data; however, it's still not working as expected. I believe it's more of a server-side problem. I'm not entirely certain, but I think we're executing the queries sequentially (Single threaded). This could be preventing the updating of other graphs and tables.Since the deadline is approaching, I'll first try to resolve other issues and after that I'll look into this.
- Disk information -
- Issue: The pg_sys_disk_info() query returns NULL value for some of the drive letters.
If it returns NULL then do not show anything for that field for particular Disk.For disk statistics, we have decided to use pie and bar charts, and we need drive letters for labeling. I just observed that the query is now returning drive letters for both SSD and HDD partitions, which were failing earlier. Maybe it was my system's fault. However, there are still some entries for which the drive letter is missing.

But as @Dave Page suggested:On Mon, 24 Jul 2023 at 15:34, Dave Page <dpage@pgadmin.org> wrote:On your system, what are the volumes without letters etc? If they're things like swap/pagefile, recovery partition etc, then they can probably be omitted (e.g. SELECT ... WHERE mount_point IS NOT NULL OR drive_letter IS NOT NULL).Can I omit the rows with null values?
Yes.
Вложения
On Wed, Aug 23, 2023 at 12:44 AM Sahil Harpal <sahilharpal1234@gmail.com> wrote:
Also. what should I use for labeling: mount_point or drive_letter? It's possible that the query might not return either of these values on some systems.For instance, in my case, it's returning values for drive_letter but null for mount_point. However, in the example provided (here), it's returning paths for mount_point and null for drive_letter.
Give first priority to Mount Point then drive letters (in most of the case either of them will have value) and ignore if both are null.
On Tue, 22 Aug 2023 at 23:34, Sahil Harpal <sahilharpal1234@gmail.com> wrote:On Mon, 21 Aug 2023 at 09:59, Khushboo Vashi <khushboo.vashi@enterprisedb.com> wrote:On Sat, Aug 19, 2023 at 4:21 PM Sahil Harpal <sahilharpal1234@gmail.com> wrote:On Thu, 10 Aug 2023 at 00:37, Sahil Harpal <sahilharpal1234@gmail.com> wrote:Pending Work:
- Process information -
- Issue: The pg_sys_process_info() query takes much longer (more than 2 mins) to execute and prevents the updation of other graphs and tables.
This may happen on Windows, can you try to fetch these details separately (not combining with other charts) only for Windows?I tried this, but it didn't work. I even created a separate endpoint to fetch the data; however, it's still not working as expected. I believe it's more of a server-side problem. I'm not entirely certain, but I think we're executing the queries sequentially (Single threaded). This could be preventing the updating of other graphs and tables.Since the deadline is approaching, I'll first try to resolve other issues and after that I'll look into this.
- Disk information -
- Issue: The pg_sys_disk_info() query returns NULL value for some of the drive letters.
If it returns NULL then do not show anything for that field for particular Disk.For disk statistics, we have decided to use pie and bar charts, and we need drive letters for labeling. I just observed that the query is now returning drive letters for both SSD and HDD partitions, which were failing earlier. Maybe it was my system's fault. However, there are still some entries for which the drive letter is missing.But as @Dave Page suggested:On Mon, 24 Jul 2023 at 15:34, Dave Page <dpage@pgadmin.org> wrote:On your system, what are the volumes without letters etc? If they're things like swap/pagefile, recovery partition etc, then they can probably be omitted (e.g. SELECT ... WHERE mount_point IS NOT NULL OR drive_letter IS NOT NULL).Can I omit the rows with null values?
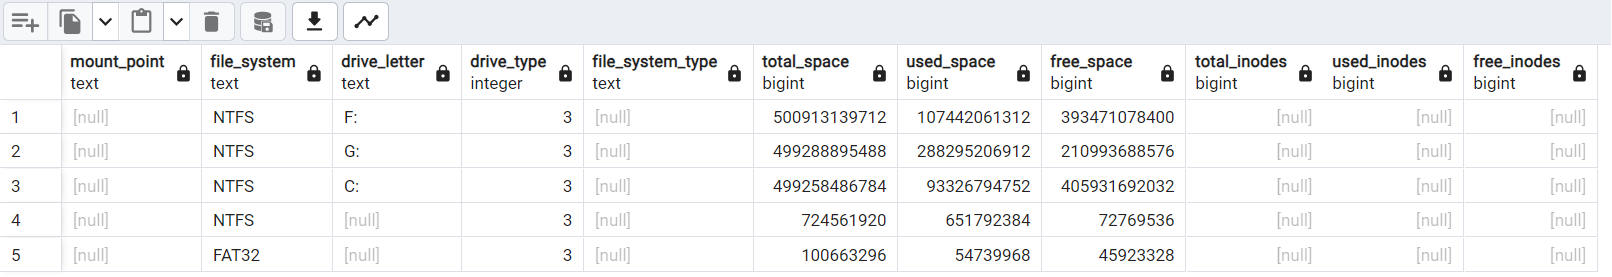
Вложения
Hi,
Can we include total space stats (left pie chart) in the same bar chart? or would it be better if we keep it separate?

Вложения
On Sat, 19 Aug 2023 at 16:20, Sahil Harpal <sahilharpal1234@gmail.com> wrote:

On Thu, 17 Aug 2023 at 17:57, Khushboo Vashi <khushboo.vashi@enterprisedb.com> wrote:
- Sometimes graphs start from left and then shift to right. This issue I have reported in my initial review too.
For StreamingChart should I ignore it for now?On Mon, 7 Aug 2023 at 17:12, Aditya Toshniwal <aditya.toshniwal@enterprisedb.com> wrote:OK I thought you wanted the graph to go from left to right. Yeah, I have seen that glitch a few times (but rare). I think you can ignore it for now, we can look into it once we get time. It is not a priority.Or try the solution below?On Sun, 6 Aug 2023 at 13:21, Sahil Harpal <sahilharpal1234@gmail.com> wrote:I've tried one more approach here. If our data array is full, this graph shifting won't happen. So, if we initialize our data list with null values, there won't be any visible shift. What do you think about this solution?
Can you please help me with this?
Hi Sahil,
On Thu, Aug 24, 2023 at 8:07 PM Sahil Harpal <sahilharpal1234@gmail.com> wrote:
Hi,Can we include total space stats (left pie chart) in the same bar chart? or would it be better if we keep it separate?

How do you propose to merge both? I would also suggest using a stacked bar chart on the right. And format from bytes to MBs.
Thanks,
Aditya Toshniwal
"Don't Complain about Heat, Plant a TREE"
Вложения
Hi Sahil,
On Thu, Aug 24, 2023 at 8:28 PM Sahil Harpal <sahilharpal1234@gmail.com> wrote:
On Sat, 19 Aug 2023 at 16:20, Sahil Harpal <sahilharpal1234@gmail.com> wrote:On Thu, 17 Aug 2023 at 17:57, Khushboo Vashi <khushboo.vashi@enterprisedb.com> wrote:
- Sometimes graphs start from left and then shift to right. This issue I have reported in my initial review too.
For StreamingChart should I ignore it for now?On Mon, 7 Aug 2023 at 17:12, Aditya Toshniwal <aditya.toshniwal@enterprisedb.com> wrote:OK I thought you wanted the graph to go from left to right. Yeah, I have seen that glitch a few times (but rare). I think you can ignore it for now, we can look into it once we get time. It is not a priority.Or try the solution below?On Sun, 6 Aug 2023 at 13:21, Sahil Harpal <sahilharpal1234@gmail.com> wrote:I've tried one more approach here. If our data array is full, this graph shifting won't happen. So, if we initialize our data list with null values, there won't be any visible shift. What do you think about this solution?Can you please help me with this?
Let me apply your patch and try once.
Thanks,
Aditya Toshniwal
"Don't Complain about Heat, Plant a TREE"
Hi Sahil,
On Fri, Aug 25, 2023 at 11:30 AM Aditya Toshniwal <aditya.toshniwal@enterprisedb.com> wrote:
Hi Sahil,On Thu, Aug 24, 2023 at 8:28 PM Sahil Harpal <sahilharpal1234@gmail.com> wrote:On Sat, 19 Aug 2023 at 16:20, Sahil Harpal <sahilharpal1234@gmail.com> wrote:On Thu, 17 Aug 2023 at 17:57, Khushboo Vashi <khushboo.vashi@enterprisedb.com> wrote:
- Sometimes graphs start from left and then shift to right. This issue I have reported in my initial review too.
For StreamingChart should I ignore it for now?On Mon, 7 Aug 2023 at 17:12, Aditya Toshniwal <aditya.toshniwal@enterprisedb.com> wrote:OK I thought you wanted the graph to go from left to right. Yeah, I have seen that glitch a few times (but rare). I think you can ignore it for now, we can look into it once we get time. It is not a priority.Or try the solution below?On Sun, 6 Aug 2023 at 13:21, Sahil Harpal <sahilharpal1234@gmail.com> wrote:I've tried one more approach here. If our data array is full, this graph shifting won't happen. So, if we initialize our data list with null values, there won't be any visible shift. What do you think about this solution?Can you please help me with this?Let me apply your patch and try once.
Can you please share the rebased patch?
--Thanks,Aditya Toshniwal"Don't Complain about Heat, Plant a TREE"
Thanks,
Aditya Toshniwal
"Don't Complain about Heat, Plant a TREE"

Hi Sahil,On Thu, Aug 24, 2023 at 8:07 PM Sahil Harpal <sahilharpal1234@gmail.com> wrote:Hi,Can we include total space stats (left pie chart) in the same bar chart? or would it be better if we keep it separate?How do you propose to merge both? I would also suggest using a stacked bar chart on the right. And format from bytes to MBs.

Currently, I have implemented like this:

So, I was thinking of adding one more column for total space for each disk.
Regarding the stacked bar chart, we will need to increase the height of the default chart container; otherwise, the proportion of different categories won't be clearly visible in some cases.
And I believe that if we use a stacked bar chart, there won't be a need to provide total space details, as the height of that stacked bar will be nothing but the total space, right?
Вложения
Hi Sahil,
On Fri, Aug 25, 2023 at 12:02 PM Sahil Harpal <sahilharpal1234@gmail.com> wrote:
Hi Sahil,On Thu, Aug 24, 2023 at 8:07 PM Sahil Harpal <sahilharpal1234@gmail.com> wrote:Hi,Can we include total space stats (left pie chart) in the same bar chart? or would it be better if we keep it separate?How do you propose to merge both? I would also suggest using a stacked bar chart on the right. And format from bytes to MBs.Currently, I have implemented like this:So, I was thinking of adding one more column for total space for each disk.Regarding the stacked bar chart, we will need to increase the height of the default chart container; otherwise, the proportion of different categories won't be clearly visible in some cases.And I believe that if we use a stacked bar chart, there won't be a need to provide total space details, as the height of that stacked bar will be nothing but the total space, right?


I don't think we'll need to increase the height though. Even if you use stacks, they will show total for each drive and not total available space.
Thanks,
Aditya Toshniwal
"Don't Complain about Heat, Plant a TREE"
Вложения
Hi Aditya,
On Fri, 25 Aug 2023 at 12:06, Aditya Toshniwal <aditya.toshniwal@enterprisedb.com> wrote:

Hi Sahil,On Fri, Aug 25, 2023 at 12:02 PM Sahil Harpal <sahilharpal1234@gmail.com> wrote:Hi Sahil,On Thu, Aug 24, 2023 at 8:07 PM Sahil Harpal <sahilharpal1234@gmail.com> wrote:Hi,Can we include total space stats (left pie chart) in the same bar chart? or would it be better if we keep it separate?How do you propose to merge both? I would also suggest using a stacked bar chart on the right. And format from bytes to MBs.Currently, I have implemented like this:So, I was thinking of adding one more column for total space for each disk.Regarding the stacked bar chart, we will need to increase the height of the default chart container; otherwise, the proportion of different categories won't be clearly visible in some cases.And I believe that if we use a stacked bar chart, there won't be a need to provide total space details, as the height of that stacked bar will be nothing but the total space, right?I don't think we'll need to increase the height though. Even if you use stacks, they will show total for each drive and not total available space.

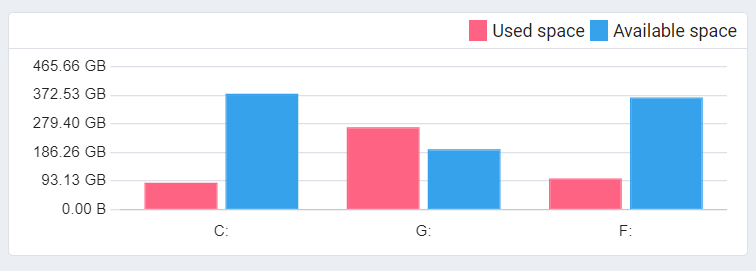
Ahh yes, users won't be able to see the absolute total value. So should I change it to a stacked bar with 3 categories then?
Вложения
On Fri, Aug 25, 2023 at 12:15 PM Sahil Harpal <sahilharpal1234@gmail.com> wrote:
Hi Aditya,On Fri, 25 Aug 2023 at 12:06, Aditya Toshniwal <aditya.toshniwal@enterprisedb.com> wrote:Hi Sahil,On Fri, Aug 25, 2023 at 12:02 PM Sahil Harpal <sahilharpal1234@gmail.com> wrote:Hi Sahil,On Thu, Aug 24, 2023 at 8:07 PM Sahil Harpal <sahilharpal1234@gmail.com> wrote:Hi,Can we include total space stats (left pie chart) in the same bar chart? or would it be better if we keep it separate?How do you propose to merge both? I would also suggest using a stacked bar chart on the right. And format from bytes to MBs.Currently, I have implemented like this:So, I was thinking of adding one more column for total space for each disk.Regarding the stacked bar chart, we will need to increase the height of the default chart container; otherwise, the proportion of different categories won't be clearly visible in some cases.And I believe that if we use a stacked bar chart, there won't be a need to provide total space details, as the height of that stacked bar will be nothing but the total space, right?I don't think we'll need to increase the height though. Even if you use stacks, they will show total for each drive and not total available space.Ahh yes, users won't be able to see the absolute total value. So should I change it to a stacked bar with 3 categories then?


I would suggest keeping the pie chart and making the stacks of used and unused. If possible please keep the pie chart colors different from bar chart.
Thanks,
Aditya Toshniwal
"Don't Complain about Heat, Plant a TREE"
Вложения
Hi Aditya,
On Fri, 25 Aug 2023 at 12:32, Aditya Toshniwal <aditya.toshniwal@enterprisedb.com> wrote:

On Fri, Aug 25, 2023 at 12:15 PM Sahil Harpal <sahilharpal1234@gmail.com> wrote:Hi Aditya,On Fri, 25 Aug 2023 at 12:06, Aditya Toshniwal <aditya.toshniwal@enterprisedb.com> wrote:Hi Sahil,On Fri, Aug 25, 2023 at 12:02 PM Sahil Harpal <sahilharpal1234@gmail.com> wrote:Hi Sahil,On Thu, Aug 24, 2023 at 8:07 PM Sahil Harpal <sahilharpal1234@gmail.com> wrote:Hi,Can we include total space stats (left pie chart) in the same bar chart? or would it be better if we keep it separate?How do you propose to merge both? I would also suggest using a stacked bar chart on the right. And format from bytes to MBs.Currently, I have implemented like this:So, I was thinking of adding one more column for total space for each disk.Regarding the stacked bar chart, we will need to increase the height of the default chart container; otherwise, the proportion of different categories won't be clearly visible in some cases.And I believe that if we use a stacked bar chart, there won't be a need to provide total space details, as the height of that stacked bar will be nothing but the total space, right?I don't think we'll need to increase the height though. Even if you use stacks, they will show total for each drive and not total available space.Ahh yes, users won't be able to see the absolute total value. So should I change it to a stacked bar with 3 categories then?I would suggest keeping the pie chart and making the stacks of used and unused. If possible please keep the pie chart colors different from bar chart.
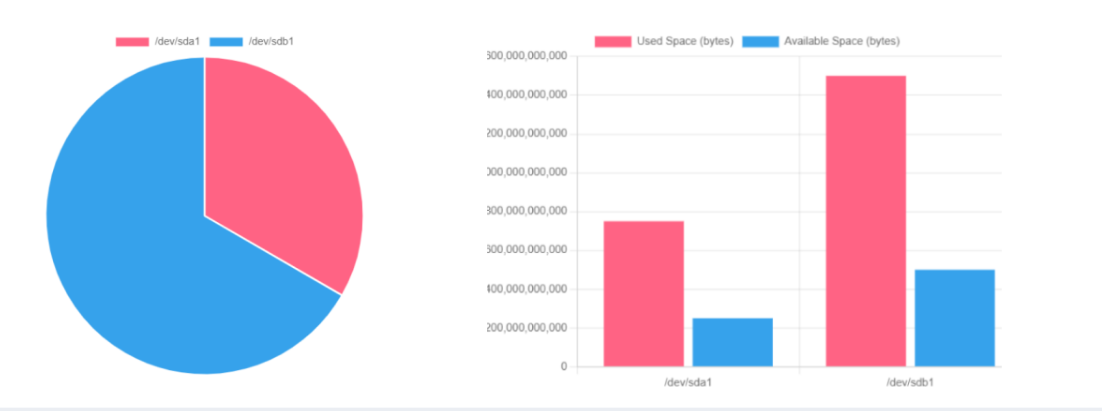

Ok, sure I'll do it.
On Fri, 25 Aug 2023 at 11:56, Aditya Toshniwal <aditya.toshniwal@enterprisedb.com> wrote:
Hi Sahil,Can you please share the rebased patch?
Please find the attached patch with recent changes. It doesn't include this stacked bar, but it contains things suggested in the second review, and I also tried to resolve the tooltip issue. Let me know if it's working correctly.
I have also pushed these changes here: https://github.com/Sahil1479/pgadmin4/tree/system_stats [Branch: system_stats]
I will share the final patch with a detailed summary of all the things that have been changed once I complete this stacked/pie chart and a few more refinements.
Thank you,
Sahil
Вложения
I have added the idea of array initialization for the 'Process & handle count' chart. Let me know if similar can be used for all the streaming charts to resolve the graph shifting issue.

On Fri, 25 Aug 2023 at 13:34, Sahil Harpal <sahilharpal1234@gmail.com> wrote:
Hi Aditya,On Fri, 25 Aug 2023 at 12:32, Aditya Toshniwal <aditya.toshniwal@enterprisedb.com> wrote:On Fri, Aug 25, 2023 at 12:15 PM Sahil Harpal <sahilharpal1234@gmail.com> wrote:Hi Aditya,On Fri, 25 Aug 2023 at 12:06, Aditya Toshniwal <aditya.toshniwal@enterprisedb.com> wrote:Hi Sahil,On Fri, Aug 25, 2023 at 12:02 PM Sahil Harpal <sahilharpal1234@gmail.com> wrote:Hi Sahil,On Thu, Aug 24, 2023 at 8:07 PM Sahil Harpal <sahilharpal1234@gmail.com> wrote:Hi,Can we include total space stats (left pie chart) in the same bar chart? or would it be better if we keep it separate?How do you propose to merge both? I would also suggest using a stacked bar chart on the right. And format from bytes to MBs.Currently, I have implemented like this:So, I was thinking of adding one more column for total space for each disk.Regarding the stacked bar chart, we will need to increase the height of the default chart container; otherwise, the proportion of different categories won't be clearly visible in some cases.And I believe that if we use a stacked bar chart, there won't be a need to provide total space details, as the height of that stacked bar will be nothing but the total space, right?I don't think we'll need to increase the height though. Even if you use stacks, they will show total for each drive and not total available space.Ahh yes, users won't be able to see the absolute total value. So should I change it to a stacked bar with 3 categories then?I would suggest keeping the pie chart and making the stacks of used and unused. If possible please keep the pie chart colors different from bar chart.Ok, sure I'll do it.On Fri, 25 Aug 2023 at 11:56, Aditya Toshniwal <aditya.toshniwal@enterprisedb.com> wrote:Hi Sahil,Can you please share the rebased patch?Please find the attached patch with recent changes. It doesn't include this stacked bar, but it contains things suggested in the second review, and I also tried to resolve the tooltip issue. Let me know if it's working correctly.I have also pushed these changes here: https://github.com/Sahil1479/pgadmin4/tree/system_stats [Branch: system_stats]I will share the final patch with a detailed summary of all the things that have been changed once I complete this stacked/pie chart and a few more refinements.Thank you,Sahil


Вложения

Hi Khushboo,
On Mon, 21 Aug 2023 at 10:03, Khushboo Vashi <khushboo.vashi@enterprisedb.com> wrote:
Sahil, once the issues get resolved, please raise the PR and we will do the final review there.
Could you please tell me to which branch I should raise the PR?
Also, should I remove the code responsible for the static DonutChart of process information?
Thank you,
Sahil
On Sat, 26 Aug 2023, 11:36 Sahil Harpal, <sahilharpal1234@gmail.com> wrote:
Hi Khushboo,On Mon, 21 Aug 2023 at 10:03, Khushboo Vashi <khushboo.vashi@enterprisedb.com> wrote:Sahil, once the issues get resolved, please raise the PR and we will do the final review there.Could you please tell me to which branch I should raise the PR?
Master branch
Also, should I remove the code responsible for the static DonutChart of process information?Thank you,Sahil
Hello everyone,
I have raised the PR.
I would like to request you all to review the changes and provide your valuable feedback. Your insights and suggestions would be invaluable in ensuring the quality and accuracy of the codebase.
Thank you,
Sahil

On Sun, 27 Aug 2023 at 07:13, Khushboo Vashi <khushboo.vashi@enterprisedb.com> wrote:
On Sat, 26 Aug 2023, 11:36 Sahil Harpal, <sahilharpal1234@gmail.com> wrote:Hi Khushboo,On Mon, 21 Aug 2023 at 10:03, Khushboo Vashi <khushboo.vashi@enterprisedb.com> wrote:Sahil, once the issues get resolved, please raise the PR and we will do the final review there.Could you please tell me to which branch I should raise the PR?Master branchAlso, should I remove the code responsible for the static DonutChart of process information?Thank you,Sahil
Hi Sahil,
I have few observations. You have added separate titles for graphs and other tabular data. This is inconsistent with existing UI.
For example,

like here:


like here:


The dashboard goes blank when I change refresh rates.

And regarding filling with nulls to fix the reversing issue of graph - you can do it in StreamingChart itself when setting initialState var, as it is StreamingChart's responsibility to do it.
Next review will be on the PR directly.
On Sun, Aug 27, 2023 at 5:58 PM Sahil Harpal <sahilharpal1234@gmail.com> wrote:
Hello everyone,I have raised the PR.I would like to request you all to review the changes and provide your valuable feedback. Your insights and suggestions would be invaluable in ensuring the quality and accuracy of the codebase.Thank you,SahilOn Sun, 27 Aug 2023 at 07:13, Khushboo Vashi <khushboo.vashi@enterprisedb.com> wrote:On Sat, 26 Aug 2023, 11:36 Sahil Harpal, <sahilharpal1234@gmail.com> wrote:Hi Khushboo,On Mon, 21 Aug 2023 at 10:03, Khushboo Vashi <khushboo.vashi@enterprisedb.com> wrote:Sahil, once the issues get resolved, please raise the PR and we will do the final review there.Could you please tell me to which branch I should raise the PR?Master branchAlso, should I remove the code responsible for the static DonutChart of process information?Thank you,Sahil
Thanks,
Aditya Toshniwal
"Don't Complain about Heat, Plant a TREE"
Вложения

Hi Aditya,
Thank you,
I have made all these changes except the StreamingChart issue. I tried filling an array with null values inside the StreamingChart component while initializing initialState but still the issue is not resolved.
I have made following changes:
const initialState = [
Array.from(new Array(xRange).keys()),
...(data.datasets?.map((d)=>{
let nullValues = new Array(xRange - d.data.length).fill(null);
let ret = [...nullValues, ...d.data];
ret.reverse();
return ret;
})??{}),
];
It works fine if we initialize the data array with the null values but I'm not getting why this is not working.
Sahil
| | Sender notified by Mailtrack | 31/08/23, 16:14:27 |
On Mon, 28 Aug 2023 at 10:44, Aditya Toshniwal <aditya.toshniwal@enterprisedb.com> wrote:
Hi Sahil,I have few observations. You have added separate titles for graphs and other tabular data. This is inconsistent with existing UI.For example,like here:like here:The dashboard goes blank when I change refresh rates.And regarding filling with nulls to fix the reversing issue of graph - you can do it in StreamingChart itself when setting initialState var, as it is StreamingChart's responsibility to do it.Next review will be on the PR directly.On Sun, Aug 27, 2023 at 5:58 PM Sahil Harpal <sahilharpal1234@gmail.com> wrote:Hello everyone,I have raised the PR.I would like to request you all to review the changes and provide your valuable feedback. Your insights and suggestions would be invaluable in ensuring the quality and accuracy of the codebase.Thank you,SahilOn Sun, 27 Aug 2023 at 07:13, Khushboo Vashi <khushboo.vashi@enterprisedb.com> wrote:On Sat, 26 Aug 2023, 11:36 Sahil Harpal, <sahilharpal1234@gmail.com> wrote:Hi Khushboo,On Mon, 21 Aug 2023 at 10:03, Khushboo Vashi <khushboo.vashi@enterprisedb.com> wrote:Sahil, once the issues get resolved, please raise the PR and we will do the final review there.Could you please tell me to which branch I should raise the PR?Master branchAlso, should I remove the code responsible for the static DonutChart of process information?Thank you,Sahil--Thanks,Aditya Toshniwal"Don't Complain about Heat, Plant a TREE"


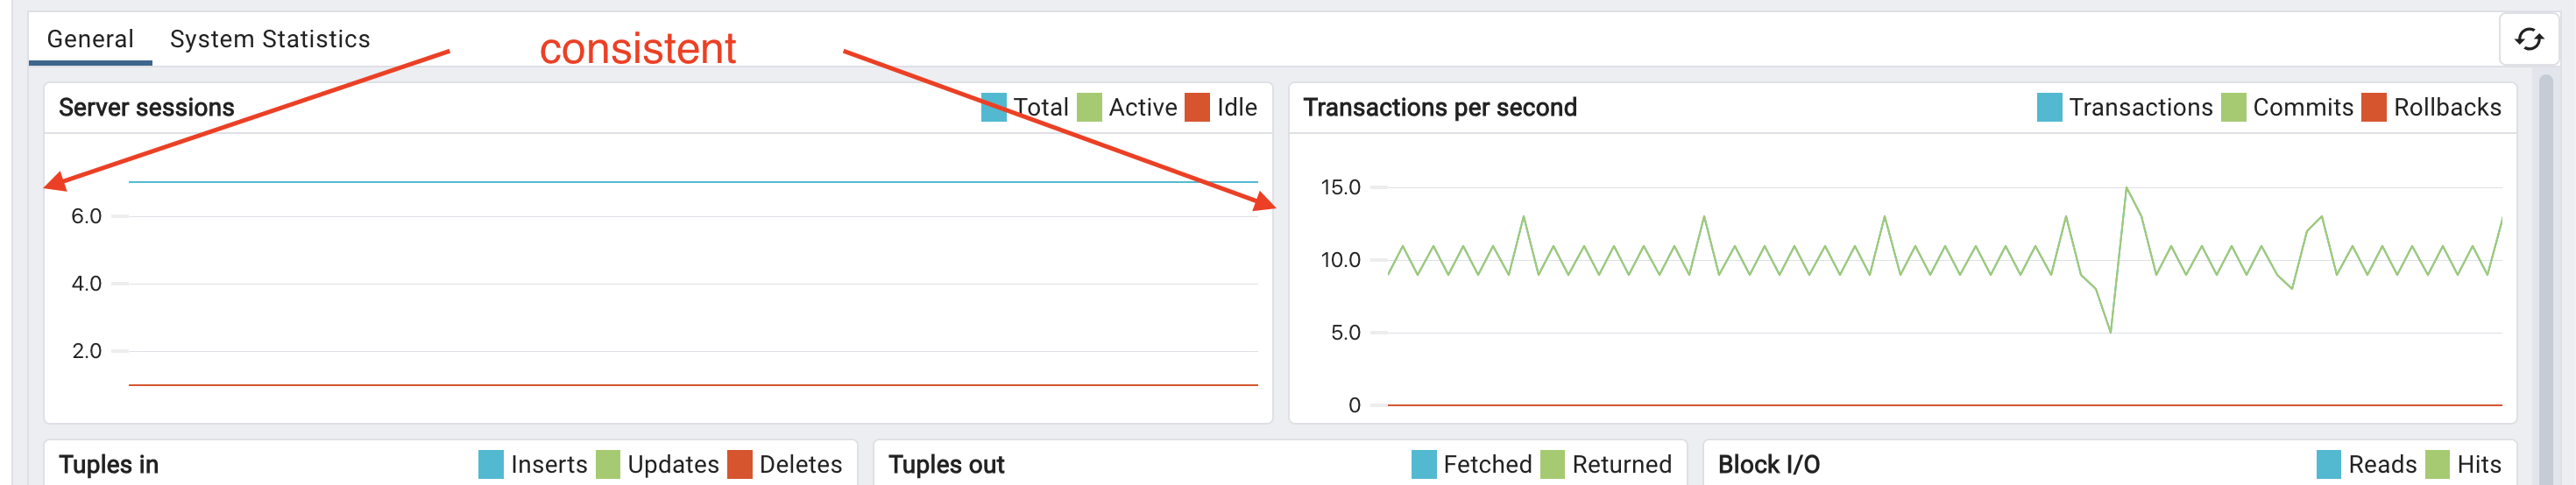

Вложения
Hi Sahil,
OK fine. We will check it later. Not priority. Please also fix the review raised on PR.
On Thu, Aug 31, 2023, 16:17 Sahil Harpal <sahilharpal1234@gmail.com> wrote:
Hi Aditya,I have made all these changes except the StreamingChart issue. I tried filling an array with null values inside the StreamingChart component while initializing initialState but still the issue is not resolved.I have made following changes:const initialState = [
Array.from(new Array(xRange).keys()),
...(data.datasets?.map((d)=>{
let nullValues = new Array(xRange - d.data.length).fill(null);
let ret = [...nullValues, ...d.data];
ret.reverse();
return ret;
})??{}),
];It works fine if we initialize the data array with the null values but I'm not getting why this is not working.Thank you,Sahil
Sender notified by
Mailtrack31/08/23, 16:14:27 On Mon, 28 Aug 2023 at 10:44, Aditya Toshniwal <aditya.toshniwal@enterprisedb.com> wrote:Hi Sahil,I have few observations. You have added separate titles for graphs and other tabular data. This is inconsistent with existing UI.For example,like here:like here:The dashboard goes blank when I change refresh rates.And regarding filling with nulls to fix the reversing issue of graph - you can do it in StreamingChart itself when setting initialState var, as it is StreamingChart's responsibility to do it.Next review will be on the PR directly.On Sun, Aug 27, 2023 at 5:58 PM Sahil Harpal <sahilharpal1234@gmail.com> wrote:Hello everyone,I have raised the PR.I would like to request you all to review the changes and provide your valuable feedback. Your insights and suggestions would be invaluable in ensuring the quality and accuracy of the codebase.Thank you,SahilOn Sun, 27 Aug 2023 at 07:13, Khushboo Vashi <khushboo.vashi@enterprisedb.com> wrote:On Sat, 26 Aug 2023, 11:36 Sahil Harpal, <sahilharpal1234@gmail.com> wrote:Hi Khushboo,On Mon, 21 Aug 2023 at 10:03, Khushboo Vashi <khushboo.vashi@enterprisedb.com> wrote:Sahil, once the issues get resolved, please raise the PR and we will do the final review there.Could you please tell me to which branch I should raise the PR?Master branchAlso, should I remove the code responsible for the static DonutChart of process information?Thank you,Sahil--Thanks,Aditya Toshniwal"Don't Complain about Heat, Plant a TREE"


Вложения
Hi Aditya,
I have made almost all of the requested changes and pushed the latest code. I just need a bit of clarification for a couple of suggestions that I have posted in the reviews.
I have made almost all of the requested changes and pushed the latest code. I just need a bit of clarification for a couple of suggestions that I have posted in the reviews.
Thank you,
Sahil

On Thu, 31 Aug 2023 at 17:20, Aditya Toshniwal <aditya.toshniwal@enterprisedb.com> wrote:
Hi Sahil,OK fine. We will check it later. Not priority. Please also fix the review raised on PR.On Thu, Aug 31, 2023, 16:17 Sahil Harpal <sahilharpal1234@gmail.com> wrote:Hi Aditya,I have made all these changes except the StreamingChart issue. I tried filling an array with null values inside the StreamingChart component while initializing initialState but still the issue is not resolved.I have made following changes:const initialState = [
Array.from(new Array(xRange).keys()),
...(data.datasets?.map((d)=>{
let nullValues = new Array(xRange - d.data.length).fill(null);
let ret = [...nullValues, ...d.data];
ret.reverse();
return ret;
})??{}),
];It works fine if we initialize the data array with the null values but I'm not getting why this is not working.Thank you,Sahil
Sender notified by
Mailtrack31/08/23, 16:14:27 On Mon, 28 Aug 2023 at 10:44, Aditya Toshniwal <aditya.toshniwal@enterprisedb.com> wrote:Hi Sahil,I have few observations. You have added separate titles for graphs and other tabular data. This is inconsistent with existing UI.For example,like here:like here:The dashboard goes blank when I change refresh rates.And regarding filling with nulls to fix the reversing issue of graph - you can do it in StreamingChart itself when setting initialState var, as it is StreamingChart's responsibility to do it.Next review will be on the PR directly.On Sun, Aug 27, 2023 at 5:58 PM Sahil Harpal <sahilharpal1234@gmail.com> wrote:Hello everyone,I have raised the PR.I would like to request you all to review the changes and provide your valuable feedback. Your insights and suggestions would be invaluable in ensuring the quality and accuracy of the codebase.Thank you,SahilOn Sun, 27 Aug 2023 at 07:13, Khushboo Vashi <khushboo.vashi@enterprisedb.com> wrote:On Sat, 26 Aug 2023, 11:36 Sahil Harpal, <sahilharpal1234@gmail.com> wrote:Hi Khushboo,On Mon, 21 Aug 2023 at 10:03, Khushboo Vashi <khushboo.vashi@enterprisedb.com> wrote:Sahil, once the issues get resolved, please raise the PR and we will do the final review there.Could you please tell me to which branch I should raise the PR?Master branchAlso, should I remove the code responsible for the static DonutChart of process information?Thank you,Sahil--Thanks,Aditya Toshniwal"Don't Complain about Heat, Plant a TREE"


Вложения
Hi Sahil,
I have replied to the PR.
On Sun, Sep 3, 2023 at 2:31 AM Sahil Harpal <sahilharpal1234@gmail.com> wrote:
Hi Aditya,
I have made almost all of the requested changes and pushed the latest code. I just need a bit of clarification for a couple of suggestions that I have posted in the reviews.Thank you,SahilOn Thu, 31 Aug 2023 at 17:20, Aditya Toshniwal <aditya.toshniwal@enterprisedb.com> wrote:Hi Sahil,OK fine. We will check it later. Not priority. Please also fix the review raised on PR.On Thu, Aug 31, 2023, 16:17 Sahil Harpal <sahilharpal1234@gmail.com> wrote:Hi Aditya,I have made all these changes except the StreamingChart issue. I tried filling an array with null values inside the StreamingChart component while initializing initialState but still the issue is not resolved.I have made following changes:const initialState = [
Array.from(new Array(xRange).keys()),
...(data.datasets?.map((d)=>{
let nullValues = new Array(xRange - d.data.length).fill(null);
let ret = [...nullValues, ...d.data];
ret.reverse();
return ret;
})??{}),
];It works fine if we initialize the data array with the null values but I'm not getting why this is not working.Thank you,Sahil
Sender notified by
Mailtrack31/08/23, 16:14:27 On Mon, 28 Aug 2023 at 10:44, Aditya Toshniwal <aditya.toshniwal@enterprisedb.com> wrote:Hi Sahil,I have few observations. You have added separate titles for graphs and other tabular data. This is inconsistent with existing UI.For example,like here:like here:The dashboard goes blank when I change refresh rates.And regarding filling with nulls to fix the reversing issue of graph - you can do it in StreamingChart itself when setting initialState var, as it is StreamingChart's responsibility to do it.Next review will be on the PR directly.On Sun, Aug 27, 2023 at 5:58 PM Sahil Harpal <sahilharpal1234@gmail.com> wrote:Hello everyone,I have raised the PR.I would like to request you all to review the changes and provide your valuable feedback. Your insights and suggestions would be invaluable in ensuring the quality and accuracy of the codebase.Thank you,SahilOn Sun, 27 Aug 2023 at 07:13, Khushboo Vashi <khushboo.vashi@enterprisedb.com> wrote:On Sat, 26 Aug 2023, 11:36 Sahil Harpal, <sahilharpal1234@gmail.com> wrote:Hi Khushboo,On Mon, 21 Aug 2023 at 10:03, Khushboo Vashi <khushboo.vashi@enterprisedb.com> wrote:Sahil, once the issues get resolved, please raise the PR and we will do the final review there.Could you please tell me to which branch I should raise the PR?Master branchAlso, should I remove the code responsible for the static DonutChart of process information?Thank you,Sahil--Thanks,Aditya Toshniwal"Don't Complain about Heat, Plant a TREE"


Thanks,
Aditya Toshniwal
"Don't Complain about Heat, Plant a TREE"
Вложения
Hi Aditya,
Sorry for the delay; I've been a bit busy lately. I have made all the requested changes. Could you please review it?
Thanks,
Sahil

On Mon, 4 Sept 2023 at 11:17, Aditya Toshniwal <aditya.toshniwal@enterprisedb.com> wrote:
Hi Sahil,I have replied to the PR.On Sun, Sep 3, 2023 at 2:31 AM Sahil Harpal <sahilharpal1234@gmail.com> wrote:Hi Aditya,
I have made almost all of the requested changes and pushed the latest code. I just need a bit of clarification for a couple of suggestions that I have posted in the reviews.Thank you,SahilOn Thu, 31 Aug 2023 at 17:20, Aditya Toshniwal <aditya.toshniwal@enterprisedb.com> wrote:Hi Sahil,OK fine. We will check it later. Not priority. Please also fix the review raised on PR.On Thu, Aug 31, 2023, 16:17 Sahil Harpal <sahilharpal1234@gmail.com> wrote:Hi Aditya,I have made all these changes except the StreamingChart issue. I tried filling an array with null values inside the StreamingChart component while initializing initialState but still the issue is not resolved.I have made following changes:const initialState = [
Array.from(new Array(xRange).keys()),
...(data.datasets?.map((d)=>{
let nullValues = new Array(xRange - d.data.length).fill(null);
let ret = [...nullValues, ...d.data];
ret.reverse();
return ret;
})??{}),
];It works fine if we initialize the data array with the null values but I'm not getting why this is not working.Thank you,Sahil
Sender notified by
Mailtrack31/08/23, 16:14:27 On Mon, 28 Aug 2023 at 10:44, Aditya Toshniwal <aditya.toshniwal@enterprisedb.com> wrote:Hi Sahil,I have few observations. You have added separate titles for graphs and other tabular data. This is inconsistent with existing UI.For example,like here:like here:The dashboard goes blank when I change refresh rates.And regarding filling with nulls to fix the reversing issue of graph - you can do it in StreamingChart itself when setting initialState var, as it is StreamingChart's responsibility to do it.Next review will be on the PR directly.On Sun, Aug 27, 2023 at 5:58 PM Sahil Harpal <sahilharpal1234@gmail.com> wrote:Hello everyone,I have raised the PR.I would like to request you all to review the changes and provide your valuable feedback. Your insights and suggestions would be invaluable in ensuring the quality and accuracy of the codebase.Thank you,SahilOn Sun, 27 Aug 2023 at 07:13, Khushboo Vashi <khushboo.vashi@enterprisedb.com> wrote:On Sat, 26 Aug 2023, 11:36 Sahil Harpal, <sahilharpal1234@gmail.com> wrote:Hi Khushboo,On Mon, 21 Aug 2023 at 10:03, Khushboo Vashi <khushboo.vashi@enterprisedb.com> wrote:Sahil, once the issues get resolved, please raise the PR and we will do the final review there.Could you please tell me to which branch I should raise the PR?Master branchAlso, should I remove the code responsible for the static DonutChart of process information?Thank you,Sahil--Thanks,Aditya Toshniwal"Don't Complain about Heat, Plant a TREE"--Thanks,Aditya Toshniwal"Don't Complain about Heat, Plant a TREE"


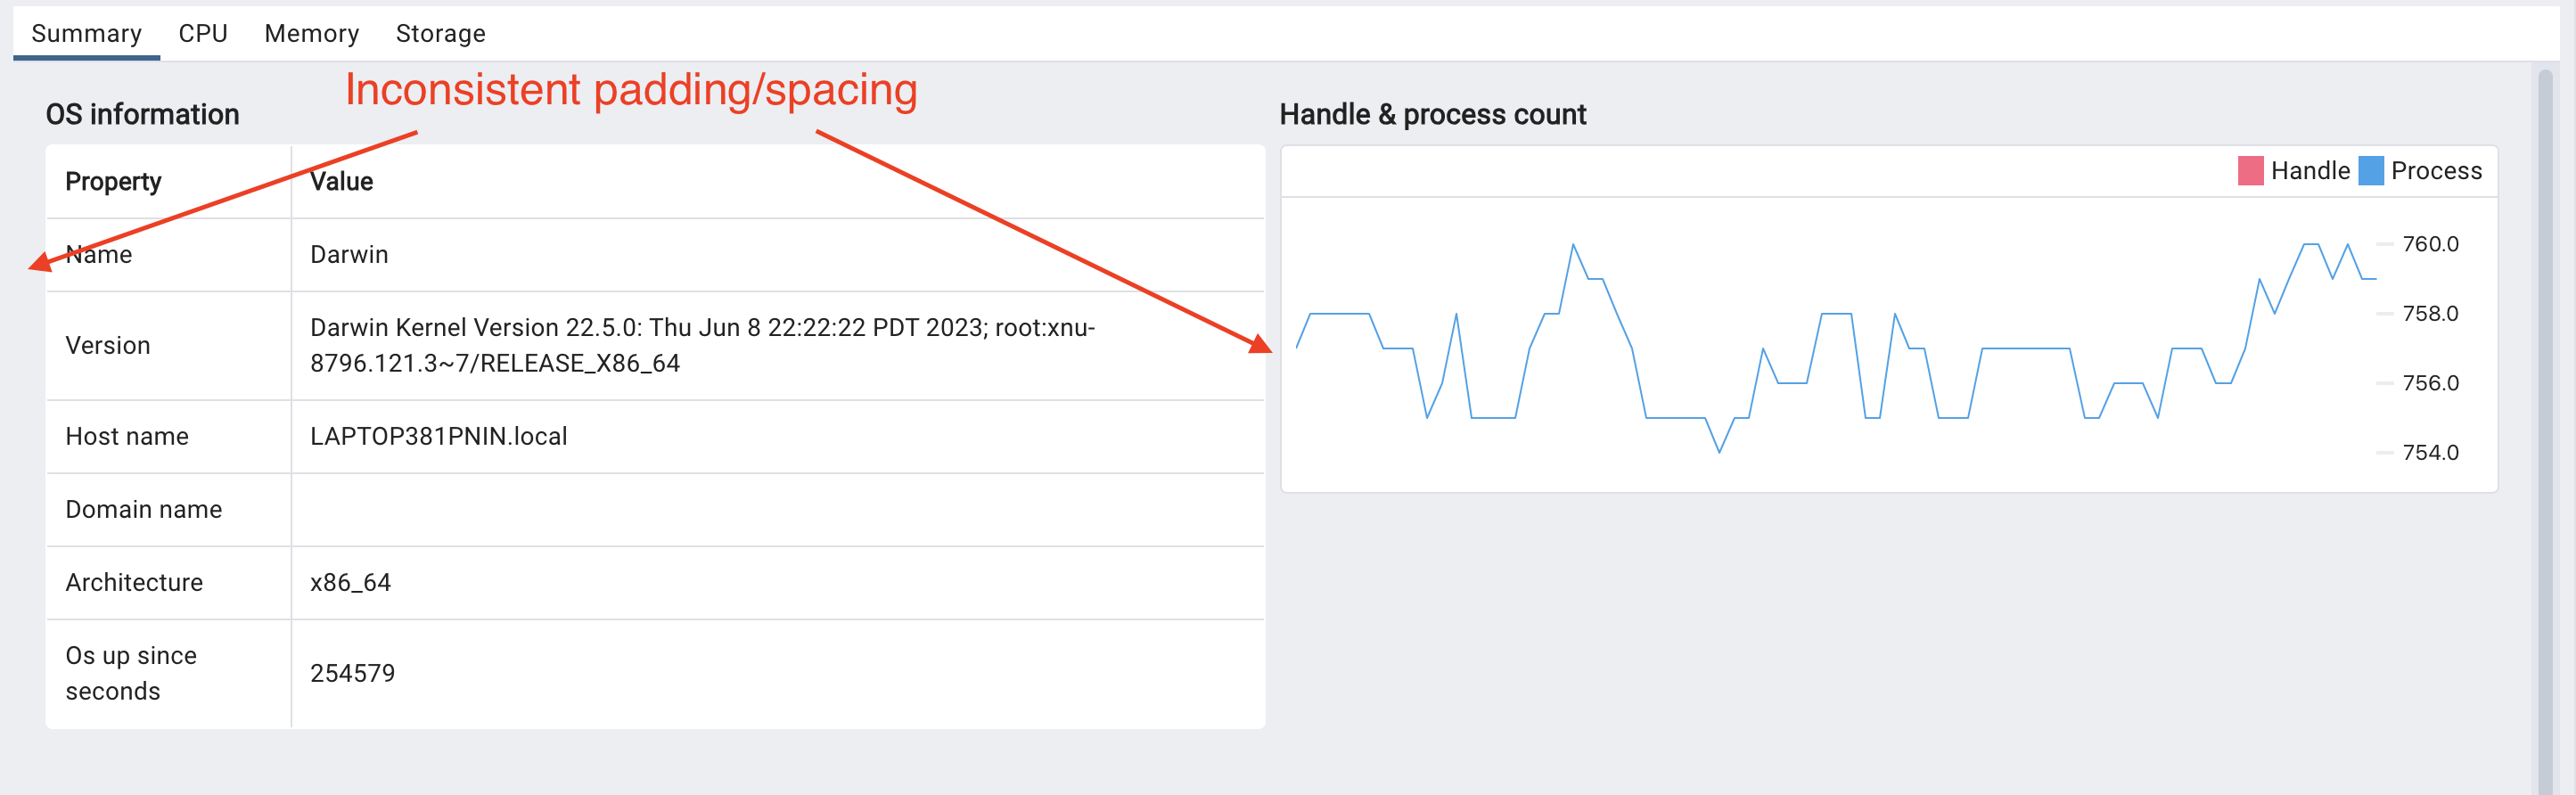

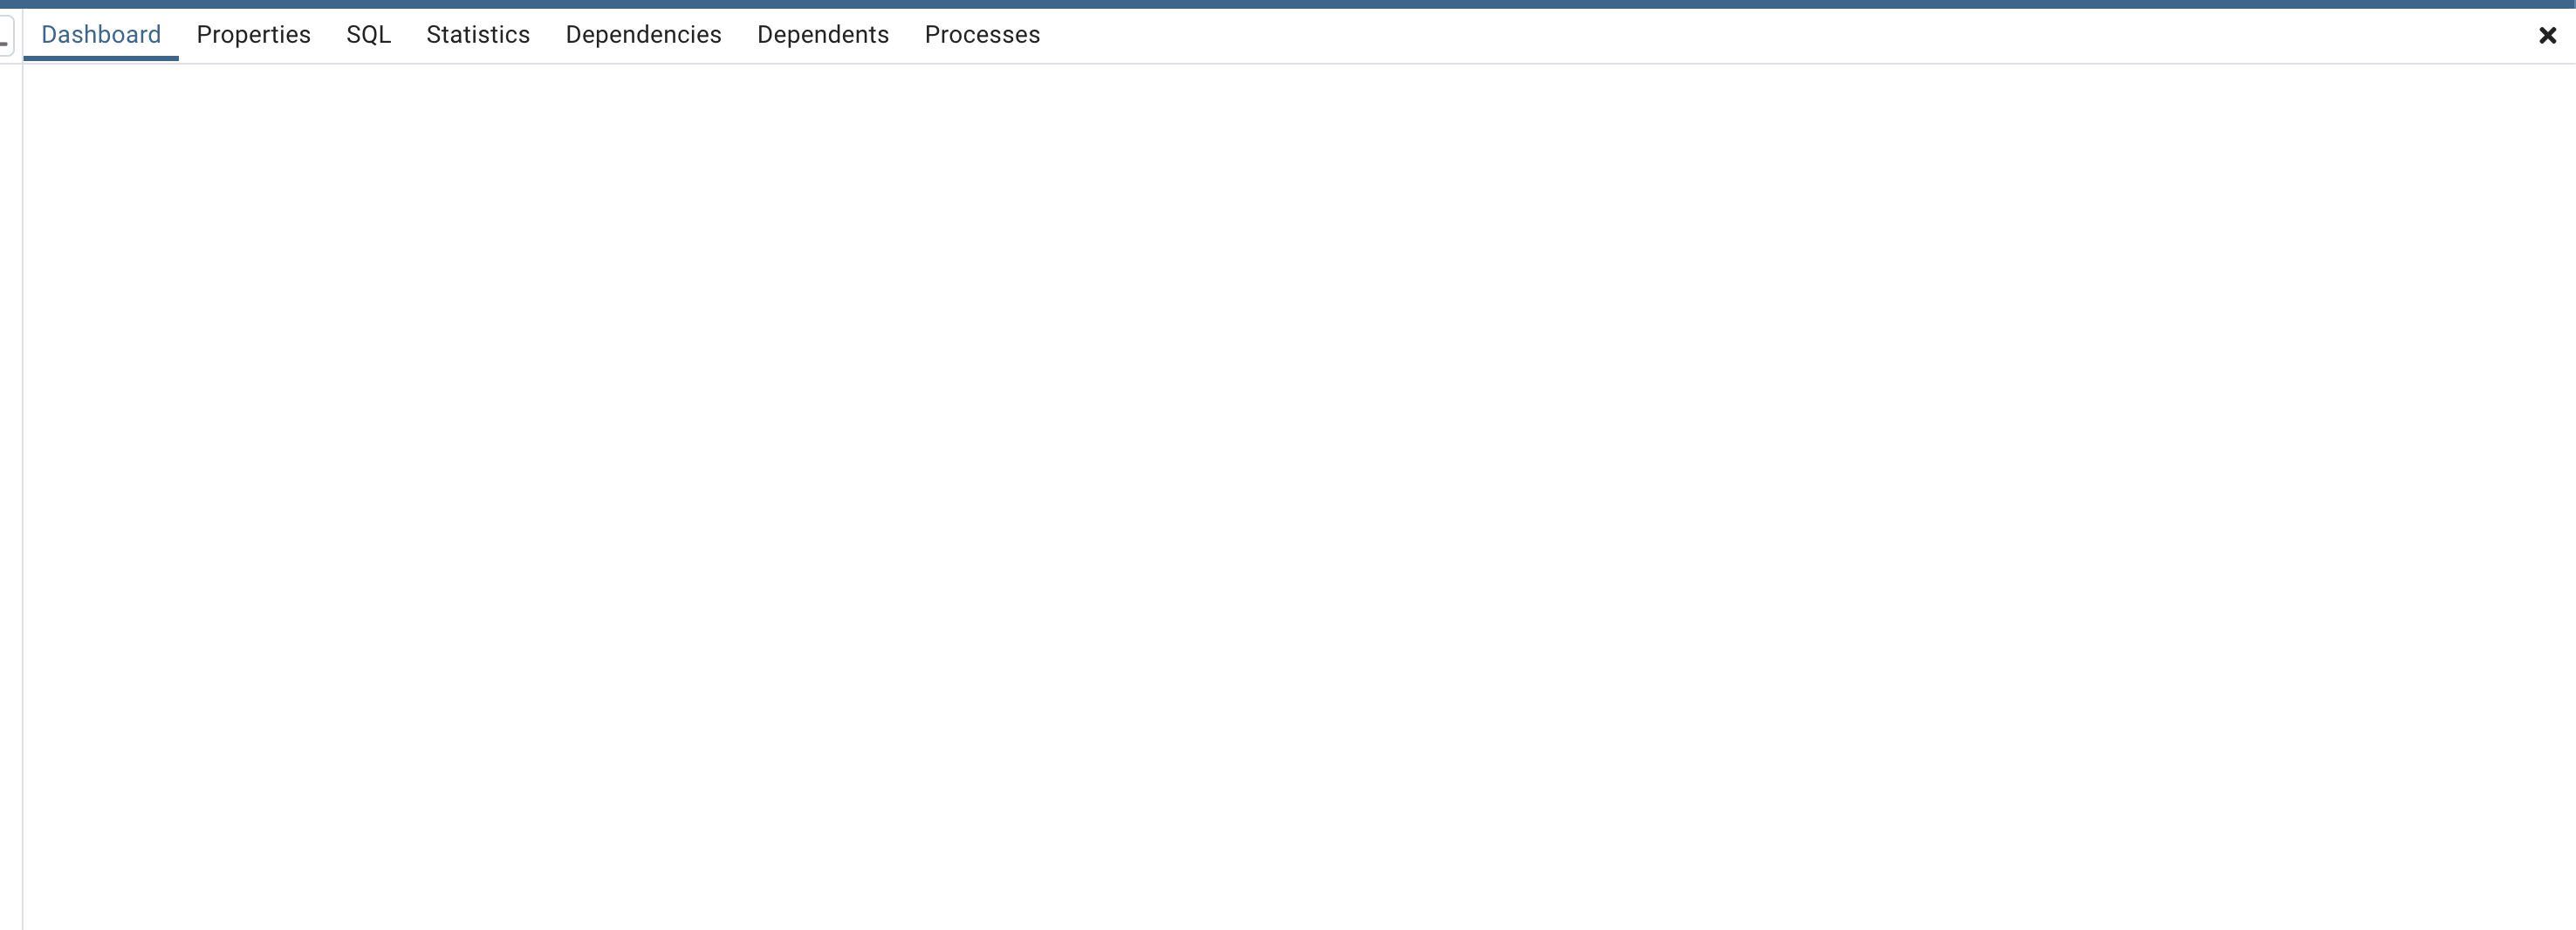
Вложения
Hi Sahil,
Your PR is showing 135 file changes and a lot of commits which shouldn't have appeared on your PR.
It is very difficult to identify your changes. Can you please check once?
On Fri, Sep 8, 2023 at 1:13 AM Sahil Harpal <sahilharpal1234@gmail.com> wrote:
Hi Aditya,Sorry for the delay; I've been a bit busy lately. I have made all the requested changes. Could you please review it?Thanks,SahilOn Mon, 4 Sept 2023 at 11:17, Aditya Toshniwal <aditya.toshniwal@enterprisedb.com> wrote:Hi Sahil,I have replied to the PR.On Sun, Sep 3, 2023 at 2:31 AM Sahil Harpal <sahilharpal1234@gmail.com> wrote:Hi Aditya,
I have made almost all of the requested changes and pushed the latest code. I just need a bit of clarification for a couple of suggestions that I have posted in the reviews.Thank you,SahilOn Thu, 31 Aug 2023 at 17:20, Aditya Toshniwal <aditya.toshniwal@enterprisedb.com> wrote:Hi Sahil,OK fine. We will check it later. Not priority. Please also fix the review raised on PR.On Thu, Aug 31, 2023, 16:17 Sahil Harpal <sahilharpal1234@gmail.com> wrote:Hi Aditya,I have made all these changes except the StreamingChart issue. I tried filling an array with null values inside the StreamingChart component while initializing initialState but still the issue is not resolved.I have made following changes:const initialState = [
Array.from(new Array(xRange).keys()),
...(data.datasets?.map((d)=>{
let nullValues = new Array(xRange - d.data.length).fill(null);
let ret = [...nullValues, ...d.data];
ret.reverse();
return ret;
})??{}),
];It works fine if we initialize the data array with the null values but I'm not getting why this is not working.Thank you,Sahil
Sender notified by
Mailtrack31/08/23, 16:14:27 On Mon, 28 Aug 2023 at 10:44, Aditya Toshniwal <aditya.toshniwal@enterprisedb.com> wrote:Hi Sahil,I have few observations. You have added separate titles for graphs and other tabular data. This is inconsistent with existing UI.For example,like here:like here:The dashboard goes blank when I change refresh rates.And regarding filling with nulls to fix the reversing issue of graph - you can do it in StreamingChart itself when setting initialState var, as it is StreamingChart's responsibility to do it.Next review will be on the PR directly.On Sun, Aug 27, 2023 at 5:58 PM Sahil Harpal <sahilharpal1234@gmail.com> wrote:Hello everyone,I have raised the PR.I would like to request you all to review the changes and provide your valuable feedback. Your insights and suggestions would be invaluable in ensuring the quality and accuracy of the codebase.Thank you,SahilOn Sun, 27 Aug 2023 at 07:13, Khushboo Vashi <khushboo.vashi@enterprisedb.com> wrote:On Sat, 26 Aug 2023, 11:36 Sahil Harpal, <sahilharpal1234@gmail.com> wrote:Hi Khushboo,On Mon, 21 Aug 2023 at 10:03, Khushboo Vashi <khushboo.vashi@enterprisedb.com> wrote:Sahil, once the issues get resolved, please raise the PR and we will do the final review there.Could you please tell me to which branch I should raise the PR?Master branchAlso, should I remove the code responsible for the static DonutChart of process information?Thank you,Sahil--Thanks,Aditya Toshniwal"Don't Complain about Heat, Plant a TREE"--Thanks,Aditya Toshniwal"Don't Complain about Heat, Plant a TREE"

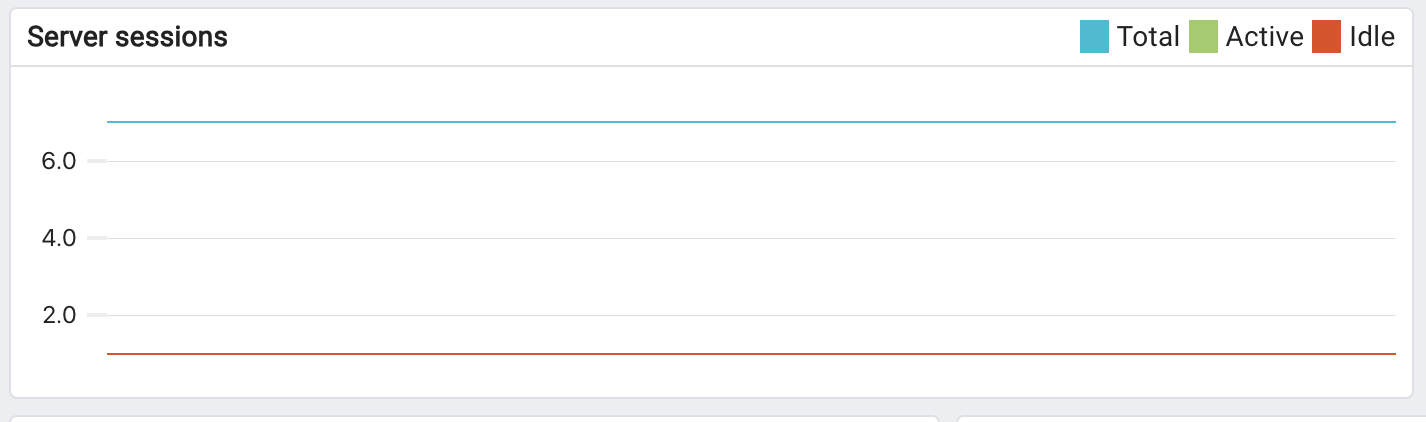


Thanks,
Aditya Toshniwal
"Don't Complain about Heat, Plant a TREE"
Вложения
Oh yeah! Maybe because I rebased the branch. I'll try to fix this.
On Fri, Sep 8, 2023, 9:04 AM Aditya Toshniwal <aditya.toshniwal@enterprisedb.com> wrote:
Hi Sahil,Your PR is showing 135 file changes and a lot of commits which shouldn't have appeared on your PR.It is very difficult to identify your changes. Can you please check once?On Fri, Sep 8, 2023 at 1:13 AM Sahil Harpal <sahilharpal1234@gmail.com> wrote:Hi Aditya,Sorry for the delay; I've been a bit busy lately. I have made all the requested changes. Could you please review it?Thanks,SahilOn Mon, 4 Sept 2023 at 11:17, Aditya Toshniwal <aditya.toshniwal@enterprisedb.com> wrote:Hi Sahil,I have replied to the PR.On Sun, Sep 3, 2023 at 2:31 AM Sahil Harpal <sahilharpal1234@gmail.com> wrote:Hi Aditya,
I have made almost all of the requested changes and pushed the latest code. I just need a bit of clarification for a couple of suggestions that I have posted in the reviews.Thank you,SahilOn Thu, 31 Aug 2023 at 17:20, Aditya Toshniwal <aditya.toshniwal@enterprisedb.com> wrote:Hi Sahil,OK fine. We will check it later. Not priority. Please also fix the review raised on PR.On Thu, Aug 31, 2023, 16:17 Sahil Harpal <sahilharpal1234@gmail.com> wrote:Hi Aditya,I have made all these changes except the StreamingChart issue. I tried filling an array with null values inside the StreamingChart component while initializing initialState but still the issue is not resolved.I have made following changes:const initialState = [
Array.from(new Array(xRange).keys()),
...(data.datasets?.map((d)=>{
let nullValues = new Array(xRange - d.data.length).fill(null);
let ret = [...nullValues, ...d.data];
ret.reverse();
return ret;
})??{}),
];It works fine if we initialize the data array with the null values but I'm not getting why this is not working.Thank you,Sahil
Sender notified by
Mailtrack31/08/23, 16:14:27 On Mon, 28 Aug 2023 at 10:44, Aditya Toshniwal <aditya.toshniwal@enterprisedb.com> wrote:Hi Sahil,I have few observations. You have added separate titles for graphs and other tabular data. This is inconsistent with existing UI.For example,like here:like here:The dashboard goes blank when I change refresh rates.And regarding filling with nulls to fix the reversing issue of graph - you can do it in StreamingChart itself when setting initialState var, as it is StreamingChart's responsibility to do it.Next review will be on the PR directly.On Sun, Aug 27, 2023 at 5:58 PM Sahil Harpal <sahilharpal1234@gmail.com> wrote:Hello everyone,I have raised the PR.I would like to request you all to review the changes and provide your valuable feedback. Your insights and suggestions would be invaluable in ensuring the quality and accuracy of the codebase.Thank you,SahilOn Sun, 27 Aug 2023 at 07:13, Khushboo Vashi <khushboo.vashi@enterprisedb.com> wrote:On Sat, 26 Aug 2023, 11:36 Sahil Harpal, <sahilharpal1234@gmail.com> wrote:Hi Khushboo,On Mon, 21 Aug 2023 at 10:03, Khushboo Vashi <khushboo.vashi@enterprisedb.com> wrote:Sahil, once the issues get resolved, please raise the PR and we will do the final review there.Could you please tell me to which branch I should raise the PR?Master branchAlso, should I remove the code responsible for the static DonutChart of process information?Thank you,Sahil--Thanks,Aditya Toshniwal"Don't Complain about Heat, Plant a TREE"--Thanks,Aditya Toshniwal"Don't Complain about Heat, Plant a TREE"--Thanks,Aditya Toshniwal"Don't Complain about Heat, Plant a TREE"


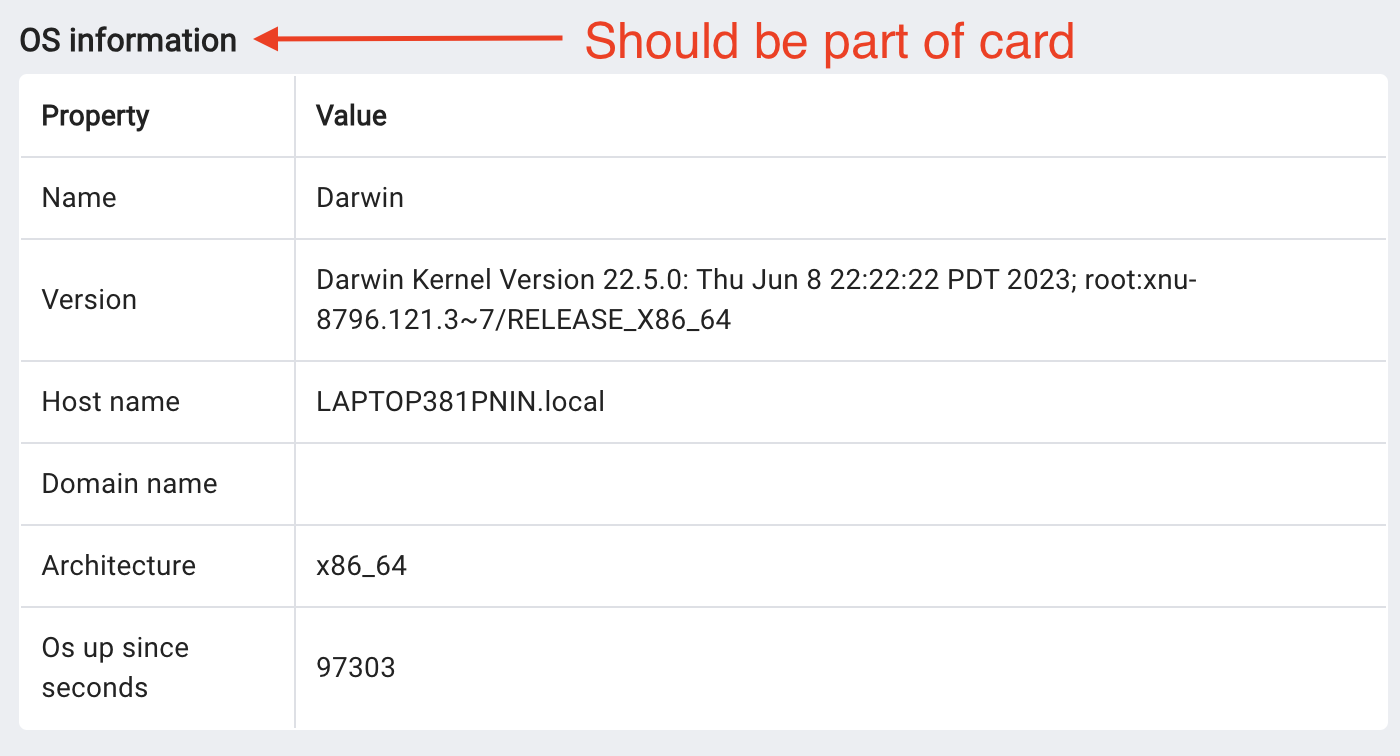


Вложения

On Fri, 8 Sept 2023 at 10:50, Sahil Harpal <sahilharpal1234@gmail.com> wrote:
Oh yeah! Maybe because I rebased the branch. I'll try to fix this.On Fri, Sep 8, 2023, 9:04 AM Aditya Toshniwal <aditya.toshniwal@enterprisedb.com> wrote:Hi Sahil,Your PR is showing 135 file changes and a lot of commits which shouldn't have appeared on your PR.It is very difficult to identify your changes. Can you please check once?On Fri, Sep 8, 2023 at 1:13 AM Sahil Harpal <sahilharpal1234@gmail.com> wrote:Hi Aditya,Sorry for the delay; I've been a bit busy lately. I have made all the requested changes. Could you please review it?Thanks,SahilOn Mon, 4 Sept 2023 at 11:17, Aditya Toshniwal <aditya.toshniwal@enterprisedb.com> wrote:Hi Sahil,I have replied to the PR.On Sun, Sep 3, 2023 at 2:31 AM Sahil Harpal <sahilharpal1234@gmail.com> wrote:Hi Aditya,
I have made almost all of the requested changes and pushed the latest code. I just need a bit of clarification for a couple of suggestions that I have posted in the reviews.Thank you,SahilOn Thu, 31 Aug 2023 at 17:20, Aditya Toshniwal <aditya.toshniwal@enterprisedb.com> wrote:Hi Sahil,OK fine. We will check it later. Not priority. Please also fix the review raised on PR.On Thu, Aug 31, 2023, 16:17 Sahil Harpal <sahilharpal1234@gmail.com> wrote:Hi Aditya,I have made all these changes except the StreamingChart issue. I tried filling an array with null values inside the StreamingChart component while initializing initialState but still the issue is not resolved.I have made following changes:const initialState = [
Array.from(new Array(xRange).keys()),
...(data.datasets?.map((d)=>{
let nullValues = new Array(xRange - d.data.length).fill(null);
let ret = [...nullValues, ...d.data];
ret.reverse();
return ret;
})??{}),
];It works fine if we initialize the data array with the null values but I'm not getting why this is not working.Thank you,Sahil
Sender notified by
Mailtrack31/08/23, 16:14:27 On Mon, 28 Aug 2023 at 10:44, Aditya Toshniwal <aditya.toshniwal@enterprisedb.com> wrote:Hi Sahil,I have few observations. You have added separate titles for graphs and other tabular data. This is inconsistent with existing UI.For example,like here:like here:The dashboard goes blank when I change refresh rates.And regarding filling with nulls to fix the reversing issue of graph - you can do it in StreamingChart itself when setting initialState var, as it is StreamingChart's responsibility to do it.Next review will be on the PR directly.On Sun, Aug 27, 2023 at 5:58 PM Sahil Harpal <sahilharpal1234@gmail.com> wrote:Hello everyone,I have raised the PR.I would like to request you all to review the changes and provide your valuable feedback. Your insights and suggestions would be invaluable in ensuring the quality and accuracy of the codebase.Thank you,SahilOn Sun, 27 Aug 2023 at 07:13, Khushboo Vashi <khushboo.vashi@enterprisedb.com> wrote:On Sat, 26 Aug 2023, 11:36 Sahil Harpal, <sahilharpal1234@gmail.com> wrote:Hi Khushboo,On Mon, 21 Aug 2023 at 10:03, Khushboo Vashi <khushboo.vashi@enterprisedb.com> wrote:Sahil, once the issues get resolved, please raise the PR and we will do the final review there.Could you please tell me to which branch I should raise the PR?Master branchAlso, should I remove the code responsible for the static DonutChart of process information?Thank you,Sahil--Thanks,Aditya Toshniwal"Don't Complain about Heat, Plant a TREE"--Thanks,Aditya Toshniwal"Don't Complain about Heat, Plant a TREE"--Thanks,Aditya Toshniwal"Don't Complain about Heat, Plant a TREE"
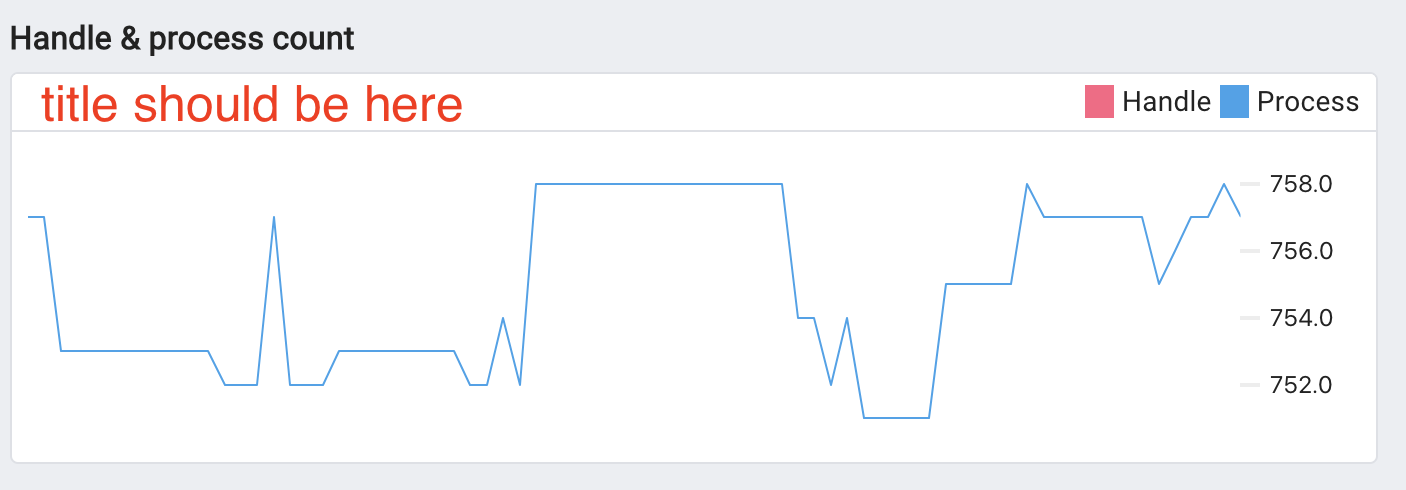


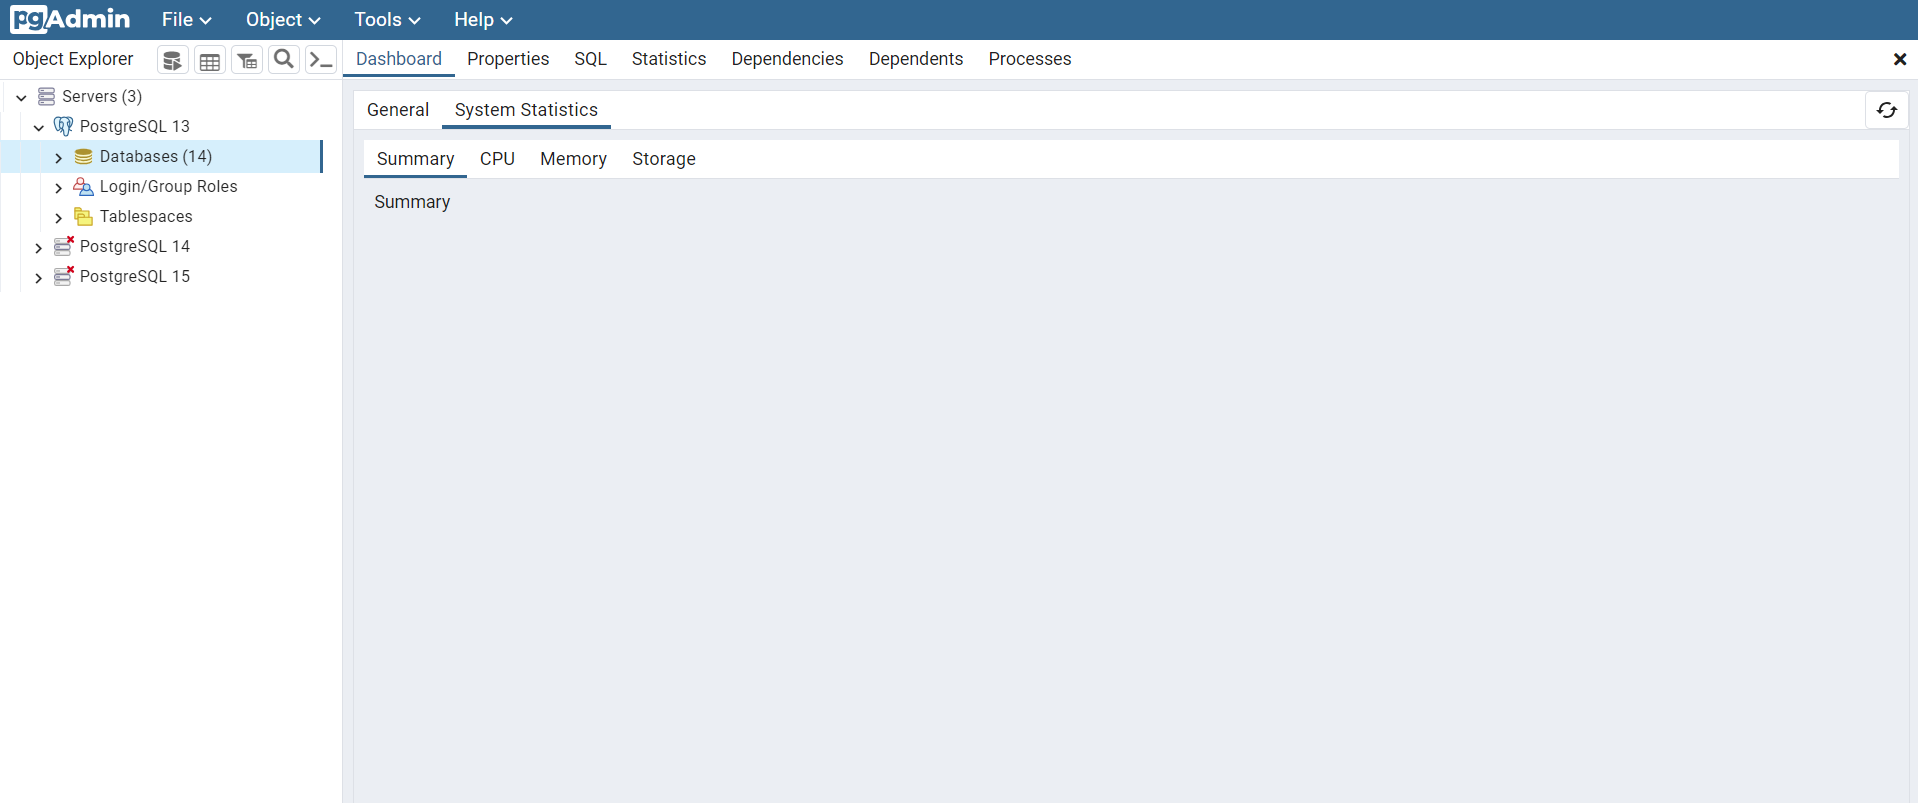
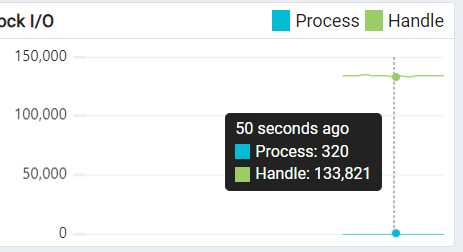
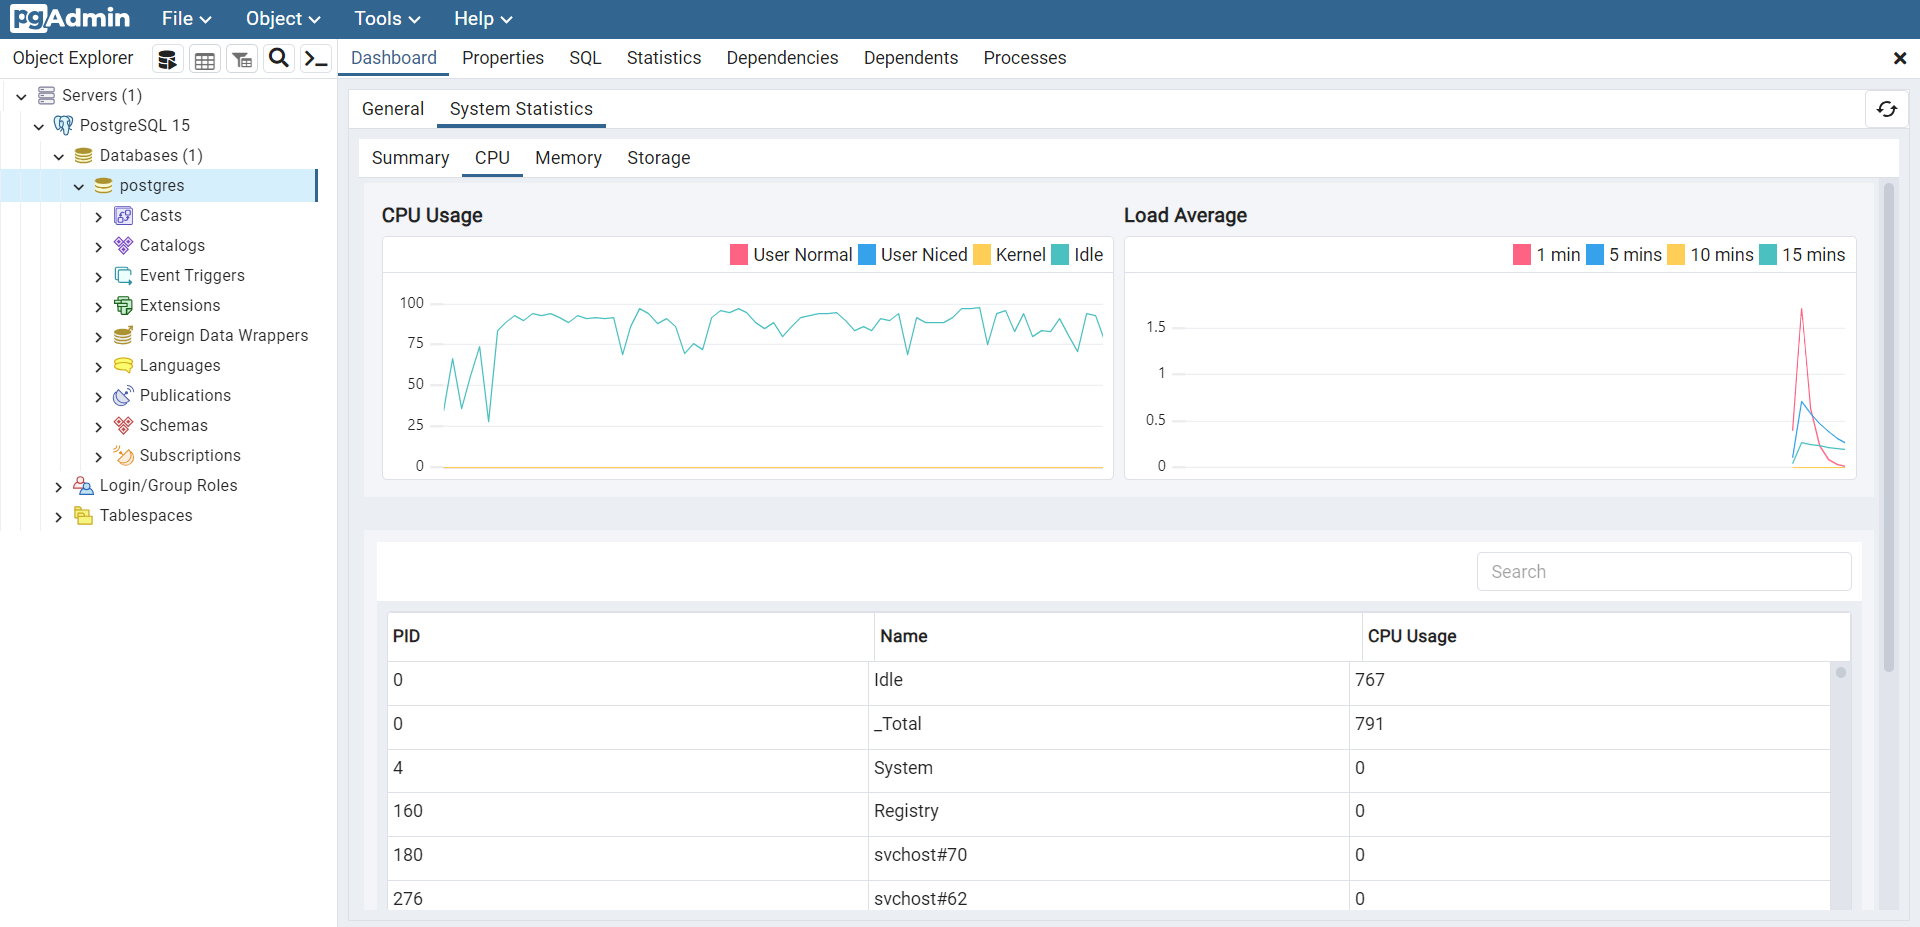
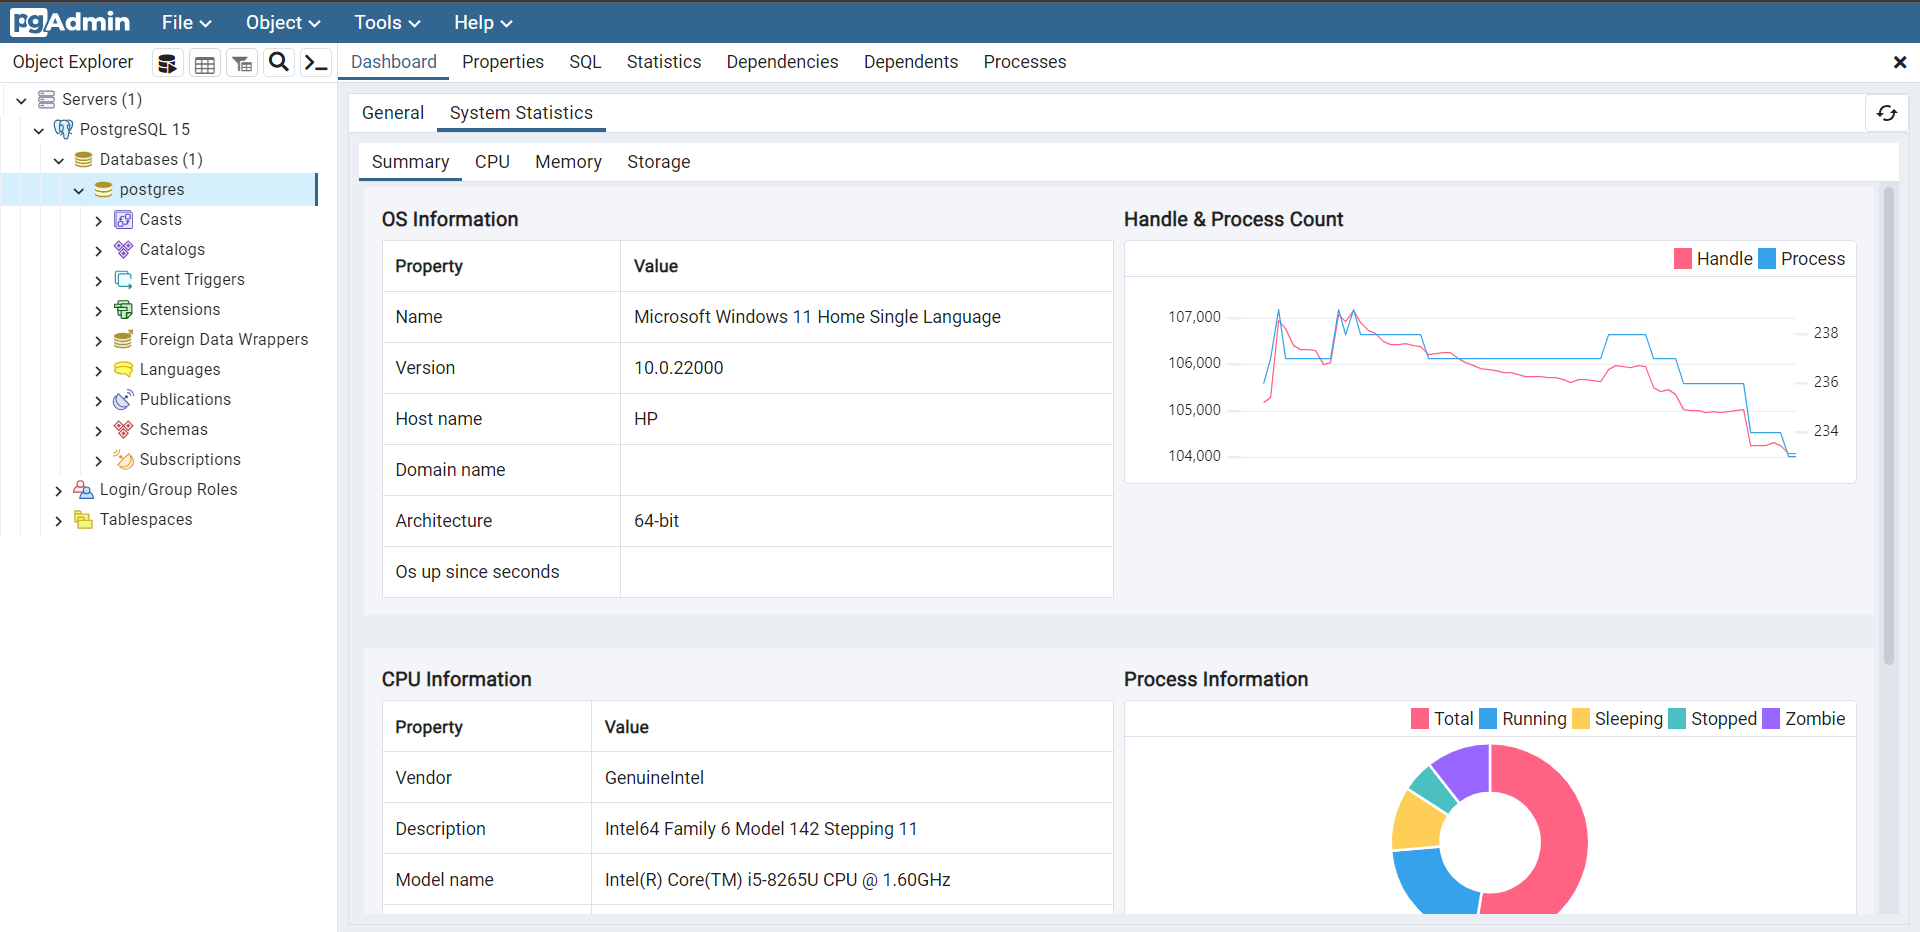
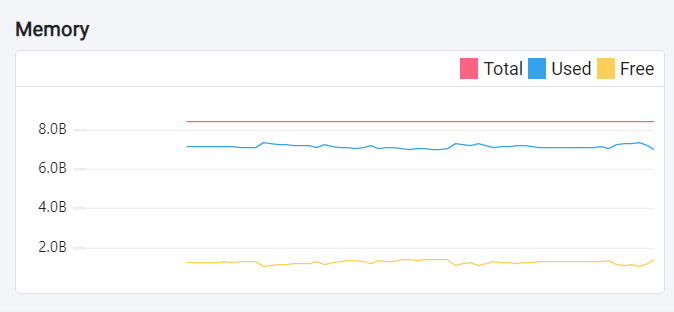
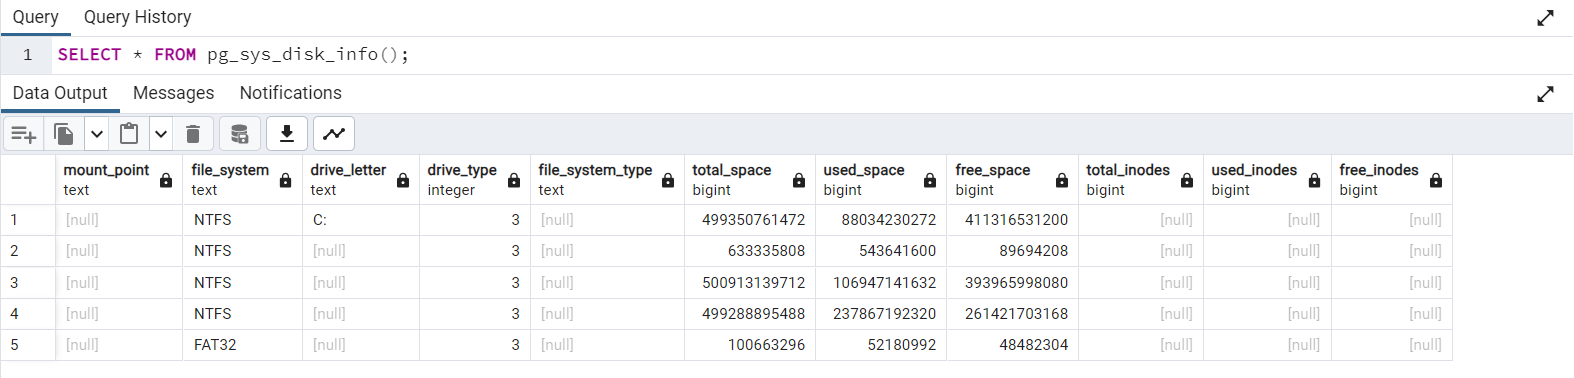
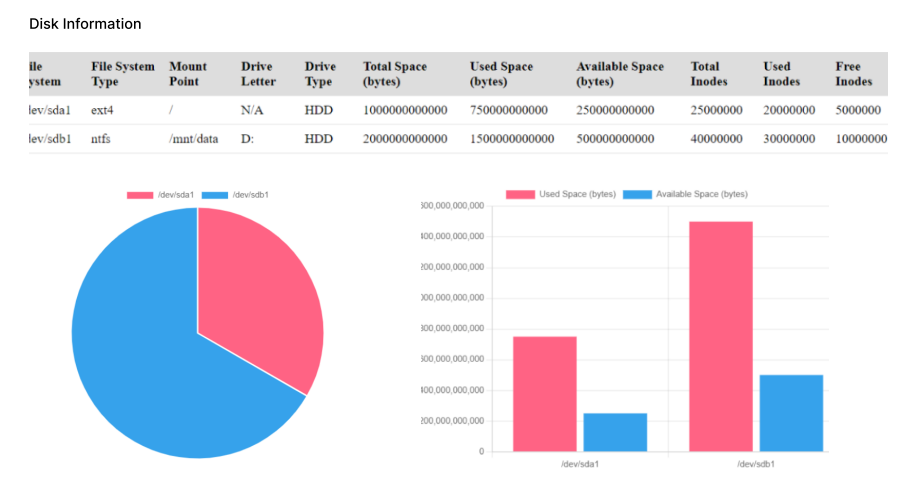
Вложения
Hello Aditya,
On Fri, 8 Sept 2023 at 09:04, Aditya Toshniwal <aditya.toshniwal@enterprisedb.com> wrote:
Hi Sahil,Your PR is showing 135 file changes and a lot of commits which shouldn't have appeared on your PR.It is very difficult to identify your changes. Can you please check once?
I have resolved the issue with the extra commits, and now there are only 9 files that I have updated.
Please let me know if there is anything else required from my side.
Thank you,
Sahil
Hi Khushboo,
Thank you,
Could you please suggest labels for the tables in the Memory and CPU tabs.
Also, I'm not able to reproduce the alignment issue that you have mentioned, but I have added a fix to by setting width to 100% maybe it would work.
Sahil