Обсуждение: POC: Extension for adding distributed tracing - pg_tracing
Hi hackers,
Currently, most distributed tracing solutions only provide details from the client's drivers point of view. We don't have visibility when the query reached the database and how the query was processed.
The goal of this project is to provide distributed tracing within the database to provide more insights on a query execution as an extension. The idea and architecture is heavily inspired by pg_stat_statements and auto_explain.
I have a working prototype of a pg_tracing extension and wanted some feedback on the design and architecture.
Some definitions: (paraphrased from opentelemetry https://opentelemetry.io/docs/concepts/signals/traces/)
A trace groups multiple spans and a span represents a single specific operation. It is defined by:
- a trace_id
- a spanid (randomly generated int64)
- a name
- a parent id (a span can have children)
- a start timestamp
- a duration
- Attributes (key value metadatas)
We will use attributes to propagate the query's instrumentation details: buffer usage, jit, wal usage, first tuple, plan cost...
Triggering a trace:
===============
We rely on https://google.github.io/sqlcommenter/ to propagate trace information.
A query with sqlcommenter will look like: /*dddbs='postgres.db',traceparent='00-00000000000000000000000000000009-0000000000000005-01'*/ select 1;
The traceparent fields are detailed in https://www.w3.org/TR/trace-context/#traceparent-header-field-values
The 3 fields are
00000000000000000000000000000009: trace id
0000000000000005: parent id
01: trace flags (01 == sampled)
If the query is sampled, we instrument the query and generate spans for the following operations:
- Query Span: The top span for a query. They are created after extracting the traceid from traceparent or to represent a nested query. We always have at least one. We may have more if we have a nested query.
- Planner: We track the time spent in the planner and report the planner counters
- Executor: We trace the different steps of the Executor: Start, Run, Finish and End
- Node Span: Created from planstate. The name is extracted from the node type (IndexScan, SeqScan). For the operation name, we generate something similar to the explain.
Storing spans:
===============
Spans are stored in a shared memory buffer. The buffer size is fixed and if it is full, no further spans are generated until the buffer is freed.
We store multiple information with variable sized text in the spans: names, parameter values...
To avoid keeping those in the shared memory, we store them in an external file (similar to pg_stat_statements query text).
Processing spans:
===============
Traces need to be sent to a trace collector. We offload this logic to an external application which will:
- Collect the spans through a new pg_tracing_spans() function output
- Built spans in any format specific to the targeted trace collector (opentelemetry, datadog...)
- Send it to the targeted trace collector using the appropriate protocol (gRPC, http...)
I have an example of a span forwarder that I've been using in my tests available here: https://gist.github.com/bonnefoa/6ed24520bdac026d6a6a6992d308bd50.
This setup permits a lot of flexibility:
- The postgres extension doesn't need any vendor specific knowledge
- The trace forwarder can reuse existing libraries and any languages to send spans
Buffer management:
===============
I've tried to keep the memory management simple. Creating spans will add new elements to the shared_spans buffer.
Once a span is forwarded, there's no need to keep it in the shared memory.
Thus, pg_tracing_spans has a "consume" parameter which will completely empty the shared buffers when called by the forwarder.
If we have a regularly full buffers, then we can:
- increase forwarder's frequency
- increase the shared buffer size
- decrease the amount of generated spans
Statistics are available through pg_tracing_info to keep track of the number of generated spans and dropped events.
Overhead:
===============
I haven't run benchmarks yet, however, we will have multiple ways to control the overhead.
Traces rely heavily on sampling to keep the overhead low: we want extensive information on representative samples of our queries.
For now, we leave the sampling decision to the caller (through the sampled flag) but I will add an additional parameter to allow additional sampling if the rate of traced queries is too high.
Stopping tracing when we have a full buffer is also a good safeguard. If an application is misconfigured and starts sampling every queries, this will stop all tracing and won't impact query performances.
Query Instrumentation:
===============
I have been able to rely on most of existing query instrumentation except for one missing information: I needed to know the start of a node as we currently only have the first tuple and the duration. I added firsttime to Instrumentation. This is the only change done outside the extension's code.
Current status:
===============
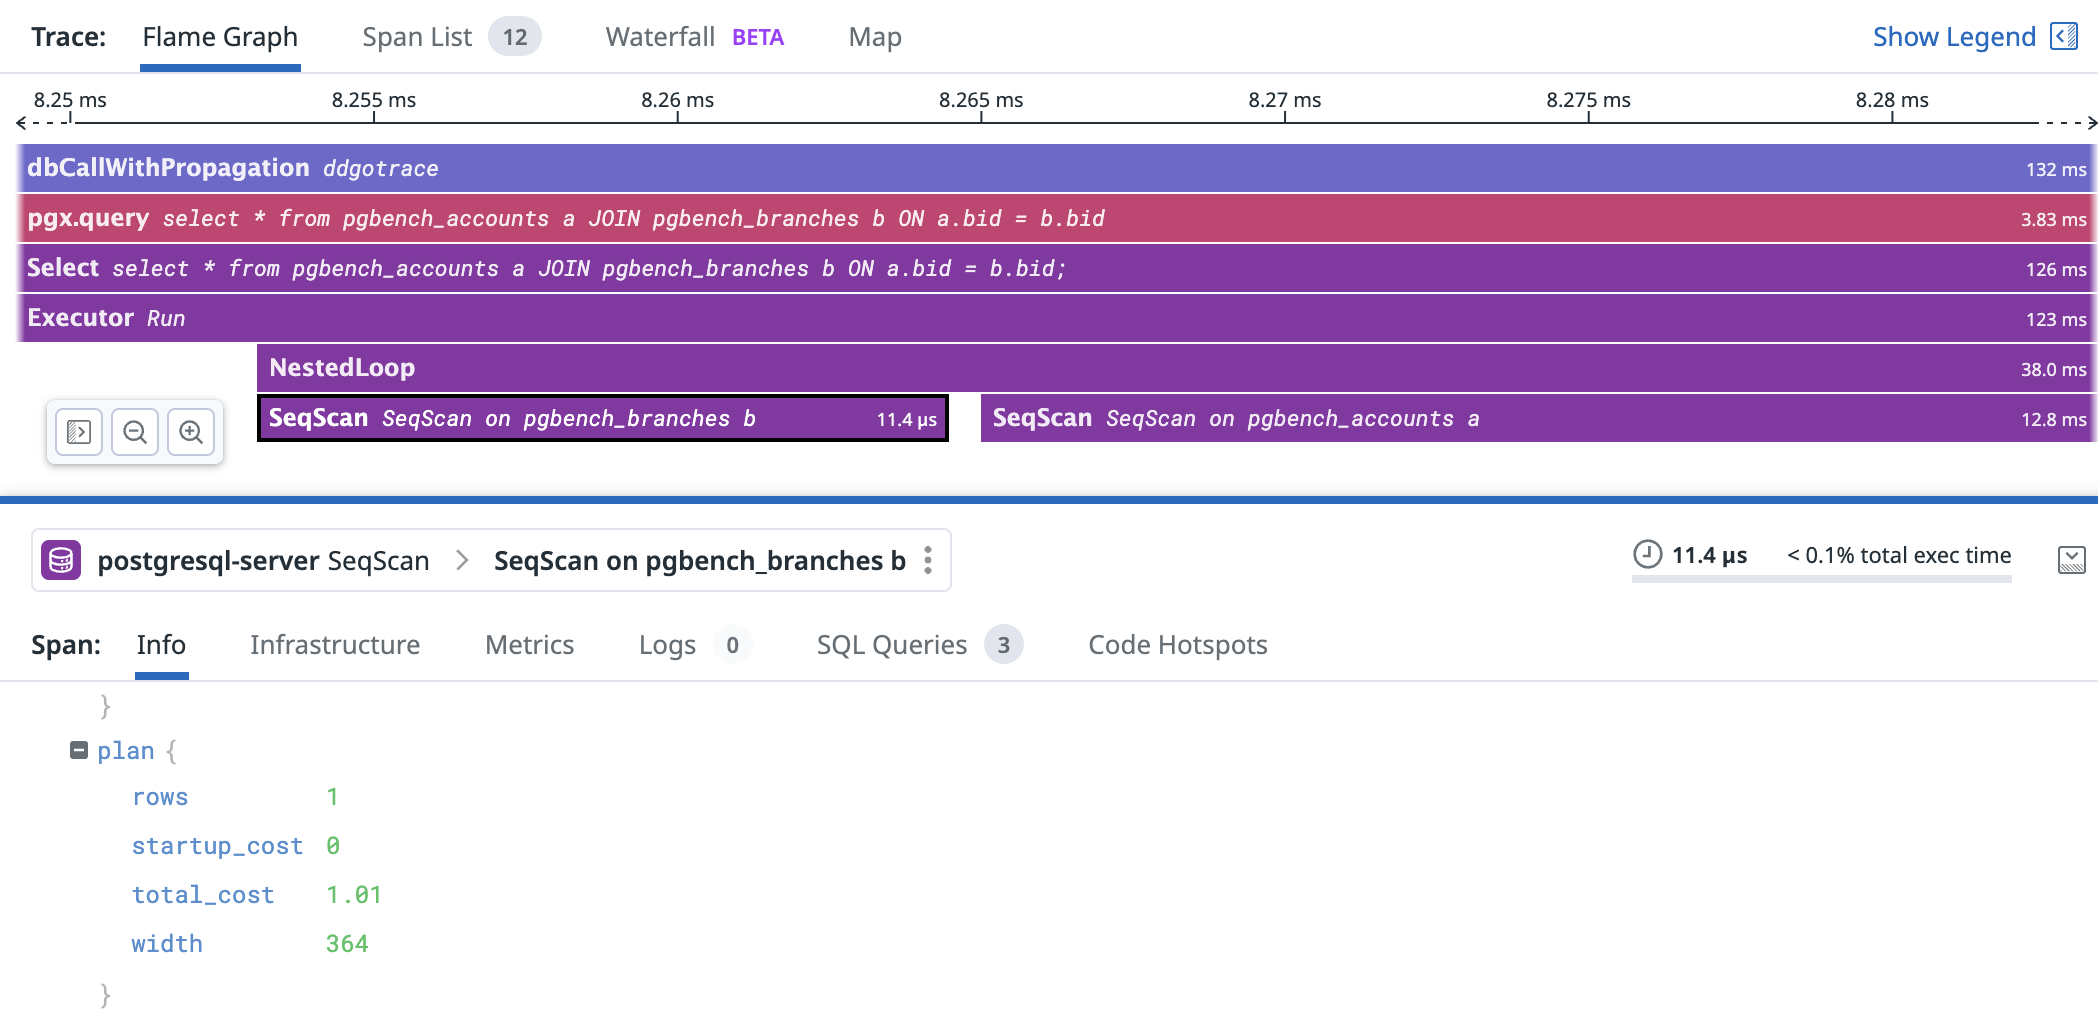
The current code is able to generate spans which once forwarded to the trace collector, I was able to get traces with execution details with similar amount of information that an explain (analyze, buffers) would provide. I have provided screenshots of the result.
There's a lot of work left in cleaning, commenting, handling edge cases and adding tests.
Thoughts and feedback are welcome.
Regards,
Anthonin Bonnefoy
Вложения
Hi Anthonin,

> I have a working prototype of a pg_tracing extension and wanted some feedback on the design and architecture.

The patch looks very interesting, thanks for working on it and for
sharing. The facts that the patch doesn't change the core except for
two lines in instrument.{c.h} and that is uses pull-based model:

> - Collect the spans through a new pg_tracing_spans() function output

... IMO were the right design decisions. The patch lacks the
documentation, but this is OK for a PoC.

I added the patch to the nearest CF [1]. Let's see what the rest of
the community thinks.

[1] https://commitfest.postgresql.org/44/4456/

--
Best regards,
Aleksander Alekseev
Hi Anthonin,
> I have a working prototype of a pg_tracing extension and wanted some feedback on the design and architecture.
The patch looks very interesting, thanks for working on it and for
sharing. The facts that the patch doesn't change the core except for
two lines in instrument.{c.h} and that is uses pull-based model:
> - Collect the spans through a new pg_tracing_spans() function output
... IMO were the right design decisions. The patch lacks the
documentation, but this is OK for a PoC.
I added the patch to the nearest CF [1]. Let's see what the rest of
the community thinks.
[1] https://commitfest.postgresql.org/44/4456/
--
Best regards,
Aleksander Alekseev
Nikita,

> This patch looks very interesting, I'm working on the same subject too. But I've used
> another approach - I'm using C wrapper for C++ API library from OpenTelemetry, and
> handle span storage and output to this library. There are some nuances though, but it
> is possible. Have you tried to use OpenTelemetry APIs instead of implementing all
> functionality around spans?

I don't think that PostgreSQL accepts such kind of C++ code, not to
mention the fact that the PostgreSQL license is not necessarily
compatible with Apache 2.0 (I'm not a lawyer; this is not a legal
advice). Such a design decision will probably require using separate
compile flags since the user doesn't necessarily have a corresponding
dependency installed. Similarly to how we do with LLVM, OpenSSL, etc.

So -1 to the OpenTelemetry C++ library and +1 to the properly licensed
C implementation without 3rd party dependencies from me. Especially
considering the fact that the implementation seems to be rather
simple.

--
Best regards,
Aleksander Alekseev
I've initially thought of sending the spans from PostgreSQL since this is the usual behavior of tracing libraries.
However, this created a lot potential issues:
- Protocol support and differences between trace collectors. OpenTelemetry seems to use gRPC, others are using http and those will require additional libraries (plus gRPC support in C doesn't look good) and any change in protobuf definition would require updating the extension.
- Do we send the spans within the query hooks? This means that we could block the process if the trace collector is slow to answer or we can’t connect. Sending spans from a background process sounded rather complex and resource heavy.
Moving to a pull model fixed those issues and felt more natural as this is the way PostgreSQL exposes its metrics.
Nikita,
> This patch looks very interesting, I'm working on the same subject too. But I've used
> another approach - I'm using C wrapper for C++ API library from OpenTelemetry, and
> handle span storage and output to this library. There are some nuances though, but it
> is possible. Have you tried to use OpenTelemetry APIs instead of implementing all
> functionality around spans?
I don't think that PostgreSQL accepts such kind of C++ code, not to
mention the fact that the PostgreSQL license is not necessarily
compatible with Apache 2.0 (I'm not a lawyer; this is not a legal
advice). Such a design decision will probably require using separate
compile flags since the user doesn't necessarily have a corresponding
dependency installed. Similarly to how we do with LLVM, OpenSSL, etc.
So -1 to the OpenTelemetry C++ library and +1 to the properly licensed
C implementation without 3rd party dependencies from me. Especially
considering the fact that the implementation seems to be rather
simple.
--
Best regards,
Aleksander Alekseev
2023-07-27 13:41:52.404 MSK [14126] FATAL: could not load library "/usr/local/pgsql/lib/pg_tracing.so": /usr/local/pgsql/lib/pg_tracing.so: undefined symbol: get_operation_name
Вложения
Hi,

> Also FYI, there are build warnings because functions
> const char * get_span_name(const Span * span, const char *qbuffer)
> and
> const char * get_operation_name(const Span * span, const char *qbuffer)
> do not have default inside switch and no return outside of switch.

You are right, there are a few warnings:

```
[1566/1887] Compiling C object contrib/pg_tracing/pg_tracing.so.p/span.c.o
../contrib/pg_tracing/span.c: In function ‘get_span_name’:
../contrib/pg_tracing/span.c:210:1: warning: control reaches end of
non-void function [-Wreturn-type]
  210 | }
      | ^
../contrib/pg_tracing/span.c: In function ‘get_operation_name’:
../contrib/pg_tracing/span.c:249:1: warning: control reaches end of
non-void function [-Wreturn-type]
  249 | }
      | ^
```

Here is the patch v2 with a quick fix.

> but got errors calling make check and cannot install the extension

Agree, something goes wrong when using Autotools (but not Meson) on
both Linux and MacOS. I didn't investigate the issue though.

--
Best regards,
Aleksander Alekseev
Вложения
Hi,
> Also FYI, there are build warnings because functions
> const char * get_span_name(const Span * span, const char *qbuffer)
> and
> const char * get_operation_name(const Span * span, const char *qbuffer)
> do not have default inside switch and no return outside of switch.
You are right, there are a few warnings:
```
[1566/1887] Compiling C object contrib/pg_tracing/pg_tracing.so.p/span.c.o
../contrib/pg_tracing/span.c: In function ‘get_span_name’:
../contrib/pg_tracing/span.c:210:1: warning: control reaches end of
non-void function [-Wreturn-type]
210 | }
| ^
../contrib/pg_tracing/span.c: In function ‘get_operation_name’:
../contrib/pg_tracing/span.c:249:1: warning: control reaches end of
non-void function [-Wreturn-type]
249 | }
| ^
```
Here is the patch v2 with a quick fix.
> but got errors calling make check and cannot install the extension
Agree, something goes wrong when using Autotools (but not Meson) on
both Linux and MacOS. I didn't investigate the issue though.
--
Best regards,
Aleksander Alekseev
Вложения
I was only using meson and forgot to keep Automake files up to date when I've split pg_tracing.c in multiple files (span.c, explain.c...).
Hi,I've fixed the Autotools build, please check patch below (v2).On Thu, Jul 27, 2023 at 6:39 PM Aleksander Alekseev <aleksander@timescale.com> wrote:Hi,
> Also FYI, there are build warnings because functions
> const char * get_span_name(const Span * span, const char *qbuffer)
> and
> const char * get_operation_name(const Span * span, const char *qbuffer)
> do not have default inside switch and no return outside of switch.
You are right, there are a few warnings:
```
[1566/1887] Compiling C object contrib/pg_tracing/pg_tracing.so.p/span.c.o
../contrib/pg_tracing/span.c: In function ‘get_span_name’:
../contrib/pg_tracing/span.c:210:1: warning: control reaches end of
non-void function [-Wreturn-type]
210 | }
| ^
../contrib/pg_tracing/span.c: In function ‘get_operation_name’:
../contrib/pg_tracing/span.c:249:1: warning: control reaches end of
non-void function [-Wreturn-type]
249 | }
| ^
```
Here is the patch v2 with a quick fix.
> but got errors calling make check and cannot install the extension
Agree, something goes wrong when using Autotools (but not Meson) on
both Linux and MacOS. I didn't investigate the issue though.
--
Best regards,
Aleksander Alekseev--
Hi,I'd keep Autotools build up to date, because Meson is very limited in terms of not veryup-to-date OS versions. Anyway, it's OK now. I'm currently playing with the patch andreviewing sources, if you need any cooperation - please let us know. I'm +1 for committingthis patch after review.--
Hi!What do you think about using INSTR_TIME_SET_CURRENT, INSTR_TIME_SUBTRACT and INSTR_TIME_GET_MILLISECmacros for timing calculations?Also, have you thought about a way to trace existing (running) queries without directly instrumenting them? It wouldbe much more usable for maintenance and support personnel, because in production environments you rarely couldchange query text directly. For the current state the most simple solution is switch tracing on and off by calling SQLfunction, and possibly switch tracing for prepared statement the same way, but not for any random query.I'll check the patch for the race conditions.--
> What do you think about using INSTR_TIME_SET_CURRENT, INSTR_TIME_SUBTRACT and INSTR_TIME_GET_MILLISEC> macros for timing calculations?If you're talking of the two instances where I'm modifying the instr_time's ticks, it's because I can't use the macros there.The first case is for the parse span. I only have the start timestamp using GetCurrentStatementStartTimestamp and don'thave access to the start instr_time so I need to build the duration from 2 timestamps.The second case is when building node spans from the planstate. I directly have the duration from Instrumentation.I guess one fix would be to use an int64 for the span duration to directly store nanoseconds instead of an instr_timebut I do use the instrumentation macros outside of those two cases to get the duration of other spans.> Also, have you thought about a way to trace existing (running) queries without directly instrumenting them?That's a good point. I was focusing on leaving the sampling decision to the caller through the sampled flag andonly recently added the pg_tracing_sample_rate parameter to give more control. It should be straightforward toadd an option to create standalone traces based on sample rate alone. This way, setting the sample rate to 1would force the queries running in the session to be traced.On Fri, Jul 28, 2023 at 3:02 PM Nikita Malakhov <hukutoc@gmail.com> wrote:Hi!What do you think about using INSTR_TIME_SET_CURRENT, INSTR_TIME_SUBTRACT and INSTR_TIME_GET_MILLISECmacros for timing calculations?Also, have you thought about a way to trace existing (running) queries without directly instrumenting them? It wouldbe much more usable for maintenance and support personnel, because in production environments you rarely couldchange query text directly. For the current state the most simple solution is switch tracing on and off by calling SQLfunction, and possibly switch tracing for prepared statement the same way, but not for any random query.I'll check the patch for the race conditions.--
Вложения
Вложения
BEGIN;
Hi!Please check some suggested improvements -1) query_id added so span to be able to join it with pg_stat_activity and pg_stat_statements;2) table for storing spans added, to flush spans buffer, for maintenance reasons - to keep track of spans,with SQL function that flushes buffer into table instead of recordset;3) added setter function for sampling_rate GUC to tweak it on-the-fly without restart.--
Вложения
>BEGIN;
StartTime := clock_timestamp();
insert into t2 values (i, a_data);
EndTime := clock_timestamp();
Delta := 1000 * ( extract(epoch from EndTime) - extract(epoch from StartTime) );
end loop;
psql:/home/postgres/tests/trace.sql:52: NOTICE: pg_tracing_planner_hook <1>
psql:/home/postgres/tests/trace.sql:52: NOTICE: pg_tracing_post_parse_analyze hook <2>
psql:/home/postgres/tests/trace.sql:52: NOTICE: pg_tracing_planner_hook <2>
psql:/home/postgres/tests/trace.sql:52: NOTICE: pg_tracing_post_parse_analyze hook <StartTime := clock_timestamp()>
psql:/home/postgres/tests/trace.sql:52: NOTICE: pg_tracing_planner_hook <StartTime := clock_timestamp()>
psql:/home/postgres/tests/trace.sql:52: NOTICE: pg_tracing_post_parse_analyze hook <insert into t2 values (i, a_data)>
psql:/home/postgres/tests/trace.sql:52: NOTICE: pg_tracing_planner_hook <insert into t2 values (i, a_data)>
psql:/home/postgres/tests/trace.sql:52: NOTICE: pg_tracing_ExecutorStart <insert into t2 values (i, a_data)>
psql:/home/postgres/tests/trace.sql:52: NOTICE: pg_tracing_ExecutorRun <insert into t2 values (i, a_data)>
psql:/home/postgres/tests/trace.sql:52: NOTICE: pg_tracing_ExecutorFinish <insert into t2 values (i, a_data)>
psql:/home/postgres/tests/trace.sql:52: NOTICE: pg_tracing_ExecutorEnd <insert into t2 values (i, a_data)>
psql:/home/postgres/tests/trace.sql:52: NOTICE: pg_tracing_post_parse_analyze hook <EndTime := clock_timestamp()>
psql:/home/postgres/tests/trace.sql:52: NOTICE: pg_tracing_planner_hook <EndTime := clock_timestamp()>
psql:/home/postgres/tests/trace.sql:52: NOTICE: pg_tracing_post_parse_analyze hook <Delta := 1000 * ( extract(epoch from EndTime) - extract(epoch from StartTime) )>
psql:/home/postgres/tests/trace.sql:52: NOTICE: pg_tracing_planner_hook <Delta := 1000 * ( extract(epoch from EndTime) - extract(epoch from StartTime) )>
psql:/home/postgres/tests/trace.sql:52: NOTICE: pg_tracing_planner_hook <insert into t2 values (i, a_data)>
psql:/home/postgres/tests/trace.sql:52: NOTICE: pg_tracing_ExecutorStart <insert into t2 values (i, a_data)>
psql:/home/postgres/tests/trace.sql:52: NOTICE: pg_tracing_ExecutorRun <insert into t2 values (i, a_data)>
psql:/home/postgres/tests/trace.sql:52: NOTICE: pg_tracing_ExecutorFinish <insert into t2 values (i, a_data)>
psql:/home/postgres/tests/trace.sql:52: NOTICE: pg_tracing_ExecutorEnd <insert into t2 values (i, a_data)>
Hi!

> Storing spans is a tricky question. Monitoring systems often use pull model and use probes or SQL
> API for pulling data, so from this point of view it is much more convenient to keep spans in separate
> table. But in this case we come to another issue - how to flush this data into the table? Automatic
> flushing on a full buffer would randomly (to the user) significantly affect query performance. I'd rather
> make a GUC turned off by default to store spans into the table instead of buffer.

My main issue with having the extension flush spans in a table is that
it will only work on primaries.
Replicas won't be able to do this as they can't write data on tables
and having this flush function is likely going to introduce more
confusion if it only works on primaries.

From my point of view, processing the spans should be done by an
external application.Similar to my initial example which forward spans
to a trace collector
(https://gist.github.com/bonnefoa/6ed24520bdac026d6a6a6992d308bd50#file-main-go),
this application could instead store spans in a dedicated table. This
way, the creation of the table is outside pg_tracing's scope and the
span_store application will be able to store spans on replicas and
primaries.
How frequently this application should pull data to avoid full buffer
and dropping spans is a tricky part. We have stats so we can monitor
if drops are happening and adjust the spans buffer size or increase
the application's pull frequency. Another possibility (though I'm not
familiar with that) could be to use notifications. The application
will listen to a channel and pg_tracing will notify when a
configurable threshold is reached (i.e.: if the buffer reaches 50%,
send a notification).

> I've checked this behavior before and haven't noticed the case you mentioned, but for
> loops like
>         for i in 1..2 loop
>                 StartTime := clock_timestamp();
>         insert into t2 values (i, a_data);
>         EndTime := clock_timestamp();
>         Delta := 1000 * ( extract(epoch from EndTime) - extract(epoch from StartTime) );
>         end loop;

Was this run through psql? In this case, you would be using simple
protocol which always drops the portal at the end of the statement and
is not triggering the issue.

With extended protocol and a multi statement transactions, I have the
following backtrace:
* frame #0: 0x0000000104581318
postgres`ExecutorEnd(queryDesc=0x00000001420083b0) at execMain.c:471:6
  frame #1: 0x00000001044e1644
postgres`PortalCleanup(portal=0x0000000152031d00) at
portalcmds.c:299:4
  frame #2: 0x0000000104b0e77c
postgres`PortalDrop(portal=0x0000000152031d00, isTopCommit=false) at
portalmem.c:503:3
  frame #3: 0x0000000104b0e3e8 postgres`CreatePortal(name="",
allowDup=true, dupSilent=true) at portalmem.c:194:3
  frame #4: 0x000000010487a308
postgres`exec_bind_message(input_message=0x000000016bb4b398) at
postgres.c:1745:12
  frame #5: 0x000000010487846c
postgres`PostgresMain(dbname="postgres", username="postgres") at
postgres.c:4685:5
  frame #6: 0x0000000104773144
postgres`BackendRun(port=0x0000000141704080) at postmaster.c:4433:2
  frame #7: 0x000000010477044c
postgres`BackendStartup(port=0x0000000141704080) at
postmaster.c:4161:3
  frame #8: 0x000000010476d6fc postgres`ServerLoop at postmaster.c:1778:6
  frame #9: 0x000000010476c260 postgres`PostmasterMain(argc=3,
argv=0x0000600001cf72c0) at postmaster.c:1462:11
  frame #10: 0x0000000104625ca8 postgres`main(argc=3,
argv=0x0000600001cf72c0) at main.c:198:3
  frame #11: 0x00000001a61dbf28 dyld`start + 2236

At this point, the new statement is already parsed and it's only
during the bind that the previous' statement portal is dropped and
ExecutorEnd is called. Thus, we have overlapping statements which are
tricky to handle.

On my side, I've made the following changes:
Skip nodes that are not executed
Fix query_id propagation, it should now be associated with all the
spans of a query when available
I've forgotten to add the spans buffer in the shmem hook so it would
crash when pg_tracing.max_span was too high. Now it's fixed and we can
request more than 2000 spans. Currently, the size of Span is 320 bytes
so 50000 will take ~15MB of memory.
I've added the subplan/init plan spans and started experimenting
deparsing the plan to add more details on the nodes. Instead of
'NestedLoop', we will have something 'NestedLoop|Join Filter : (oid =
relnamespace)'. One consequence is that it will create a high number
of different operations which is something we want to avoid with trace
collectors. I'm probably gonna move this outside the operation name or
find a way to make this more stable.

I've started initial benchmarks and profiling. On a default
installation and running a default `pgbench -T15`, I have the
following:
Without pg_tracing: tps = 953.118759 (without initial connection time)
With pg_tracing: tps = 652.953858 (without initial connection time)
Most of the time is spent process_query_desc. I haven't tried to
optimize performances yet so there's probably a lot of room for
improvement.


On Mon, Aug 14, 2023 at 11:17 AM Nikita Malakhov <hukutoc@gmail.com> wrote:
>
> Hi!
>
> Storing spans is a tricky question. Monitoring systems often use pull model and use probes or SQL
> API for pulling data, so from this point of view it is much more convenient to keep spans in separate
> table. But in this case we come to another issue - how to flush this data into the table? Automatic
> flushing on a full buffer would randomly (to the user) significantly affect query performance. I'd rather
> make a GUC turned off by default to store spans into the table instead of buffer.
>
> >3) I'm testing more complex queries. Most of my previous tests were using simple query protocol but extended
protocolintroduces
> >differences that break some assumptions I did. For example, with multi statement transaction like
> >BEGIN;
> >SELECT 1;
> >SELECT 2;
> >The parse of SELECT 2 will happen before the ExecutorEnd (and the end_tracing) of SELECT 1. For now, I'm skipping
thepost parse
> >hook if we still have an ongoing tracing.
>
> I've checked this behavior before and haven't noticed the case you mentioned, but for
> loops like
>         for i in 1..2 loop
>                 StartTime := clock_timestamp();
>         insert into t2 values (i, a_data);
>         EndTime := clock_timestamp();
>         Delta := 1000 * ( extract(epoch from EndTime) - extract(epoch from StartTime) );
>         end loop;
>
> I've got the following call sequence:
> psql:/home/postgres/tests/trace.sql:52: NOTICE:  pg_tracing_post_parse_analyze hook <1>
> psql:/home/postgres/tests/trace.sql:52: NOTICE:  pg_tracing_planner_hook <1>
> psql:/home/postgres/tests/trace.sql:52: NOTICE:  pg_tracing_post_parse_analyze hook <2>
> psql:/home/postgres/tests/trace.sql:52: NOTICE:  pg_tracing_planner_hook <2>
> psql:/home/postgres/tests/trace.sql:52: NOTICE:  pg_tracing_post_parse_analyze hook <StartTime := clock_timestamp()>
> psql:/home/postgres/tests/trace.sql:52: NOTICE:  pg_tracing_planner_hook <StartTime := clock_timestamp()>
> psql:/home/postgres/tests/trace.sql:52: NOTICE:  pg_tracing_post_parse_analyze hook <insert into t2 values (i,
a_data)>
> psql:/home/postgres/tests/trace.sql:52: NOTICE:  pg_tracing_planner_hook <insert into t2 values (i, a_data)>
> psql:/home/postgres/tests/trace.sql:52: NOTICE:  pg_tracing_ExecutorStart <insert into t2 values (i, a_data)>
> psql:/home/postgres/tests/trace.sql:52: NOTICE:  pg_tracing_ExecutorRun  <insert into t2 values (i, a_data)>
> psql:/home/postgres/tests/trace.sql:52: NOTICE:  pg_tracing_ExecutorFinish <insert into t2 values (i, a_data)>
> psql:/home/postgres/tests/trace.sql:52: NOTICE:  pg_tracing_ExecutorEnd <insert into t2 values (i, a_data)>
> psql:/home/postgres/tests/trace.sql:52: NOTICE:  pg_tracing_post_parse_analyze hook <EndTime := clock_timestamp()>
> psql:/home/postgres/tests/trace.sql:52: NOTICE:  pg_tracing_planner_hook <EndTime := clock_timestamp()>
> psql:/home/postgres/tests/trace.sql:52: NOTICE:  pg_tracing_post_parse_analyze hook <Delta := 1000 * ( extract(epoch
fromEndTime) - extract(epoch from StartTime) )>
> psql:/home/postgres/tests/trace.sql:52: NOTICE:  pg_tracing_planner_hook <Delta := 1000 * ( extract(epoch from
EndTime)- extract(epoch from StartTime) )>
> psql:/home/postgres/tests/trace.sql:52: NOTICE:  pg_tracing_planner_hook <insert into t2 values (i, a_data)>
> psql:/home/postgres/tests/trace.sql:52: NOTICE:  pg_tracing_ExecutorStart <insert into t2 values (i, a_data)>
> psql:/home/postgres/tests/trace.sql:52: NOTICE:  pg_tracing_ExecutorRun  <insert into t2 values (i, a_data)>
> psql:/home/postgres/tests/trace.sql:52: NOTICE:  pg_tracing_ExecutorFinish <insert into t2 values (i, a_data)>
> psql:/home/postgres/tests/trace.sql:52: NOTICE:  pg_tracing_ExecutorEnd <insert into t2 values (i, a_data)>
>
> --
> Regards,
> Nikita Malakhov
> Postgres Professional
> The Russian Postgres Company
> https://postgrespro.ru/
Вложения
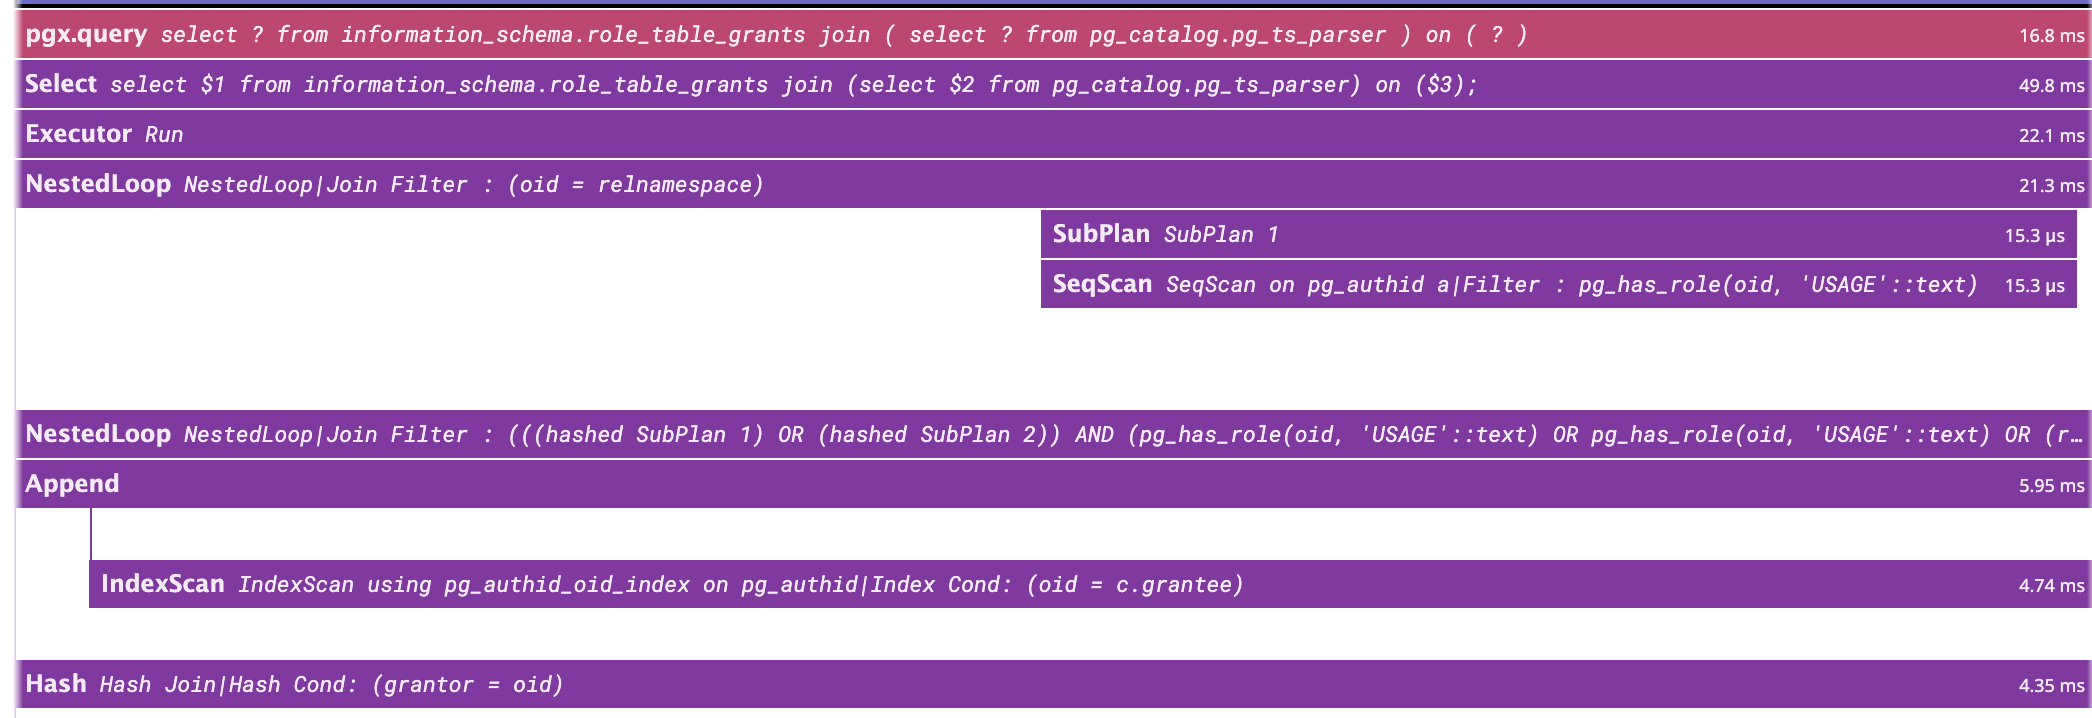
And the latest version of the patch that I've forgotten in the previous message.

On Wed, Aug 30, 2023 at 11:09 AM Anthonin Bonnefoy
<anthonin.bonnefoy@datadoghq.com> wrote:
>
> Hi!
>
> > Storing spans is a tricky question. Monitoring systems often use pull model and use probes or SQL
> > API for pulling data, so from this point of view it is much more convenient to keep spans in separate
> > table. But in this case we come to another issue - how to flush this data into the table? Automatic
> > flushing on a full buffer would randomly (to the user) significantly affect query performance. I'd rather
> > make a GUC turned off by default to store spans into the table instead of buffer.
>
> My main issue with having the extension flush spans in a table is that
> it will only work on primaries.
> Replicas won't be able to do this as they can't write data on tables
> and having this flush function is likely going to introduce more
> confusion if it only works on primaries.
>
> From my point of view, processing the spans should be done by an
> external application.Similar to my initial example which forward spans
> to a trace collector
> (https://gist.github.com/bonnefoa/6ed24520bdac026d6a6a6992d308bd50#file-main-go),
> this application could instead store spans in a dedicated table. This
> way, the creation of the table is outside pg_tracing's scope and the
> span_store application will be able to store spans on replicas and
> primaries.
> How frequently this application should pull data to avoid full buffer
> and dropping spans is a tricky part. We have stats so we can monitor
> if drops are happening and adjust the spans buffer size or increase
> the application's pull frequency. Another possibility (though I'm not
> familiar with that) could be to use notifications. The application
> will listen to a channel and pg_tracing will notify when a
> configurable threshold is reached (i.e.: if the buffer reaches 50%,
> send a notification).
>
> > I've checked this behavior before and haven't noticed the case you mentioned, but for
> > loops like
> >         for i in 1..2 loop
> >                 StartTime := clock_timestamp();
> >         insert into t2 values (i, a_data);
> >         EndTime := clock_timestamp();
> >         Delta := 1000 * ( extract(epoch from EndTime) - extract(epoch from StartTime) );
> >         end loop;
>
> Was this run through psql? In this case, you would be using simple
> protocol which always drops the portal at the end of the statement and
> is not triggering the issue.
>
> With extended protocol and a multi statement transactions, I have the
> following backtrace:
> * frame #0: 0x0000000104581318
> postgres`ExecutorEnd(queryDesc=0x00000001420083b0) at execMain.c:471:6
>   frame #1: 0x00000001044e1644
> postgres`PortalCleanup(portal=0x0000000152031d00) at
> portalcmds.c:299:4
>   frame #2: 0x0000000104b0e77c
> postgres`PortalDrop(portal=0x0000000152031d00, isTopCommit=false) at
> portalmem.c:503:3
>   frame #3: 0x0000000104b0e3e8 postgres`CreatePortal(name="",
> allowDup=true, dupSilent=true) at portalmem.c:194:3
>   frame #4: 0x000000010487a308
> postgres`exec_bind_message(input_message=0x000000016bb4b398) at
> postgres.c:1745:12
>   frame #5: 0x000000010487846c
> postgres`PostgresMain(dbname="postgres", username="postgres") at
> postgres.c:4685:5
>   frame #6: 0x0000000104773144
> postgres`BackendRun(port=0x0000000141704080) at postmaster.c:4433:2
>   frame #7: 0x000000010477044c
> postgres`BackendStartup(port=0x0000000141704080) at
> postmaster.c:4161:3
>   frame #8: 0x000000010476d6fc postgres`ServerLoop at postmaster.c:1778:6
>   frame #9: 0x000000010476c260 postgres`PostmasterMain(argc=3,
> argv=0x0000600001cf72c0) at postmaster.c:1462:11
>   frame #10: 0x0000000104625ca8 postgres`main(argc=3,
> argv=0x0000600001cf72c0) at main.c:198:3
>   frame #11: 0x00000001a61dbf28 dyld`start + 2236
>
> At this point, the new statement is already parsed and it's only
> during the bind that the previous' statement portal is dropped and
> ExecutorEnd is called. Thus, we have overlapping statements which are
> tricky to handle.
>
> On my side, I've made the following changes:
> Skip nodes that are not executed
> Fix query_id propagation, it should now be associated with all the
> spans of a query when available
> I've forgotten to add the spans buffer in the shmem hook so it would
> crash when pg_tracing.max_span was too high. Now it's fixed and we can
> request more than 2000 spans. Currently, the size of Span is 320 bytes
> so 50000 will take ~15MB of memory.
> I've added the subplan/init plan spans and started experimenting
> deparsing the plan to add more details on the nodes. Instead of
> 'NestedLoop', we will have something 'NestedLoop|Join Filter : (oid =
> relnamespace)'. One consequence is that it will create a high number
> of different operations which is something we want to avoid with trace
> collectors. I'm probably gonna move this outside the operation name or
> find a way to make this more stable.
>
> I've started initial benchmarks and profiling. On a default
> installation and running a default `pgbench -T15`, I have the
> following:
> Without pg_tracing: tps = 953.118759 (without initial connection time)
> With pg_tracing: tps = 652.953858 (without initial connection time)
> Most of the time is spent process_query_desc. I haven't tried to
> optimize performances yet so there's probably a lot of room for
> improvement.
>
>
> On Mon, Aug 14, 2023 at 11:17 AM Nikita Malakhov <hukutoc@gmail.com> wrote:
> >
> > Hi!
> >
> > Storing spans is a tricky question. Monitoring systems often use pull model and use probes or SQL
> > API for pulling data, so from this point of view it is much more convenient to keep spans in separate
> > table. But in this case we come to another issue - how to flush this data into the table? Automatic
> > flushing on a full buffer would randomly (to the user) significantly affect query performance. I'd rather
> > make a GUC turned off by default to store spans into the table instead of buffer.
> >
> > >3) I'm testing more complex queries. Most of my previous tests were using simple query protocol but extended
protocolintroduces
> > >differences that break some assumptions I did. For example, with multi statement transaction like
> > >BEGIN;
> > >SELECT 1;
> > >SELECT 2;
> > >The parse of SELECT 2 will happen before the ExecutorEnd (and the end_tracing) of SELECT 1. For now, I'm skipping
thepost parse
> > >hook if we still have an ongoing tracing.
> >
> > I've checked this behavior before and haven't noticed the case you mentioned, but for
> > loops like
> >         for i in 1..2 loop
> >                 StartTime := clock_timestamp();
> >         insert into t2 values (i, a_data);
> >         EndTime := clock_timestamp();
> >         Delta := 1000 * ( extract(epoch from EndTime) - extract(epoch from StartTime) );
> >         end loop;
> >
> > I've got the following call sequence:
> > psql:/home/postgres/tests/trace.sql:52: NOTICE:  pg_tracing_post_parse_analyze hook <1>
> > psql:/home/postgres/tests/trace.sql:52: NOTICE:  pg_tracing_planner_hook <1>
> > psql:/home/postgres/tests/trace.sql:52: NOTICE:  pg_tracing_post_parse_analyze hook <2>
> > psql:/home/postgres/tests/trace.sql:52: NOTICE:  pg_tracing_planner_hook <2>
> > psql:/home/postgres/tests/trace.sql:52: NOTICE:  pg_tracing_post_parse_analyze hook <StartTime :=
clock_timestamp()>
> > psql:/home/postgres/tests/trace.sql:52: NOTICE:  pg_tracing_planner_hook <StartTime := clock_timestamp()>
> > psql:/home/postgres/tests/trace.sql:52: NOTICE:  pg_tracing_post_parse_analyze hook <insert into t2 values (i,
a_data)>
> > psql:/home/postgres/tests/trace.sql:52: NOTICE:  pg_tracing_planner_hook <insert into t2 values (i, a_data)>
> > psql:/home/postgres/tests/trace.sql:52: NOTICE:  pg_tracing_ExecutorStart <insert into t2 values (i, a_data)>
> > psql:/home/postgres/tests/trace.sql:52: NOTICE:  pg_tracing_ExecutorRun  <insert into t2 values (i, a_data)>
> > psql:/home/postgres/tests/trace.sql:52: NOTICE:  pg_tracing_ExecutorFinish <insert into t2 values (i, a_data)>
> > psql:/home/postgres/tests/trace.sql:52: NOTICE:  pg_tracing_ExecutorEnd <insert into t2 values (i, a_data)>
> > psql:/home/postgres/tests/trace.sql:52: NOTICE:  pg_tracing_post_parse_analyze hook <EndTime := clock_timestamp()>
> > psql:/home/postgres/tests/trace.sql:52: NOTICE:  pg_tracing_planner_hook <EndTime := clock_timestamp()>
> > psql:/home/postgres/tests/trace.sql:52: NOTICE:  pg_tracing_post_parse_analyze hook <Delta := 1000 * (
extract(epochfrom EndTime) - extract(epoch from StartTime) )>
> > psql:/home/postgres/tests/trace.sql:52: NOTICE:  pg_tracing_planner_hook <Delta := 1000 * ( extract(epoch from
EndTime)- extract(epoch from StartTime) )>
> > psql:/home/postgres/tests/trace.sql:52: NOTICE:  pg_tracing_planner_hook <insert into t2 values (i, a_data)>
> > psql:/home/postgres/tests/trace.sql:52: NOTICE:  pg_tracing_ExecutorStart <insert into t2 values (i, a_data)>
> > psql:/home/postgres/tests/trace.sql:52: NOTICE:  pg_tracing_ExecutorRun  <insert into t2 values (i, a_data)>
> > psql:/home/postgres/tests/trace.sql:52: NOTICE:  pg_tracing_ExecutorFinish <insert into t2 values (i, a_data)>
> > psql:/home/postgres/tests/trace.sql:52: NOTICE:  pg_tracing_ExecutorEnd <insert into t2 values (i, a_data)>
> >
> > --
> > Regards,
> > Nikita Malakhov
> > Postgres Professional
> > The Russian Postgres Company
> > https://postgrespro.ru/
Вложения
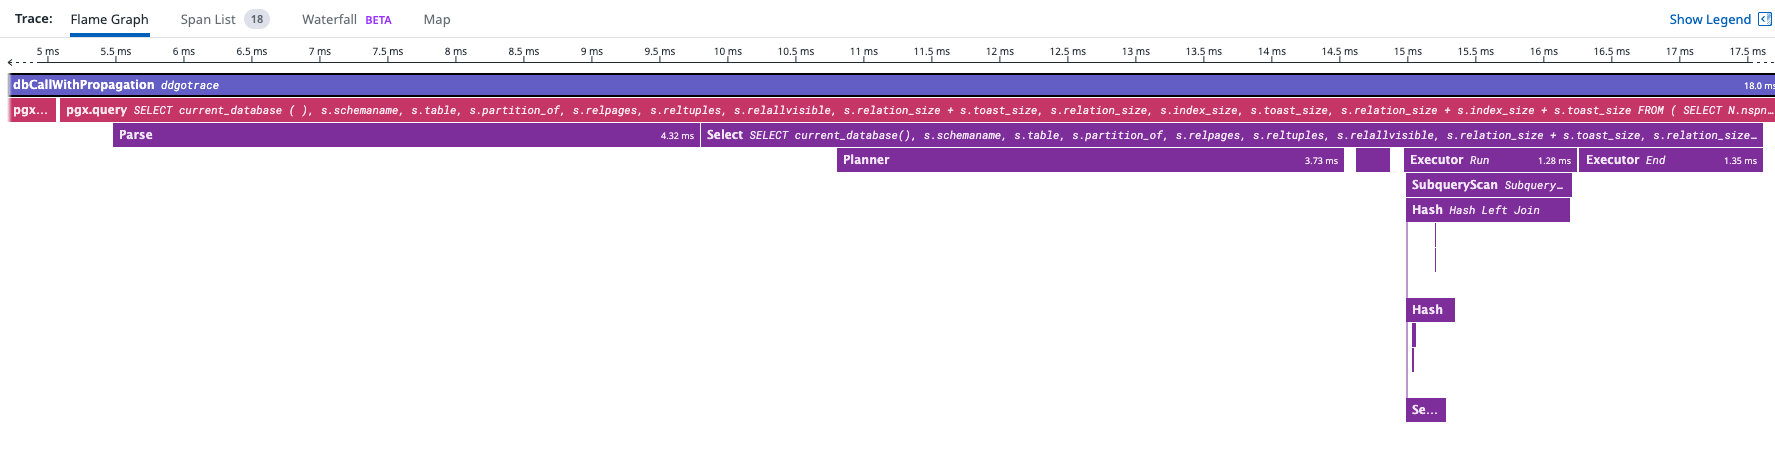
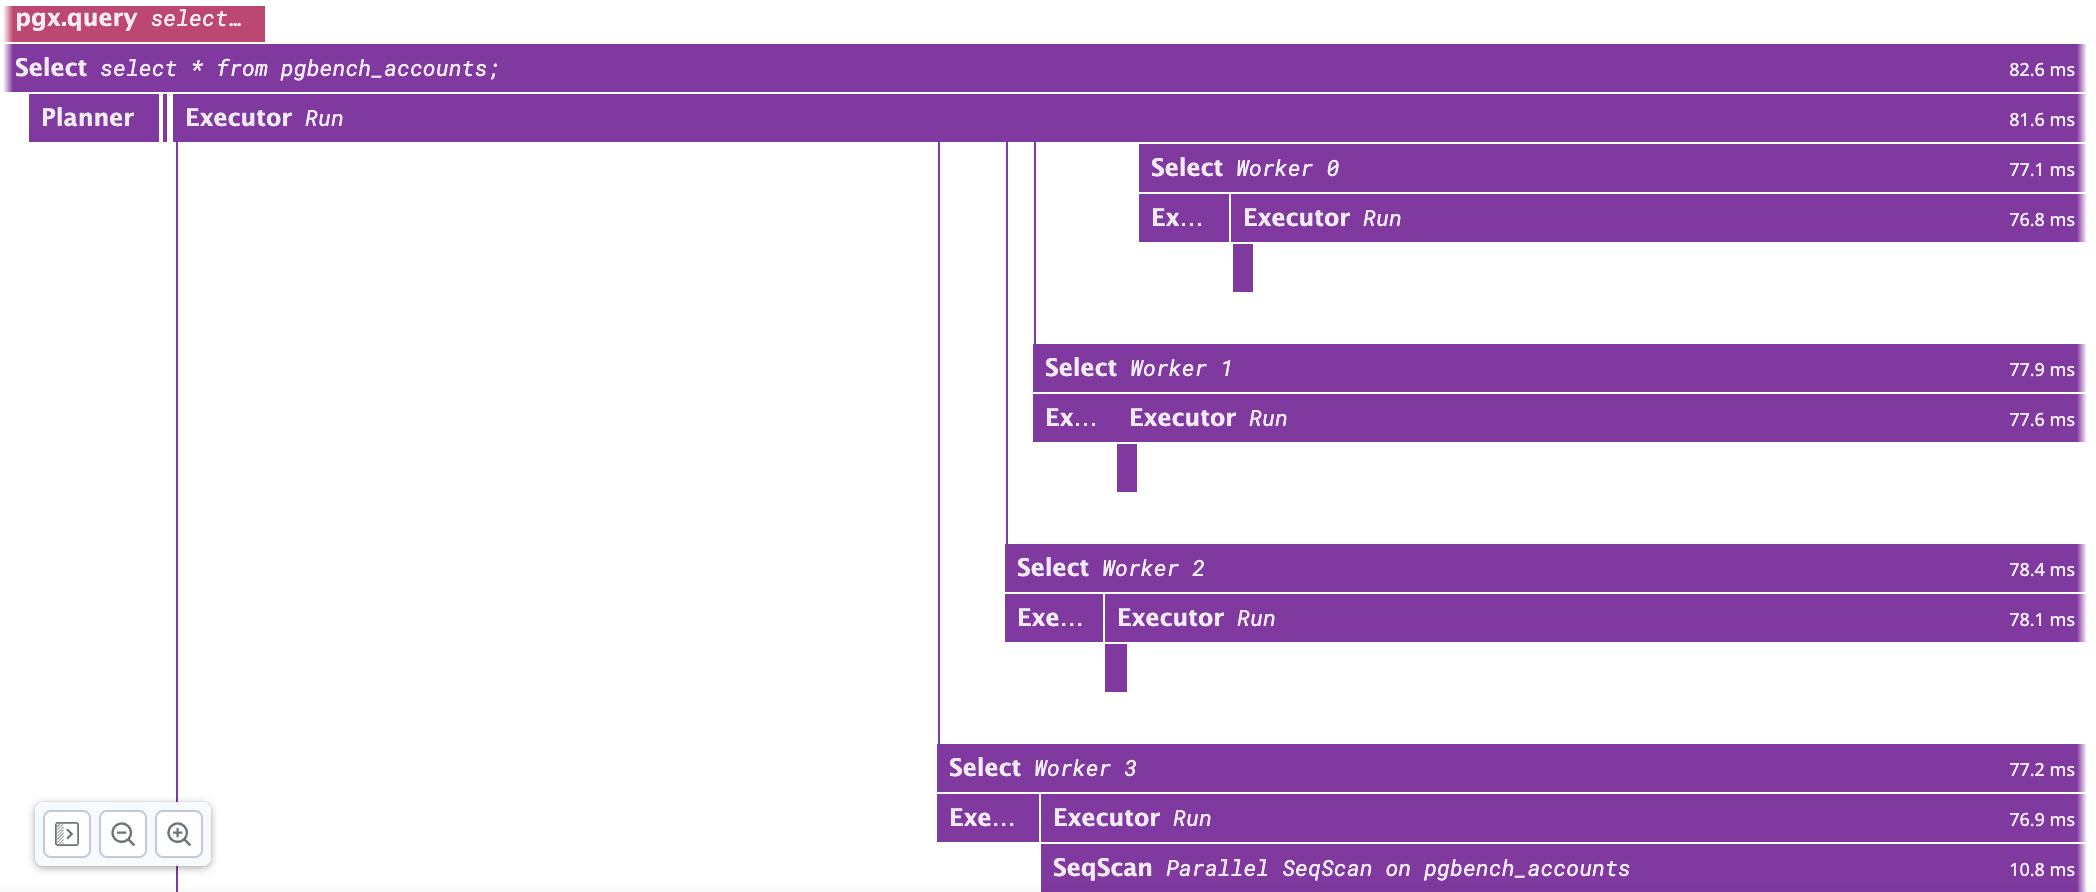
Hi!

I've been working on performance improvements and features.
Performance improvements:
- I was calling select_rtable_names_for_explain on every
ExplainTargetRel which was rather costly and unnecessary. It's now
only done once.
- File writes are now batched and only a single file write is done at
the end of tracing.

With those improvements, pgbench now yields the following results:
0% tracing:
pgbench -T60 "options=-cpg_tracing.sample_rate=0"
number of transactions actually processed: 57293
tps = 954.915403 (without initial connection time)

100% tracing:
pgbench -T60 "options=-cpg_tracing.sample_rate=1"
number of transactions actually processed: 45963
tps = 766.068564 (without initial connection time)

I’ve also added tracing of parallel workers. If a query needs parallel
workers, the trace context is pushed in a specific shared buffer so
workers can pull trace context and generate spans with the correct
traceId and parentId. We are now able to see the start, run and finish
of workers (see image).
I'm currently focusing on adding more tests, comments, fixing TODOs
and known bugs.

Regards,
Anthonin

On Wed, Aug 30, 2023 at 11:15 AM Anthonin Bonnefoy
<anthonin.bonnefoy@datadoghq.com> wrote:
>
> And the latest version of the patch that I've forgotten in the previous message.
>
> On Wed, Aug 30, 2023 at 11:09 AM Anthonin Bonnefoy
> <anthonin.bonnefoy@datadoghq.com> wrote:
> >
> > Hi!
> >
> > > Storing spans is a tricky question. Monitoring systems often use pull model and use probes or SQL
> > > API for pulling data, so from this point of view it is much more convenient to keep spans in separate
> > > table. But in this case we come to another issue - how to flush this data into the table? Automatic
> > > flushing on a full buffer would randomly (to the user) significantly affect query performance. I'd rather
> > > make a GUC turned off by default to store spans into the table instead of buffer.
> >
> > My main issue with having the extension flush spans in a table is that
> > it will only work on primaries.
> > Replicas won't be able to do this as they can't write data on tables
> > and having this flush function is likely going to introduce more
> > confusion if it only works on primaries.
> >
> > From my point of view, processing the spans should be done by an
> > external application.Similar to my initial example which forward spans
> > to a trace collector
> > (https://gist.github.com/bonnefoa/6ed24520bdac026d6a6a6992d308bd50#file-main-go),
> > this application could instead store spans in a dedicated table. This
> > way, the creation of the table is outside pg_tracing's scope and the
> > span_store application will be able to store spans on replicas and
> > primaries.
> > How frequently this application should pull data to avoid full buffer
> > and dropping spans is a tricky part. We have stats so we can monitor
> > if drops are happening and adjust the spans buffer size or increase
> > the application's pull frequency. Another possibility (though I'm not
> > familiar with that) could be to use notifications. The application
> > will listen to a channel and pg_tracing will notify when a
> > configurable threshold is reached (i.e.: if the buffer reaches 50%,
> > send a notification).
> >
> > > I've checked this behavior before and haven't noticed the case you mentioned, but for
> > > loops like
> > >         for i in 1..2 loop
> > >                 StartTime := clock_timestamp();
> > >         insert into t2 values (i, a_data);
> > >         EndTime := clock_timestamp();
> > >         Delta := 1000 * ( extract(epoch from EndTime) - extract(epoch from StartTime) );
> > >         end loop;
> >
> > Was this run through psql? In this case, you would be using simple
> > protocol which always drops the portal at the end of the statement and
> > is not triggering the issue.
> >
> > With extended protocol and a multi statement transactions, I have the
> > following backtrace:
> > * frame #0: 0x0000000104581318
> > postgres`ExecutorEnd(queryDesc=0x00000001420083b0) at execMain.c:471:6
> >   frame #1: 0x00000001044e1644
> > postgres`PortalCleanup(portal=0x0000000152031d00) at
> > portalcmds.c:299:4
> >   frame #2: 0x0000000104b0e77c
> > postgres`PortalDrop(portal=0x0000000152031d00, isTopCommit=false) at
> > portalmem.c:503:3
> >   frame #3: 0x0000000104b0e3e8 postgres`CreatePortal(name="",
> > allowDup=true, dupSilent=true) at portalmem.c:194:3
> >   frame #4: 0x000000010487a308
> > postgres`exec_bind_message(input_message=0x000000016bb4b398) at
> > postgres.c:1745:12
> >   frame #5: 0x000000010487846c
> > postgres`PostgresMain(dbname="postgres", username="postgres") at
> > postgres.c:4685:5
> >   frame #6: 0x0000000104773144
> > postgres`BackendRun(port=0x0000000141704080) at postmaster.c:4433:2
> >   frame #7: 0x000000010477044c
> > postgres`BackendStartup(port=0x0000000141704080) at
> > postmaster.c:4161:3
> >   frame #8: 0x000000010476d6fc postgres`ServerLoop at postmaster.c:1778:6
> >   frame #9: 0x000000010476c260 postgres`PostmasterMain(argc=3,
> > argv=0x0000600001cf72c0) at postmaster.c:1462:11
> >   frame #10: 0x0000000104625ca8 postgres`main(argc=3,
> > argv=0x0000600001cf72c0) at main.c:198:3
> >   frame #11: 0x00000001a61dbf28 dyld`start + 2236
> >
> > At this point, the new statement is already parsed and it's only
> > during the bind that the previous' statement portal is dropped and
> > ExecutorEnd is called. Thus, we have overlapping statements which are
> > tricky to handle.
> >
> > On my side, I've made the following changes:
> > Skip nodes that are not executed
> > Fix query_id propagation, it should now be associated with all the
> > spans of a query when available
> > I've forgotten to add the spans buffer in the shmem hook so it would
> > crash when pg_tracing.max_span was too high. Now it's fixed and we can
> > request more than 2000 spans. Currently, the size of Span is 320 bytes
> > so 50000 will take ~15MB of memory.
> > I've added the subplan/init plan spans and started experimenting
> > deparsing the plan to add more details on the nodes. Instead of
> > 'NestedLoop', we will have something 'NestedLoop|Join Filter : (oid =
> > relnamespace)'. One consequence is that it will create a high number
> > of different operations which is something we want to avoid with trace
> > collectors. I'm probably gonna move this outside the operation name or
> > find a way to make this more stable.
> >
> > I've started initial benchmarks and profiling. On a default
> > installation and running a default `pgbench -T15`, I have the
> > following:
> > Without pg_tracing: tps = 953.118759 (without initial connection time)
> > With pg_tracing: tps = 652.953858 (without initial connection time)
> > Most of the time is spent process_query_desc. I haven't tried to
> > optimize performances yet so there's probably a lot of room for
> > improvement.
> >
> >
> > On Mon, Aug 14, 2023 at 11:17 AM Nikita Malakhov <hukutoc@gmail.com> wrote:
> > >
> > > Hi!
> > >
> > > Storing spans is a tricky question. Monitoring systems often use pull model and use probes or SQL
> > > API for pulling data, so from this point of view it is much more convenient to keep spans in separate
> > > table. But in this case we come to another issue - how to flush this data into the table? Automatic
> > > flushing on a full buffer would randomly (to the user) significantly affect query performance. I'd rather
> > > make a GUC turned off by default to store spans into the table instead of buffer.
> > >
> > > >3) I'm testing more complex queries. Most of my previous tests were using simple query protocol but extended
protocolintroduces
> > > >differences that break some assumptions I did. For example, with multi statement transaction like
> > > >BEGIN;
> > > >SELECT 1;
> > > >SELECT 2;
> > > >The parse of SELECT 2 will happen before the ExecutorEnd (and the end_tracing) of SELECT 1. For now, I'm
skippingthe post parse
> > > >hook if we still have an ongoing tracing.
> > >
> > > I've checked this behavior before and haven't noticed the case you mentioned, but for
> > > loops like
> > >         for i in 1..2 loop
> > >                 StartTime := clock_timestamp();
> > >         insert into t2 values (i, a_data);
> > >         EndTime := clock_timestamp();
> > >         Delta := 1000 * ( extract(epoch from EndTime) - extract(epoch from StartTime) );
> > >         end loop;
> > >
> > > I've got the following call sequence:
> > > psql:/home/postgres/tests/trace.sql:52: NOTICE:  pg_tracing_post_parse_analyze hook <1>
> > > psql:/home/postgres/tests/trace.sql:52: NOTICE:  pg_tracing_planner_hook <1>
> > > psql:/home/postgres/tests/trace.sql:52: NOTICE:  pg_tracing_post_parse_analyze hook <2>
> > > psql:/home/postgres/tests/trace.sql:52: NOTICE:  pg_tracing_planner_hook <2>
> > > psql:/home/postgres/tests/trace.sql:52: NOTICE:  pg_tracing_post_parse_analyze hook <StartTime :=
clock_timestamp()>
> > > psql:/home/postgres/tests/trace.sql:52: NOTICE:  pg_tracing_planner_hook <StartTime := clock_timestamp()>
> > > psql:/home/postgres/tests/trace.sql:52: NOTICE:  pg_tracing_post_parse_analyze hook <insert into t2 values (i,
a_data)>
> > > psql:/home/postgres/tests/trace.sql:52: NOTICE:  pg_tracing_planner_hook <insert into t2 values (i, a_data)>
> > > psql:/home/postgres/tests/trace.sql:52: NOTICE:  pg_tracing_ExecutorStart <insert into t2 values (i, a_data)>
> > > psql:/home/postgres/tests/trace.sql:52: NOTICE:  pg_tracing_ExecutorRun  <insert into t2 values (i, a_data)>
> > > psql:/home/postgres/tests/trace.sql:52: NOTICE:  pg_tracing_ExecutorFinish <insert into t2 values (i, a_data)>
> > > psql:/home/postgres/tests/trace.sql:52: NOTICE:  pg_tracing_ExecutorEnd <insert into t2 values (i, a_data)>
> > > psql:/home/postgres/tests/trace.sql:52: NOTICE:  pg_tracing_post_parse_analyze hook <EndTime :=
clock_timestamp()>
> > > psql:/home/postgres/tests/trace.sql:52: NOTICE:  pg_tracing_planner_hook <EndTime := clock_timestamp()>
> > > psql:/home/postgres/tests/trace.sql:52: NOTICE:  pg_tracing_post_parse_analyze hook <Delta := 1000 * (
extract(epochfrom EndTime) - extract(epoch from StartTime) )>
> > > psql:/home/postgres/tests/trace.sql:52: NOTICE:  pg_tracing_planner_hook <Delta := 1000 * ( extract(epoch from
EndTime)- extract(epoch from StartTime) )>
> > > psql:/home/postgres/tests/trace.sql:52: NOTICE:  pg_tracing_planner_hook <insert into t2 values (i, a_data)>
> > > psql:/home/postgres/tests/trace.sql:52: NOTICE:  pg_tracing_ExecutorStart <insert into t2 values (i, a_data)>
> > > psql:/home/postgres/tests/trace.sql:52: NOTICE:  pg_tracing_ExecutorRun  <insert into t2 values (i, a_data)>
> > > psql:/home/postgres/tests/trace.sql:52: NOTICE:  pg_tracing_ExecutorFinish <insert into t2 values (i, a_data)>
> > > psql:/home/postgres/tests/trace.sql:52: NOTICE:  pg_tracing_ExecutorEnd <insert into t2 values (i, a_data)>
> > >
> > > --
> > > Regards,
> > > Nikita Malakhov
> > > Postgres Professional
> > > The Russian Postgres Company
> > > https://postgrespro.ru/
Вложения
Hi!

Here's a new version with a good batch of changes.

Renaming/Refactoring:
- All spans are now tracked in the palloced current_trace_spans buffer
compared to top_span and parse_span being kept in a static variable
before.
- I've renamed query_spans to top_span. A top_span serves as the
parent for all spans in a specific nested level.
- More debugging information and assertions. Spans now track their
nested level, if they've been ended and if they are a top_span.

Changes:
- I've added the subxact_count to the span's metadata. This can help
identify the moment a subtransaction was started.
- I've reworked nested queries and utility statements. Previously, I
made the assumptions that we could only have one top_span per nested
level which is not the case. Some utility statements can execute
multiple queries in the same nested level. Tracing utility statement
now works better (see image of tracing a create extension).

Regards,
Anthonin
Вложения
Hi,

> Renaming/Refactoring:
> - All spans are now tracked in the palloced current_trace_spans buffer
> compared to top_span and parse_span being kept in a static variable
> before.
> - I've renamed query_spans to top_span. A top_span serves as the
> parent for all spans in a specific nested level.
> - More debugging information and assertions. Spans now track their
> nested level, if they've been ended and if they are a top_span.
>
> Changes:
> - I've added the subxact_count to the span's metadata. This can help
> identify the moment a subtransaction was started.
> - I've reworked nested queries and utility statements. Previously, I
> made the assumptions that we could only have one top_span per nested
> level which is not the case. Some utility statements can execute
> multiple queries in the same nested level. Tracing utility statement
> now works better (see image of tracing a create extension).

Many thanks for the updated patch.

If it's not too much trouble, please use `git format-patch`. This
makes applying and testing the patch much easier. Also you can provide
a commit message which 1. will simplify the work for the committer and
2. can be reviewed as well.

The tests fail on CI [1]. I tried to run them locally and got the same
results. I'm using full-build.sh from this repository [2] for
Autotools and the following one-liner for Meson:

```
time CPPFLAGS="-DENFORCE_REGRESSION_TEST_NAME_RESTRICTIONS" sh -c 'git
clean -dfx && meson setup --buildtype debug -Dcassert=true
-DPG_TEST_EXTRA="kerberos ldap ssl load_balance" -Dldap=disabled
-Dssl=openssl -Dtap_tests=enabled
-Dprefix=/home/eax/projects/pginstall build && ninja -C build && ninja
-C build docs && PG_TEST_EXTRA=1 meson test -C build'
```

The comments for pg_tracing.c don't seem to be formatted properly.
Please make sure to run pg_indent. See src/tools/pgindent/README

The interface pg_tracing_spans(true | false) doesn't strike me as
particularly readable. Maybe this function should be private and the
interface be like pg_tracing_spans() and pg_trancing_consume_spans().
Alternatively you could use named arguments in the tests, but I don't
think this is a preferred solution.

Speaking of the tests I suggest adding a bit more comments before
every (or most) of the queries. Figuring out what they test could be
not particularly straightforward for somebody who will make changes
after the patch will be accepted.

[1]: http://cfbot.cputube.org/
[2]: https://github.com/afiskon/pgscripts/

--
Best regards,
Aleksander Alekseev
Hi,
> Renaming/Refactoring:
> - All spans are now tracked in the palloced current_trace_spans buffer
> compared to top_span and parse_span being kept in a static variable
> before.
> - I've renamed query_spans to top_span. A top_span serves as the
> parent for all spans in a specific nested level.
> - More debugging information and assertions. Spans now track their
> nested level, if they've been ended and if they are a top_span.
>
> Changes:
> - I've added the subxact_count to the span's metadata. This can help
> identify the moment a subtransaction was started.
> - I've reworked nested queries and utility statements. Previously, I
> made the assumptions that we could only have one top_span per nested
> level which is not the case. Some utility statements can execute
> multiple queries in the same nested level. Tracing utility statement
> now works better (see image of tracing a create extension).
Many thanks for the updated patch.
If it's not too much trouble, please use `git format-patch`. This
makes applying and testing the patch much easier. Also you can provide
a commit message which 1. will simplify the work for the committer and
2. can be reviewed as well.
The tests fail on CI [1]. I tried to run them locally and got the same
results. I'm using full-build.sh from this repository [2] for
Autotools and the following one-liner for Meson:
```
time CPPFLAGS="-DENFORCE_REGRESSION_TEST_NAME_RESTRICTIONS" sh -c 'git
clean -dfx && meson setup --buildtype debug -Dcassert=true
-DPG_TEST_EXTRA="kerberos ldap ssl load_balance" -Dldap=disabled
-Dssl=openssl -Dtap_tests=enabled
-Dprefix=/home/eax/projects/pginstall build && ninja -C build && ninja
-C build docs && PG_TEST_EXTRA=1 meson test -C build'
```
The comments for pg_tracing.c don't seem to be formatted properly.
Please make sure to run pg_indent. See src/tools/pgindent/README
The interface pg_tracing_spans(true | false) doesn't strike me as
particularly readable. Maybe this function should be private and the
interface be like pg_tracing_spans() and pg_trancing_consume_spans().
Alternatively you could use named arguments in the tests, but I don't
think this is a preferred solution.
Speaking of the tests I suggest adding a bit more comments before
every (or most) of the queries. Figuring out what they test could be
not particularly straightforward for somebody who will make changes
after the patch will be accepted.
[1]: http://cfbot.cputube.org/
[2]: https://github.com/afiskon/pgscripts/
--
Best regards,
Aleksander Alekseev
Hi!

> If it's not too much trouble, please use `git format-patch`. This
> makes applying and testing the patch much easier. Also you can provide
> a commit message which 1. will simplify the work for the committer and
> 2. can be reviewed as well.
No problem, I will do that from now on.

> The tests fail on CI [1]. I tried to run them locally and got the same
> results.
I've fixed the compilation issue, my working laptop is a mac so I've missed the
linux errors. I've set up the CI on my side to avoid those issues in the future.
I've also fixed most of the test issues.
One test is still flaky: the parallel worker test can have one less
worker reporting
from time to time, I will try to find a way to make it more stable.

> The comments for pg_tracing.c don't seem to be formatted properly.
> Please make sure to run pg_indent. See src/tools/pgindent/README
Done.

> The interface pg_tracing_spans(true | false) doesn't strike me as
> particularly readable. Maybe this function should be private and the
> interface be like pg_tracing_spans() and pg_trancing_consume_spans().
Agree. I wasn't super happy about the format. I've created
pg_tracing_peek_spans() and pg_tracing_consume_spans() to make it
more explicit.

> Speaking of the tests I suggest adding a bit more comments before
> every (or most) of the queries. Figuring out what they test could be
> not particularly straightforward for somebody who will make changes
> after the patch will be accepted.
I've added more comments and a representation of the expected span
hierarchy for the tests involving nested queries. It helps me a lot to keep
track of the spans to check.

I've done some additional changes:
- I've added a start_ns to spans which is the nanosecond remainder of the
time since the start of the trace. Since some spans can have a very short
duration, some spans would have the same start if we use a microsecond
precision. Having a start with a nanosecond precision allowed me to remove
some hacks I was using and makes tests more stable.
- I've also added a start_ns_time to span which is the value of the monotonic
clock at the start of the span. I used to use duration_ns as a
temporary storage
for this value but it made things more confusing and hard to follow.
- Fix error handling with nested queries created with ProcessUtility (like
calling "create extension pg_tracing" twice).

Regards,
Anthonin
Вложения
Hi!

I've made a new batch of changes and improvements.
New features:
- Triggers are now correctly supported. They were not correctly
attached to the ExecutorFinish Span before.
- Additional configuration: exporting parameter values in span
metadata can be disabled. Deparsing can also be disabled now.
- Dbid and userid are now exported in span's metadata
- New Notify channel and threshold parameters. This channel will
receive a notification when the span buffer usage crosses the
threshold.
- Explicit transaction with extended protocol is now correctly
handled. This is done by keeping 2 different trace contexts, one for
parser/planner trace context at the root level and the other for
nested queries and executors. The spans now correctly show the parse
of the next statement happening before the ExecutorEnd of the previous
statement (see screenshot).

Changes:
- Parse span is now outside of the top span. When multiple statements
are processed, they are parsed together so it didn't make sense to
attach Parse to a specific statement.
- Deparse info is now exported in its own column. This will leave the
possibility to the trace forwarder to either use it as metadata or put
it in the span name.
- Renaming: Spans now have a span_type (Select, Executor, Parser...)
and a span_operation (ExecutorRun, Select $1...)
- For spans created without propagated trace context, the same traceid
will be used for statements within the same transaction.
- pg_tracing_consume_spans and pg_tracing_peek_spans are now
restricted to users with pg_read_all_stats role
- In instrument.h, instr->firsttime is only set if timer was requested

The code should be more stable from now on. Most of the features I had
planned are implemented.
I've also started writing the module's documentation. It's still a bit
bare but I will be working on completing this.

Regards,
Anthonin

On Fri, Sep 22, 2023 at 5:45 PM Anthonin Bonnefoy
<anthonin.bonnefoy@datadoghq.com> wrote:
>
> Hi!
>
> > If it's not too much trouble, please use `git format-patch`. This
> > makes applying and testing the patch much easier. Also you can provide
> > a commit message which 1. will simplify the work for the committer and
> > 2. can be reviewed as well.
> No problem, I will do that from now on.
>
> > The tests fail on CI [1]. I tried to run them locally and got the same
> > results.
> I've fixed the compilation issue, my working laptop is a mac so I've missed the
> linux errors. I've set up the CI on my side to avoid those issues in the future.
> I've also fixed most of the test issues.
> One test is still flaky: the parallel worker test can have one less
> worker reporting
> from time to time, I will try to find a way to make it more stable.
>
> > The comments for pg_tracing.c don't seem to be formatted properly.
> > Please make sure to run pg_indent. See src/tools/pgindent/README
> Done.
>
> > The interface pg_tracing_spans(true | false) doesn't strike me as
> > particularly readable. Maybe this function should be private and the
> > interface be like pg_tracing_spans() and pg_trancing_consume_spans().
> Agree. I wasn't super happy about the format. I've created
> pg_tracing_peek_spans() and pg_tracing_consume_spans() to make it
> more explicit.
>
> > Speaking of the tests I suggest adding a bit more comments before
> > every (or most) of the queries. Figuring out what they test could be
> > not particularly straightforward for somebody who will make changes
> > after the patch will be accepted.
> I've added more comments and a representation of the expected span
> hierarchy for the tests involving nested queries. It helps me a lot to keep
> track of the spans to check.
>
> I've done some additional changes:
> - I've added a start_ns to spans which is the nanosecond remainder of the
> time since the start of the trace. Since some spans can have a very short
> duration, some spans would have the same start if we use a microsecond
> precision. Having a start with a nanosecond precision allowed me to remove
> some hacks I was using and makes tests more stable.
> - I've also added a start_ns_time to span which is the value of the monotonic
> clock at the start of the span. I used to use duration_ns as a
> temporary storage
> for this value but it made things more confusing and hard to follow.
> - Fix error handling with nested queries created with ProcessUtility (like
> calling "create extension pg_tracing" twice).
>
> Regards,
> Anthonin
Вложения
Hi,

On Thu, 12 Oct 2023 at 14:32, Anthonin Bonnefoy
<anthonin.bonnefoy@datadoghq.com> wrote:
>
> Hi!
>
> I've made a new batch of changes and improvements.
> New features:
> - Triggers are now correctly supported. They were not correctly
> attached to the ExecutorFinish Span before.
> - Additional configuration: exporting parameter values in span
> metadata can be disabled. Deparsing can also be disabled now.
> - Dbid and userid are now exported in span's metadata
> - New Notify channel and threshold parameters. This channel will
> receive a notification when the span buffer usage crosses the
> threshold.
> - Explicit transaction with extended protocol is now correctly
> handled. This is done by keeping 2 different trace contexts, one for
> parser/planner trace context at the root level and the other for
> nested queries and executors. The spans now correctly show the parse
> of the next statement happening before the ExecutorEnd of the previous
> statement (see screenshot).
>
> Changes:
> - Parse span is now outside of the top span. When multiple statements
> are processed, they are parsed together so it didn't make sense to
> attach Parse to a specific statement.
> - Deparse info is now exported in its own column. This will leave the
> possibility to the trace forwarder to either use it as metadata or put
> it in the span name.
> - Renaming: Spans now have a span_type (Select, Executor, Parser...)
> and a span_operation (ExecutorRun, Select $1...)
> - For spans created without propagated trace context, the same traceid
> will be used for statements within the same transaction.
> - pg_tracing_consume_spans and pg_tracing_peek_spans are now
> restricted to users with pg_read_all_stats role
> - In instrument.h, instr->firsttime is only set if timer was requested
>
> The code should be more stable from now on. Most of the features I had
> planned are implemented.
> I've also started writing the module's documentation. It's still a bit
> bare but I will be working on completing this.

In CFbot, I see that build is failing for this patch (link:
https://cirrus-ci.com/task/5378223450619904?logs=build#L1532) with
following error:
[07:58:05.037] In file included from ../src/include/executor/instrument.h:16,
[07:58:05.037] from ../src/include/jit/jit.h:14,
[07:58:05.037] from ../contrib/pg_tracing/span.h:16,
[07:58:05.037] from ../contrib/pg_tracing/pg_tracing_explain.h:4,
[07:58:05.037] from ../contrib/pg_tracing/pg_tracing.c:43:
[07:58:05.037] ../contrib/pg_tracing/pg_tracing.c: In function
‘add_node_counters’:
[07:58:05.037] ../contrib/pg_tracing/pg_tracing.c:2330:70: error:
‘BufferUsage’ has no member named ‘blk_read_time’; did you mean
‘temp_blk_read_time’?
[07:58:05.037] 2330 | blk_read_time =
INSTR_TIME_GET_MILLISEC(node_counters->buffer_usage.blk_read_time);
[07:58:05.037] | ^~~~~~~~~~~~~
[07:58:05.037] ../src/include/portability/instr_time.h:126:12: note:
in definition of macro ‘INSTR_TIME_GET_NANOSEC’
[07:58:05.037] 126 | ((int64) (t).ticks)
[07:58:05.037] | ^
[07:58:05.037] ../contrib/pg_tracing/pg_tracing.c:2330:18: note: in
expansion of macro ‘INSTR_TIME_GET_MILLISEC’
[07:58:05.037] 2330 | blk_read_time =
INSTR_TIME_GET_MILLISEC(node_counters->buffer_usage.blk_read_time);
[07:58:05.037] | ^~~~~~~~~~~~~~~~~~~~~~~
[07:58:05.037] ../contrib/pg_tracing/pg_tracing.c:2331:71: error:
‘BufferUsage’ has no member named ‘blk_write_time’; did you mean
‘temp_blk_write_time’?
[07:58:05.037] 2331 | blk_write_time =
INSTR_TIME_GET_MILLISEC(node_counters->buffer_usage.blk_write_time);
[07:58:05.037] | ^~~~~~~~~~~~~~
[07:58:05.037] ../src/include/portability/instr_time.h:126:12: note:
in definition of macro ‘INSTR_TIME_GET_NANOSEC’
[07:58:05.037] 126 | ((int64) (t).ticks)
[07:58:05.037] | ^
[07:58:05.037] ../contrib/pg_tracing/pg_tracing.c:2331:19: note: in
expansion of macro ‘INSTR_TIME_GET_MILLISEC’
[07:58:05.037] 2331 | blk_write_time =
INSTR_TIME_GET_MILLISEC(node_counters->buffer_usage.blk_write_time);
[07:58:05.037] | ^~~~~~~~~~~~~~~~~~~~~~~

I also tried to build this patch locally and the build is failing with
the same error.

Thanks
Shlok Kumar Kyal
Hi!

The commit 13d00729d422c84b1764c24251abcc785ea4adb1 renamed some
fields in the BufferUsage struct. I've updated those which should fix the
compilation errors.

I've also added some changes, mainly around how lazy functions are managed.
Some queries like 'select character_maximum_length from
information_schema.element_types limit 1 offset 3;' could generate 50K spans
due to lazy calls of generate_series. Tracing of lazy functions is now disabled.

I've also written an otel version of the trace forwarder available in
https://github.com/bonnefoa/pg-tracing-otel-forwarder. The repository
contains a docker compose to start a local otel collector and jaeger
interface and will be able to consume the spans from a test PostgreSQL
instance with pg_tracing.

Regards,
Anthonin

On Mon, Nov 6, 2023 at 7:19 AM Shlok Kyal <shlok.kyal.oss@gmail.com> wrote:
>
> Hi,
>
> On Thu, 12 Oct 2023 at 14:32, Anthonin Bonnefoy
> <anthonin.bonnefoy@datadoghq.com> wrote:
> >
> > Hi!
> >
> > I've made a new batch of changes and improvements.
> > New features:
> > - Triggers are now correctly supported. They were not correctly
> > attached to the ExecutorFinish Span before.
> > - Additional configuration: exporting parameter values in span
> > metadata can be disabled. Deparsing can also be disabled now.
> > - Dbid and userid are now exported in span's metadata
> > - New Notify channel and threshold parameters. This channel will
> > receive a notification when the span buffer usage crosses the
> > threshold.
> > - Explicit transaction with extended protocol is now correctly
> > handled. This is done by keeping 2 different trace contexts, one for
> > parser/planner trace context at the root level and the other for
> > nested queries and executors. The spans now correctly show the parse
> > of the next statement happening before the ExecutorEnd of the previous
> > statement (see screenshot).
> >
> > Changes:
> > - Parse span is now outside of the top span. When multiple statements
> > are processed, they are parsed together so it didn't make sense to
> > attach Parse to a specific statement.
> > - Deparse info is now exported in its own column. This will leave the
> > possibility to the trace forwarder to either use it as metadata or put
> > it in the span name.
> > - Renaming: Spans now have a span_type (Select, Executor, Parser...)
> > and a span_operation (ExecutorRun, Select $1...)
> > - For spans created without propagated trace context, the same traceid
> > will be used for statements within the same transaction.
> > - pg_tracing_consume_spans and pg_tracing_peek_spans are now
> > restricted to users with pg_read_all_stats role
> > - In instrument.h, instr->firsttime is only set if timer was requested
> >
> > The code should be more stable from now on. Most of the features I had
> > planned are implemented.
> > I've also started writing the module's documentation. It's still a bit
> > bare but I will be working on completing this.
>
> In CFbot, I see that build is failing for this patch (link:
> https://cirrus-ci.com/task/5378223450619904?logs=build#L1532) with
> following error:
> [07:58:05.037] In file included from ../src/include/executor/instrument.h:16,
> [07:58:05.037] from ../src/include/jit/jit.h:14,
> [07:58:05.037] from ../contrib/pg_tracing/span.h:16,
> [07:58:05.037] from ../contrib/pg_tracing/pg_tracing_explain.h:4,
> [07:58:05.037] from ../contrib/pg_tracing/pg_tracing.c:43:
> [07:58:05.037] ../contrib/pg_tracing/pg_tracing.c: In function
> ‘add_node_counters’:
> [07:58:05.037] ../contrib/pg_tracing/pg_tracing.c:2330:70: error:
> ‘BufferUsage’ has no member named ‘blk_read_time’; did you mean
> ‘temp_blk_read_time’?
> [07:58:05.037] 2330 | blk_read_time =
> INSTR_TIME_GET_MILLISEC(node_counters->buffer_usage.blk_read_time);
> [07:58:05.037] | ^~~~~~~~~~~~~
> [07:58:05.037] ../src/include/portability/instr_time.h:126:12: note:
> in definition of macro ‘INSTR_TIME_GET_NANOSEC’
> [07:58:05.037] 126 | ((int64) (t).ticks)
> [07:58:05.037] | ^
> [07:58:05.037] ../contrib/pg_tracing/pg_tracing.c:2330:18: note: in
> expansion of macro ‘INSTR_TIME_GET_MILLISEC’
> [07:58:05.037] 2330 | blk_read_time =
> INSTR_TIME_GET_MILLISEC(node_counters->buffer_usage.blk_read_time);
> [07:58:05.037] | ^~~~~~~~~~~~~~~~~~~~~~~
> [07:58:05.037] ../contrib/pg_tracing/pg_tracing.c:2331:71: error:
> ‘BufferUsage’ has no member named ‘blk_write_time’; did you mean
> ‘temp_blk_write_time’?
> [07:58:05.037] 2331 | blk_write_time =
> INSTR_TIME_GET_MILLISEC(node_counters->buffer_usage.blk_write_time);
> [07:58:05.037] | ^~~~~~~~~~~~~~
> [07:58:05.037] ../src/include/portability/instr_time.h:126:12: note:
> in definition of macro ‘INSTR_TIME_GET_NANOSEC’
> [07:58:05.037] 126 | ((int64) (t).ticks)
> [07:58:05.037] | ^
> [07:58:05.037] ../contrib/pg_tracing/pg_tracing.c:2331:19: note: in
> expansion of macro ‘INSTR_TIME_GET_MILLISEC’
> [07:58:05.037] 2331 | blk_write_time =
> INSTR_TIME_GET_MILLISEC(node_counters->buffer_usage.blk_write_time);
> [07:58:05.037] | ^~~~~~~~~~~~~~~~~~~~~~~
>
> I also tried to build this patch locally and the build is failing with
> the same error.
>
> Thanks
> Shlok Kumar Kyal
Вложения
Hi,

Some small changes, mostly around making tests less flaky:
- Removed the top_span and nested_level in the span output, those were
mostly used for debugging
- More tests around Parse span in nested queries
- Remove explicit queryId in the tests

Regards,
Anthonin

On Mon, Nov 6, 2023 at 4:08 PM Anthonin Bonnefoy
<anthonin.bonnefoy@datadoghq.com> wrote:
>
> Hi!
>
> The commit 13d00729d422c84b1764c24251abcc785ea4adb1 renamed some
> fields in the BufferUsage struct. I've updated those which should fix the
> compilation errors.
>
> I've also added some changes, mainly around how lazy functions are managed.
> Some queries like 'select character_maximum_length from
> information_schema.element_types limit 1 offset 3;' could generate 50K spans
> due to lazy calls of generate_series. Tracing of lazy functions is now disabled.
>
> I've also written an otel version of the trace forwarder available in
> https://github.com/bonnefoa/pg-tracing-otel-forwarder. The repository
> contains a docker compose to start a local otel collector and jaeger
> interface and will be able to consume the spans from a test PostgreSQL
> instance with pg_tracing.
>
> Regards,
> Anthonin
>
> On Mon, Nov 6, 2023 at 7:19 AM Shlok Kyal <shlok.kyal.oss@gmail.com> wrote:
> >
> > Hi,
> >
> > On Thu, 12 Oct 2023 at 14:32, Anthonin Bonnefoy
> > <anthonin.bonnefoy@datadoghq.com> wrote:
> > >
> > > Hi!
> > >
> > > I've made a new batch of changes and improvements.
> > > New features:
> > > - Triggers are now correctly supported. They were not correctly
> > > attached to the ExecutorFinish Span before.
> > > - Additional configuration: exporting parameter values in span
> > > metadata can be disabled. Deparsing can also be disabled now.
> > > - Dbid and userid are now exported in span's metadata
> > > - New Notify channel and threshold parameters. This channel will
> > > receive a notification when the span buffer usage crosses the
> > > threshold.
> > > - Explicit transaction with extended protocol is now correctly
> > > handled. This is done by keeping 2 different trace contexts, one for
> > > parser/planner trace context at the root level and the other for
> > > nested queries and executors. The spans now correctly show the parse
> > > of the next statement happening before the ExecutorEnd of the previous
> > > statement (see screenshot).
> > >
> > > Changes:
> > > - Parse span is now outside of the top span. When multiple statements
> > > are processed, they are parsed together so it didn't make sense to
> > > attach Parse to a specific statement.
> > > - Deparse info is now exported in its own column. This will leave the
> > > possibility to the trace forwarder to either use it as metadata or put
> > > it in the span name.
> > > - Renaming: Spans now have a span_type (Select, Executor, Parser...)
> > > and a span_operation (ExecutorRun, Select $1...)
> > > - For spans created without propagated trace context, the same traceid
> > > will be used for statements within the same transaction.
> > > - pg_tracing_consume_spans and pg_tracing_peek_spans are now
> > > restricted to users with pg_read_all_stats role
> > > - In instrument.h, instr->firsttime is only set if timer was requested
> > >
> > > The code should be more stable from now on. Most of the features I had
> > > planned are implemented.
> > > I've also started writing the module's documentation. It's still a bit
> > > bare but I will be working on completing this.
> >
> > In CFbot, I see that build is failing for this patch (link:
> > https://cirrus-ci.com/task/5378223450619904?logs=build#L1532) with
> > following error:
> > [07:58:05.037] In file included from ../src/include/executor/instrument.h:16,
> > [07:58:05.037] from ../src/include/jit/jit.h:14,
> > [07:58:05.037] from ../contrib/pg_tracing/span.h:16,
> > [07:58:05.037] from ../contrib/pg_tracing/pg_tracing_explain.h:4,
> > [07:58:05.037] from ../contrib/pg_tracing/pg_tracing.c:43:
> > [07:58:05.037] ../contrib/pg_tracing/pg_tracing.c: In function
> > ‘add_node_counters’:
> > [07:58:05.037] ../contrib/pg_tracing/pg_tracing.c:2330:70: error:
> > ‘BufferUsage’ has no member named ‘blk_read_time’; did you mean
> > ‘temp_blk_read_time’?
> > [07:58:05.037] 2330 | blk_read_time =
> > INSTR_TIME_GET_MILLISEC(node_counters->buffer_usage.blk_read_time);
> > [07:58:05.037] | ^~~~~~~~~~~~~
> > [07:58:05.037] ../src/include/portability/instr_time.h:126:12: note:
> > in definition of macro ‘INSTR_TIME_GET_NANOSEC’
> > [07:58:05.037] 126 | ((int64) (t).ticks)
> > [07:58:05.037] | ^
> > [07:58:05.037] ../contrib/pg_tracing/pg_tracing.c:2330:18: note: in
> > expansion of macro ‘INSTR_TIME_GET_MILLISEC’
> > [07:58:05.037] 2330 | blk_read_time =
> > INSTR_TIME_GET_MILLISEC(node_counters->buffer_usage.blk_read_time);
> > [07:58:05.037] | ^~~~~~~~~~~~~~~~~~~~~~~
> > [07:58:05.037] ../contrib/pg_tracing/pg_tracing.c:2331:71: error:
> > ‘BufferUsage’ has no member named ‘blk_write_time’; did you mean
> > ‘temp_blk_write_time’?
> > [07:58:05.037] 2331 | blk_write_time =
> > INSTR_TIME_GET_MILLISEC(node_counters->buffer_usage.blk_write_time);
> > [07:58:05.037] | ^~~~~~~~~~~~~~
> > [07:58:05.037] ../src/include/portability/instr_time.h:126:12: note:
> > in definition of macro ‘INSTR_TIME_GET_NANOSEC’
> > [07:58:05.037] 126 | ((int64) (t).ticks)
> > [07:58:05.037] | ^
> > [07:58:05.037] ../contrib/pg_tracing/pg_tracing.c:2331:19: note: in
> > expansion of macro ‘INSTR_TIME_GET_MILLISEC’
> > [07:58:05.037] 2331 | blk_write_time =
> > INSTR_TIME_GET_MILLISEC(node_counters->buffer_usage.blk_write_time);
> > [07:58:05.037] | ^~~~~~~~~~~~~~~~~~~~~~~
> >
> > I also tried to build this patch locally and the build is failing with
> > the same error.
> >
> > Thanks
> > Shlok Kumar Kyal
Вложения
Hi,

Thanks for the updated patch!

> Some small changes, mostly around making tests less flaky:
> - Removed the top_span and nested_level in the span output, those were
> mostly used for debugging
> - More tests around Parse span in nested queries
> - Remove explicit queryId in the tests

```
+-- Worker can take some additional time to end and report their spans
+SELECT pg_sleep(0.2);
+ pg_sleep
+----------
+
+(1 row)
```

Pretty sure this will fail on buildfarm from time to time. Maybe this
is a case when it is worth using TAP tests? Especially considering the
support of pg_tracing.notify_channel.

```
+      Only superusers can change this setting.
+      This parameter can only be set at server start.
```

I find this confusing. If the parameter can only be set at server
start doesn't it mean that whoever has access to postgresql.conf can
change it?

```
+      <varname>pg_tracing.track_utility</varname> controls whether spans
+      should be generated for utility statements. Utility commands are
+      all those other than <command>SELECT</command>,
<command>INSERT</command>,
+      <command>UPDATE</command>, <command>DELETE</command>, and
<command>MERGE</command>.
+      The default value is <literal>on</literal>.
```

Perhaps TABLE command should be added to the list, since it's
basically a syntax sugar for SELECT:

```
=# create table t(x int);
=# insert into t values (1), (2), (3);
=# table t;
 x
---
 1
 2
 3
(3 rows)
```

This part worries me a bit:

```
+    <listitem>
+     <para>
+      <varname>pg_tracing.drop_on_full_buffer</varname> controls whether
+      span buffer should be emptied when <varname>pg_tracing.max_span</varname>
+      spans is reached. If <literal>off</literal>, new spans are dropped.
+      The default value is <literal>on</literal>.
+     </para>
+    </listitem>
+   </varlistentry>
```

Obviously pg_tracing.drop_on_full_buffer = on will not work properly
with pg_tracing.notify_threshold because there is a race condition
possible. By the time one receives and processes the notification the
buffer can be already cleaned. This makes me think that 1)
pg_tracing.drop_on_full_buffer = on could be not the best default
value 2) As a user I would like a support of ring buffer mode. Even if
implementing this mode is out of scope of this particular patch, I
would argue that instead of drop_on_full_buffer boolean parameter we
need something like:

pg_tracing.buffer_mode = keep_on_full | drop_on_full | ring_buffer |
perhaps_other_future_modes

```
+  <para>
+   The module requires additional shared memory proportional to
+   <varname>pg_tracing.max_span</varname>.  Note that this
+   memory is consumed whenever the module is loaded, even if
+   no spans are generated.
+  </para>
```

Do you think it possible to document how much shared memory does the
extension consume depending on the parameters? Alternatively maybe
it's worth providing a SQL function that returns this value? As a user
I would like to know whether 10 MB, 500 MB or 1.5 GB of shared memory
are consumed.

```
+   The start time of a span has two parts: <literal>span_start</literal> and
+   <literal>span_start_ns</literal>. <literal>span_start</literal> is
a Timestamp
+   with time zone providing up a microsecond precision.
<literal>span_start_ns</literal>
+   provides the nanosecond part of the span start.
<literal>span_start + span_start_ns</literal>
+   can be used to get the start with nanosecond precision.
```

I would argue that ns ( 1 / 1_000_000_000 sec! ) precision is
redundant and only complicates the interface. This is way below the
noise floor formed from network delays, process switching by the OS,
noisy neighbours under the same supervisor, time slowdown by ntpd,
etc. I don't recall ever needing spans with better than 1 us
precision.

On top of that if you have `span_start_ns` you should probably rename
`duration` to `duration_ns` for consistency. I believe it would be
more convenient to have `duration` in microseconds. Nothing prevents
us from using fractions of microseconds (e.g. 12.345 us) if necessary.

```
+=# select trace_id, parent_id, span_id, span_start, duration, span_type, ...
+       trace_id       |      parent_id       |       span_id        |
        ...
+----------------------+----------------------+----------------------+----
+   479062278978111363 |   479062278978111363 |   479062278978111363 ...
+   479062278978111363 |   479062278978111363 |   479062278978111363 ...
+   479062278978111363 |   479062278978111363 | -7732425595282414585 ...
```

Negative span ids, for sure, are possible, but I don't recall seeing
many negative ids in my life. I suggest not to surprise the user
unless this is really necessary.

--
Best regards,
Aleksander Alekseev
Hi,

Thanks for the review!

> ```
> +-- Worker can take some additional time to end and report their spans
> +SELECT pg_sleep(0.2);
> + pg_sleep
> +----------
> +
> +(1 row)
> ```
>
> Pretty sure this will fail on buildfarm from time to time. Maybe this
> is a case when it is worth using TAP tests? Especially considering the
> support of pg_tracing.notify_channel.

The sleep was unnecessary as the leader waits for all workers to finish
and report. All workers should have added their spans in the shared buffer
before the leader and I removed the sleep from the test. I haven't seen a recent
failure on this test since then.

I did add a TAP test for the notify part since it seems to be the only way
to test it.

> ```
> +      Only superusers can change this setting.
> +      This parameter can only be set at server start.
> ```
>
> I find this confusing. If the parameter can only be set at server
> start doesn't it mean that whoever has access to postgresql.conf can
> change it?

The 'only superusers...' part was incorrect. This setting was needed to compute
the size of the shmem request so modifying it would require a server start.
Though for this parameter, I've realised that I could use the global's
max_parallel_workers
instead, removing the need to have a max_traced_parallel_workers parameter.

> Perhaps TABLE command should be added to the list, since it's
> basically a syntax sugar for SELECT:

Added.

> Obviously pg_tracing.drop_on_full_buffer = on will not work properly
> with pg_tracing.notify_threshold because there is a race condition
> possible. By the time one receives and processes the notification the
> buffer can be already cleaned.

That's definitely a possibility. Lowering the notification threshold can
lower the chance of the buffer being cleared when handling the notification
but the race can still happen.

For my use cases, spans should be sent as soon as possible and old spans
are less valuable than new spans but other usage would want the opposite,
thus the parameters to control the behavior.

> This makes me think that 1) pg_tracing.drop_on_full_buffer = on could
> be not the best default value

I don't have a strong opinion on the default behaviour, I will switch to
keep buffer on full.

> 2) As a user I would like a support of ring buffer mode. Even if
> implementing this mode is out of scope of this particular patch, I
> would argue that instead of drop_on_full_buffer boolean parameter we
> need something like:
>
> pg_tracing.buffer_mode = keep_on_full | drop_on_full | ring_buffer |
> perhaps_other_future_modes

Having a buffer ring was also my first approach but it adds some complexity
and I've switched to the full drop + truncate query file for the first
iteration.
Ring buffer would definitely be a better experience, I've switched the
parameter to an enum with only keep_on_full and drop_on_full for the time being.

> Do you think it possible to document how much shared memory does the
> extension consume depending on the parameters? Alternatively maybe
> it's worth providing a SQL function that returns this value? As a user
> I would like to know whether 10 MB, 500 MB or 1.5 GB of shared memory
> are consumed.

Good point. I've updated the doc to give some approximations with a query
to detail the memory usage.

> I would argue that ns ( 1 / 1_000_000_000 sec! ) precision is
> redundant and only complicates the interface. This is way below the
> noise floor formed from network delays, process switching by the OS,
> noisy neighbours under the same supervisor, time slowdown by ntpd,
> etc. I don't recall ever needing spans with better than 1 us
> precision.
>
> On top of that if you have `span_start_ns` you should probably rename
> `duration` to `duration_ns` for consistency. I believe it would be
> more convenient to have `duration` in microseconds. Nothing prevents
> us from using fractions of microseconds (e.g. 12.345 us) if necessary.

I was definitely on the fence on this. I've initially tried to match the
precision provided by query instrumentation but that definitely introduced
a lot of complexity. Also, while trace standard specify that start and end
should be in nanoseconds, it turns out that the nanosecond precision is
generally ignored.

I've switched to a start+end in TimestampTz, dropping the ns precision.
Tests had to be rewritten to have a stable order with spans having that can
have the same start/end.

I've also removed some spans: ExecutorStart, ExecutorEnd, PostParse.
Those spans generally had a sub microsecond duration and didn't bring much
value except for debugging pg_tracing itself. To avoid the confusion of
having spans with a 0us duration, removing them altogether seemed better.
ExecutorFinish also has a sub microsecond duration unless it has a nested
query (triggers) so I'm only emitting them in those cases.

> Negative span ids, for sure, are possible, but I don't recall seeing
> many negative ids in my life. I suggest not to surprise the user
> unless this is really necessary.

That one is gonna be difficult. Traceid and spanid are 8 bytes so I'm exporting
them using bigint. PostgreSQL doesn't support unsigned bigint thus the negative
span ids. An alternative would be to use a bytea but bigint are easier to read
and interact with.

The latest patch contains changes around the nanosecond precision drop, test
updates to make them more stable and simplification around span management.

Regards,
Anthonin

On Fri, Nov 17, 2023 at 3:34 PM Aleksander Alekseev
<aleksander@timescale.com> wrote:
>
> Hi,
>
> Thanks for the updated patch!
>
> > Some small changes, mostly around making tests less flaky:
> > - Removed the top_span and nested_level in the span output, those were
> > mostly used for debugging
> > - More tests around Parse span in nested queries
> > - Remove explicit queryId in the tests
>
> ```
> +-- Worker can take some additional time to end and report their spans
> +SELECT pg_sleep(0.2);
> + pg_sleep
> +----------
> +
> +(1 row)
> ```
>
> Pretty sure this will fail on buildfarm from time to time. Maybe this
> is a case when it is worth using TAP tests? Especially considering the
> support of pg_tracing.notify_channel.
>
> ```
> +      Only superusers can change this setting.
> +      This parameter can only be set at server start.
> ```
>
> I find this confusing. If the parameter can only be set at server
> start doesn't it mean that whoever has access to postgresql.conf can
> change it?
>
> ```
> +      <varname>pg_tracing.track_utility</varname> controls whether spans
> +      should be generated for utility statements. Utility commands are
> +      all those other than <command>SELECT</command>,
> <command>INSERT</command>,
> +      <command>UPDATE</command>, <command>DELETE</command>, and
> <command>MERGE</command>.
> +      The default value is <literal>on</literal>.
> ```
>
> Perhaps TABLE command should be added to the list, since it's
> basically a syntax sugar for SELECT:
>
> ```
> =# create table t(x int);
> =# insert into t values (1), (2), (3);
> =# table t;
>  x
> ---
>  1
>  2
>  3
> (3 rows)
> ```
>
> This part worries me a bit:
>
> ```
> +    <listitem>
> +     <para>
> +      <varname>pg_tracing.drop_on_full_buffer</varname> controls whether
> +      span buffer should be emptied when <varname>pg_tracing.max_span</varname>
> +      spans is reached. If <literal>off</literal>, new spans are dropped.
> +      The default value is <literal>on</literal>.
> +     </para>
> +    </listitem>
> +   </varlistentry>
> ```
>
> Obviously pg_tracing.drop_on_full_buffer = on will not work properly
> with pg_tracing.notify_threshold because there is a race condition
> possible. By the time one receives and processes the notification the
> buffer can be already cleaned. This makes me think that 1)
> pg_tracing.drop_on_full_buffer = on could be not the best default
> value 2) As a user I would like a support of ring buffer mode. Even if
> implementing this mode is out of scope of this particular patch, I
> would argue that instead of drop_on_full_buffer boolean parameter we
> need something like:
>
> pg_tracing.buffer_mode = keep_on_full | drop_on_full | ring_buffer |
> perhaps_other_future_modes
>
> ```
> +  <para>
> +   The module requires additional shared memory proportional to
> +   <varname>pg_tracing.max_span</varname>.  Note that this
> +   memory is consumed whenever the module is loaded, even if
> +   no spans are generated.
> +  </para>
> ```
>
> Do you think it possible to document how much shared memory does the
> extension consume depending on the parameters? Alternatively maybe
> it's worth providing a SQL function that returns this value? As a user
> I would like to know whether 10 MB, 500 MB or 1.5 GB of shared memory
> are consumed.
>
> ```
> +   The start time of a span has two parts: <literal>span_start</literal> and
> +   <literal>span_start_ns</literal>. <literal>span_start</literal> is
> a Timestamp
> +   with time zone providing up a microsecond precision.
> <literal>span_start_ns</literal>
> +   provides the nanosecond part of the span start.
> <literal>span_start + span_start_ns</literal>
> +   can be used to get the start with nanosecond precision.
> ```
>
> I would argue that ns ( 1 / 1_000_000_000 sec! ) precision is
> redundant and only complicates the interface. This is way below the
> noise floor formed from network delays, process switching by the OS,
> noisy neighbours under the same supervisor, time slowdown by ntpd,
> etc. I don't recall ever needing spans with better than 1 us
> precision.
>
> On top of that if you have `span_start_ns` you should probably rename
> `duration` to `duration_ns` for consistency. I believe it would be
> more convenient to have `duration` in microseconds. Nothing prevents
> us from using fractions of microseconds (e.g. 12.345 us) if necessary.
>
> ```
> +=# select trace_id, parent_id, span_id, span_start, duration, span_type, ...
> +       trace_id       |      parent_id       |       span_id        |
>         ...
> +----------------------+----------------------+----------------------+----
> +   479062278978111363 |   479062278978111363 |   479062278978111363 ...
> +   479062278978111363 |   479062278978111363 |   479062278978111363 ...
> +   479062278978111363 |   479062278978111363 | -7732425595282414585 ...
> ```
>
> Negative span ids, for sure, are possible, but I don't recall seeing
> many negative ids in my life. I suggest not to surprise the user
> unless this is really necessary.
>
> --
> Best regards,
> Aleksander Alekseev
Вложения
Hi,

> Overall solution looks good for me except SQL Commenter - query instrumentation
> with SQL comments is often not possible on production systems. Instead
> the very often requested feature is to enable tracing for a given single query ID,
> or several (very limited number of) queries by IDs. It could be done by adding
> SQL function to add and remove query ID into a list (even array would do)
> stored in top tracing context.

Not 100% sure if I follow.

By queries you mean particular queries, not transactions? And since
they have an assigned ID it means that the query is already executing
and we want to enable the tracking in another session, right? If this
is the case I would argue that enabling/disabling tracing for an
_already_ running query (or transaction) would be way too complicated.

I wouldn't mind enabling/disabling tracing for the current session
and/or a given session ID. In the latter case it can have an effect
only for the new transactions. This however could be implemented
separately from the proposed patchset. I suggest keeping the scope
small.

--
Best regards,
Aleksander Alekseev
Hi,

> This approach avoids the need to rewrite SQL or give special meaning to SQL comments.

SQLCommenter already has a good amount of support and is referenced in
opentelemetry https://github.com/open-telemetry/opentelemetry-sqlcommenter
So the goal was more to leverage the existing trace propagation
systems as much as possible.

> I used GUCs to set the `opentelemtery_trace_id` and `opentelemetry_span_id`.
> These can be sent as protocol-level messages by the client driver if the
> client driver has native trace integration enabled, in which case the user
> doesn't need to see or care. And for other drivers, the application can use
> `SET` or `SET LOCAL` to assign them.

Emitting `SET` and `SET LOCAL` for every traced statement sounds more
disruptive and expensive than relying on SQLCommenter. When not using
`SET LOCAL`, the variables also need to be cleared.
This will also introduce a lot of headaches as the `SET` themselves
could be traced and generate spans when tracing utility statements is
already tricky enough.

> But IIRC the current BDR/PGD folks are now using an OpenTelemetry
> sidecar process instead. I think they send it UDP packets to emit
> metrics and events.

I would be curious to hear more about this. I didn't want to be tied
to a specific protocol (I've only seen gRPC and http support on latest
opentelemetry collectors) and I fear that relying on Postgres sending
traces would lower the chance of having this supported on managed
Postgres solutions (like RDS and CloudSQL).

> By queries you mean particular queries, not transactions? And since
> they have an assigned ID it means that the query is already executing
> and we want to enable the tracking in another session, right?

I think that was the idea. The query identifier generated for a
specific statement is stable so we could have a GUC variable with a
list of query id and only queries matching the provided query ids
would be sampled. This would make it easier to generate traces for a
specific query within a session.


On Tue, Jan 2, 2024 at 1:14 PM Aleksander Alekseev
<aleksander@timescale.com> wrote:
>
> Hi,
>
> > Overall solution looks good for me except SQL Commenter - query instrumentation
> > with SQL comments is often not possible on production systems. Instead
> > the very often requested feature is to enable tracing for a given single query ID,
> > or several (very limited number of) queries by IDs. It could be done by adding
> > SQL function to add and remove query ID into a list (even array would do)
> > stored in top tracing context.
>
> Not 100% sure if I follow.
>
> By queries you mean particular queries, not transactions? And since
> they have an assigned ID it means that the query is already executing
> and we want to enable the tracking in another session, right? If this
> is the case I would argue that enabling/disabling tracing for an
> _already_ running query (or transaction) would be way too complicated.
>
> I wouldn't mind enabling/disabling tracing for the current session
> and/or a given session ID. In the latter case it can have an effect
> only for the new transactions. This however could be implemented
> separately from the proposed patchset. I suggest keeping the scope
> small.
>
> --
> Best regards,
> Aleksander Alekseev
> By queries you mean particular queries, not transactions? And since
> they have an assigned ID it means that the query is already executing
> and we want to enable the tracking in another session, right?
I think that was the idea. The query identifier generated for a
specific statement is stable so we could have a GUC variable with a
list of query id and only queries matching the provided query ids
would be sampled. This would make it easier to generate traces for a
specific query within a session.
On Thu, 7 Dec 2023 at 20:06, Anthonin Bonnefoy
<anthonin.bonnefoy@datadoghq.com> wrote:
>
> Hi,
>
> Thanks for the review!
>
> > ```
> > +-- Worker can take some additional time to end and report their spans
> > +SELECT pg_sleep(0.2);
> > + pg_sleep
> > +----------
> > +
> > +(1 row)
> > ```
> >
> > Pretty sure this will fail on buildfarm from time to time. Maybe this
> > is a case when it is worth using TAP tests? Especially considering the
> > support of pg_tracing.notify_channel.
>
> The sleep was unnecessary as the leader waits for all workers to finish
> and report. All workers should have added their spans in the shared buffer
> before the leader and I removed the sleep from the test. I haven't seen a recent
> failure on this test since then.
>
> I did add a TAP test for the notify part since it seems to be the only way
> to test it.
>
> > ```
> > +      Only superusers can change this setting.
> > +      This parameter can only be set at server start.
> > ```
> >
> > I find this confusing. If the parameter can only be set at server
> > start doesn't it mean that whoever has access to postgresql.conf can
> > change it?
>
> The 'only superusers...' part was incorrect. This setting was needed to compute
> the size of the shmem request so modifying it would require a server start.
> Though for this parameter, I've realised that I could use the global's
> max_parallel_workers
> instead, removing the need to have a max_traced_parallel_workers parameter.
>
> > Perhaps TABLE command should be added to the list, since it's
> > basically a syntax sugar for SELECT:
>
> Added.
>
> > Obviously pg_tracing.drop_on_full_buffer = on will not work properly
> > with pg_tracing.notify_threshold because there is a race condition
> > possible. By the time one receives and processes the notification the
> > buffer can be already cleaned.
>
> That's definitely a possibility. Lowering the notification threshold can
> lower the chance of the buffer being cleared when handling the notification
> but the race can still happen.
>
> For my use cases, spans should be sent as soon as possible and old spans
> are less valuable than new spans but other usage would want the opposite,
> thus the parameters to control the behavior.
>
> > This makes me think that 1) pg_tracing.drop_on_full_buffer = on could
> > be not the best default value
>
> I don't have a strong opinion on the default behaviour, I will switch to
> keep buffer on full.
>
> > 2) As a user I would like a support of ring buffer mode. Even if
> > implementing this mode is out of scope of this particular patch, I
> > would argue that instead of drop_on_full_buffer boolean parameter we
> > need something like:
> >
> > pg_tracing.buffer_mode = keep_on_full | drop_on_full | ring_buffer |
> > perhaps_other_future_modes
>
> Having a buffer ring was also my first approach but it adds some complexity
> and I've switched to the full drop + truncate query file for the first
> iteration.
> Ring buffer would definitely be a better experience, I've switched the
> parameter to an enum with only keep_on_full and drop_on_full for the time being.
>
> > Do you think it possible to document how much shared memory does the
> > extension consume depending on the parameters? Alternatively maybe
> > it's worth providing a SQL function that returns this value? As a user
> > I would like to know whether 10 MB, 500 MB or 1.5 GB of shared memory
> > are consumed.
>
> Good point. I've updated the doc to give some approximations with a query
> to detail the memory usage.
>
> > I would argue that ns ( 1 / 1_000_000_000 sec! ) precision is
> > redundant and only complicates the interface. This is way below the
> > noise floor formed from network delays, process switching by the OS,
> > noisy neighbours under the same supervisor, time slowdown by ntpd,
> > etc. I don't recall ever needing spans with better than 1 us
> > precision.
> >
> > On top of that if you have `span_start_ns` you should probably rename
> > `duration` to `duration_ns` for consistency. I believe it would be
> > more convenient to have `duration` in microseconds. Nothing prevents
> > us from using fractions of microseconds (e.g. 12.345 us) if necessary.
>
> I was definitely on the fence on this. I've initially tried to match the
> precision provided by query instrumentation but that definitely introduced
> a lot of complexity. Also, while trace standard specify that start and end
> should be in nanoseconds, it turns out that the nanosecond precision is
> generally ignored.
>
> I've switched to a start+end in TimestampTz, dropping the ns precision.
> Tests had to be rewritten to have a stable order with spans having that can
> have the same start/end.
>
> I've also removed some spans: ExecutorStart, ExecutorEnd, PostParse.
> Those spans generally had a sub microsecond duration and didn't bring much
> value except for debugging pg_tracing itself. To avoid the confusion of
> having spans with a 0us duration, removing them altogether seemed better.
> ExecutorFinish also has a sub microsecond duration unless it has a nested
> query (triggers) so I'm only emitting them in those cases.
>
> > Negative span ids, for sure, are possible, but I don't recall seeing
> > many negative ids in my life. I suggest not to surprise the user
> > unless this is really necessary.
>
> That one is gonna be difficult. Traceid and spanid are 8 bytes so I'm exporting
> them using bigint. PostgreSQL doesn't support unsigned bigint thus the negative
> span ids. An alternative would be to use a bytea but bigint are easier to read
> and interact with.
>
> The latest patch contains changes around the nanosecond precision drop, test
> updates to make them more stable and simplification around span management.

One of the test has failed in CFBOT [1] with:
-select count(span_id) from pg_tracing_consume_spans group by span_id;
- count
--------
-     1
-     1
-     1
-     1
-     1
-(5 rows)
-
--- Cleanup
-SET pg_tracing.sample_rate = 0.0;
+server closed the connection unexpectedly
+ This probably means the server terminated abnormally
+ before or while processing the request.
+connection to server was lost

More details are available at [2]

[1] - https://cirrus-ci.com/task/5876369167482880
[2] -
https://api.cirrus-ci.com/v1/artifact/task/5876369167482880/testrun/build/testrun/pg_tracing/regress/regression.diffs
On Thu, Jan 4, 2024, 16:36 Anthonin Bonnefoy
<anthonin.bonnefoy@datadoghq.com> wrote:
> > I used GUCs to set the `opentelemtery_trace_id` and `opentelemetry_span_id`.
> > These can be sent as protocol-level messages by the client driver if the
> > client driver has native trace integration enabled, in which case the user
> > doesn't need to see or care. And for other drivers, the application can use
> > `SET` or `SET LOCAL` to assign them.
>
> Emitting `SET` and `SET LOCAL` for every traced statement sounds more
> disruptive and expensive than relying on SQLCommenter. When not using
> `SET LOCAL`, the variables also need to be cleared.
> This will also introduce a lot of headaches as the `SET` themselves
> could be traced and generate spans when tracing utility statements is
> already tricky enough.

I think one hugely important benefit of using GUCs over sql comments
is, that comments and named protocol-level prepared statements cannot
be combined afaict. Since with named protocol level prepared
statements no query is sent, only arguments. So there's no place to
attach a comment too.
Hi,

> I think one hugely important benefit of using GUCs over sql comments
> is, that comments and named protocol-level prepared statements cannot
> be combined afaict. Since with named protocol level prepared
> statements no query is sent, only arguments. So there's no place to
> attach a comment too.

Handling named prepared statements has definitely been a pain point.
I've been experimenting and it is possible to combine comments with
prepared statements by passing the comment's content as a parameter.

PREPARE test_prepared (text, integer) AS /*$1*/ SELECT $2;
EXECUTE test_prepared('dddbs=''postgres.db'',traceparent=''00-00000000000000000000000000000009-0000000000000009-01''',
1);

Though adding a parameter is definitely more intrusive than just
adding a comment and this is not defined and supported anywhere. I
will try to see how much work and complexity it would involve to add
the trace context propagation through GUC variables.
On one hand, having more options would allow more flexibility and ease
to implement the trace propagation. On the other hand, I would like to
keep things simple for a first iteration.

> One of the test has failed in CFBOT [1] with

I've identified and fixed the issue. An assertion checking that spans
generated from planstate didn't end before the parent's end could be
triggered.

The new patch also contains the following changes:
- Support for 128 bits trace ids. While w3c defines exceptions to
allow compatibility with systems that only support 64 bits trace ids,
supporting 128 bits trace ids early should remove the possible pain of
migrating or interoperating issues.
- Trace ids, span ids and parent ids outputs are now hexadecimal
characters instead of bigints. This removes the negative ids issue due
to not having unsigned bigint and was necessary for the 128 bits trace
id support. It also matches the format that's propagated through the
traceparent value. They are still stored as uint64 to keep memory
footprint low.
- Added support for before trigger.
- Refactored all headers to a single header file.
- Added Query id filtering. Adding this turned out to be rather straightforward.
- Additional edge cases found and fixed (planner error could trigger
an assertion failure).

Regards,
Anthonin

On Sun, Jan 7, 2024 at 12:48 AM Jelte Fennema-Nio <postgres@jeltef.nl> wrote:
>
> On Thu, Jan 4, 2024, 16:36 Anthonin Bonnefoy
> <anthonin.bonnefoy@datadoghq.com> wrote:
> > > I used GUCs to set the `opentelemtery_trace_id` and `opentelemetry_span_id`.
> > > These can be sent as protocol-level messages by the client driver if the
> > > client driver has native trace integration enabled, in which case the user
> > > doesn't need to see or care. And for other drivers, the application can use
> > > `SET` or `SET LOCAL` to assign them.
> >
> > Emitting `SET` and `SET LOCAL` for every traced statement sounds more
> > disruptive and expensive than relying on SQLCommenter. When not using
> > `SET LOCAL`, the variables also need to be cleared.
> > This will also introduce a lot of headaches as the `SET` themselves
> > could be traced and generate spans when tracing utility statements is
> > already tricky enough.
>
> I think one hugely important benefit of using GUCs over sql comments
> is, that comments and named protocol-level prepared statements cannot
> be combined afaict. Since with named protocol level prepared
> statements no query is sent, only arguments. So there's no place to
> attach a comment too.
Вложения
On Wed, 10 Jan 2024 at 15:55, Anthonin Bonnefoy
<anthonin.bonnefoy@datadoghq.com> wrote:
> PREPARE test_prepared (text, integer) AS /*$1*/ SELECT $2;
> EXECUTE
test_prepared('dddbs=''postgres.db'',traceparent=''00-00000000000000000000000000000009-0000000000000009-01''',
> 1);

Wow, I had no idea that parameters could be expanded in comments. I'm
honestly wondering if that is supported on purpose.
2024-01 Commitfest.

Hi, This patch has a CF status of "Needs Review" [1], but it seems
there were CFbot test failures last time it was run [2]. Please have a
look and post an updated version if necessary.

======
[1] https://commitfest.postgresql.org/46/4456/
[2] https://cirrus-ci.com/task/5581154296791040

Kind Regards,
Peter Smith.
Hi,

The last CFbot failure was on pg_upgrade/002_pg_upgrade and doesn't
seem related to the patch.

#   Failed test 'regression tests pass'
#   at C:/cirrus/src/bin/pg_upgrade/t/002_pg_upgrade.pl line 212.
#          got: '256'
#     expected: '0'
# Looks like you failed 1 test of 18.

Given that the patch grew a bit in complexity and features, I've tried
to reduce it to a minimum to make reviewing easier. The goal is to
keep the scope focused for a first version while additional features
and changes could be handled afterwards.

For this version:
- Trace context can be propagated through SQLCommenter
- Sampling decision uses either a global sampling rate or on
SQLCommenter's sampled flag
- We generate spans for Planner, ExecutorRun and ExecutorFinish

What was put on hold for now:
- Generate spans from planstate. This means we don't need the change
in instrument.h to track the start of a node for the first version.
- Generate spans for parallel processes
- Using a GUC variable to propagate trace context
- Filtering sampling on queryId

With this, the current patch provides the core to:
- Generate, store and export spans with basic buffer management (drop
old spans when full or drop new spans when full)
- Keep variable strings in a separate file (a la pg_stat_statements)
- Track tracing state and top spans across nested execution levels

Thoughts on this approach?

On Mon, Jan 22, 2024 at 7:45 AM Peter Smith <smithpb2250@gmail.com> wrote:
>
> 2024-01 Commitfest.
>
> Hi, This patch has a CF status of "Needs Review" [1], but it seems
> there were CFbot test failures last time it was run [2]. Please have a
> look and post an updated version if necessary.
>
> ======
> [1] https://commitfest.postgresql.org/46/4456/
> [2] https://cirrus-ci.com/task/5581154296791040
>
> Kind Regards,
> Peter Smith.
Вложения
Hi,
The last CFbot failure was on pg_upgrade/002_pg_upgrade and doesn't
seem related to the patch.
# Failed test 'regression tests pass'
# at C:/cirrus/src/bin/pg_upgrade/t/002_pg_upgrade.pl line 212.
# got: '256'
# expected: '0'
# Looks like you failed 1 test of 18.
Given that the patch grew a bit in complexity and features, I've tried
to reduce it to a minimum to make reviewing easier. The goal is to
keep the scope focused for a first version while additional features
and changes could be handled afterwards.
For this version:
- Trace context can be propagated through SQLCommenter
- Sampling decision uses either a global sampling rate or on
SQLCommenter's sampled flag
- We generate spans for Planner, ExecutorRun and ExecutorFinish
What was put on hold for now:
- Generate spans from planstate. This means we don't need the change
in instrument.h to track the start of a node for the first version.
- Generate spans for parallel processes
- Using a GUC variable to propagate trace context
- Filtering sampling on queryId
With this, the current patch provides the core to:
- Generate, store and export spans with basic buffer management (drop
old spans when full or drop new spans when full)
- Keep variable strings in a separate file (a la pg_stat_statements)
- Track tracing state and top spans across nested execution levels
Thoughts on this approach?
On Mon, Jan 22, 2024 at 7:45 AM Peter Smith <smithpb2250@gmail.com> wrote:
>
> 2024-01 Commitfest.
>
> Hi, This patch has a CF status of "Needs Review" [1], but it seems
> there were CFbot test failures last time it was run [2]. Please have a
> look and post an updated version if necessary.
>
> ======
> [1] https://commitfest.postgresql.org/46/4456/
> [2] https://cirrus-ci.com/task/5581154296791040
>
> Kind Regards,
> Peter Smith.
Hi Anthonin,

I'm only now catching up on this thread. Very exciting feature!

My first observation is that you were able to implement this purely as
an extension, without any core changes. That's very cool, because:

- You don't need buy-in or blessing from anyone else. You can just put
this on github and people can immediately start using it.
- As an extension, it's not tied to the PostgreSQL release cycle. Users
can immediately start using it with existing PostgreSQL versions.

There are benefits to being in contrib/ vs. an extension outside the
PostgreSQL source tree, but there are significant downsides too.
Out-of-tree, you get more flexibility, and you can develop much faster.
I think this should live out-of-tree, at least until it's relatively
stable. By stable, I mean "not changing much", not that it's bug-free.

# Core changes

That said, there are a lot of things that would make sense to integrate
in PostgreSQL itself. For example:

- You're relying on various existing hooks, but it might be better to
have the 'begin_span'/'end_span' calls directly in PostgreSQL source
code in the right places. There are more places where spans might be
nice, like when performing a large sort in tuplesort.c to name one
example. Or even across every I/O; not sure how much overhead the spans
incur and how much we'd be willing to accept. 'begin_span'/'end_span'
could be new hooks that normally do nothing, but your extension would
implement them.

- Other extensions could include begin_span/end_span calls too. (It's
complicated for an extension to call functions in another extension.)

- Extensions like postgres_fdw could get the tracing context and
propagate it to the remote system too.

- How to pass the tracing context from the client? You went with
SQLCommenter and others proposed a GUC. A protocol extension would make
sense too. I can see merits to all of those. It probably would be good
to support multiple mechanisms, but some might need core changes. It
might be good to implement the mechanism for accepting trace context in
core. Without the extension, we could still include the trace ID in the
logs, for example.

# Further ideas

Some ideas on cool extra features on top of this:

- SQL functions to begin/end a span. Could be handy if you have
complicated PL/pgSQL functions, for example.
- Have spans over subtransactions.
- Include elog() messages in the traces. You might want to have a lower
elevel for what's included in traces; something like the
client_min_messages and log_min_messages settings.
- Include EXPLAIN plans in the traces.

# Comments on the implementation

There was discussion already on push vs pull model. Currently, you
collect the traces in memory / files, and require a client to poll them.
A push model is more common in applications that support tracing. If
Postgres could connect directly to the OTEL collector, you'd need one
fewer running component. You could keep the traces in backend-private
memory, no need to deal with shared memory and spilling to files.

Admittedly supporting the OTEL wire protocol is complicated unless you
use an existing library. Nevertheless, it might be a better tradeoff.
OTEL/HTTP with JSON format seems just about feasible to implement from
scratch. Or bite the bullet and use some external library. If this lives
as an extension, you have more freedom to rely on 3rd party libraries.

(If you publish this as an out-of-tree extension, then this is up to
you, of course, and doesn't need consensus here on pgsql-hackers)

# Suggested next steps with this

Here's how I'd suggest to proceed with this:

1. Publish this as an extension on github, as it is. I think you'll get
a lot of immediate adoption.

2. Start a new pgsql-hackers thread on in-core changes that would
benefit the extension. Write patches for them. I'm thinking of the
things I listed in the Core changes section above, but maybe there are
others.


PS. Does any other DBMS implement this? Any lessons to be learned from them?

--
Heikki Linnakangas
Neon (https://neon.tech)
PS. Does any other DBMS implement this? Any lessons to be learned from them?
Hi!

On Fri, Jan 26, 2024 at 1:43 PM Nikita Malakhov <hukutoc@gmail.com> wrote:
> It's a good idea to split a big patch into several smaller ones.
> But you've already implemented these features - you could provide them
> as sequential small patches (i.e. v13-0002-guc-context-propagation.patch and so on)

Keeping a consistent set of patches is going to be hard as any change
in the first patch would require rebasing that are likely going to
conflict. I haven't discarded the features but keeping them separated
could help with the discussion.

On Fri, Feb 2, 2024 at 1:41 PM Heikki Linnakangas <hlinnaka@iki.fi> wrote:
>
> Hi Anthonin,
>
> I'm only now catching up on this thread. Very exciting feature!
Thanks! And thanks for the comments.

> - You're relying on various existing hooks, but it might be better to
> have the 'begin_span'/'end_span' calls directly in PostgreSQL source
> code in the right places. There are more places where spans might be
> nice, like when performing a large sort in tuplesort.c to name one
> example. Or even across every I/O; not sure how much overhead the spans
> incur and how much we'd be willing to accept. 'begin_span'/'end_span'
> could be new hooks that normally do nothing, but your extension would
> implement them.

Having information that would only be available to tracing doesn't
sound great. It probably should be added to the core instrumentation
which could be then leveraged by tracing and other systems.
One of the features I initially implemented was to track parse start
and end. However, since only the post parse hook is available, I could
only infer when the parse started. Changing the core to track parse
start would make this more easier and it could be used by EXPLAIN and
pg_stat_statements.
In the end, I've tried to match what's done in pg_stat_statements
since the core idea is the same, except pg_tracing outputs spans
instead of statistics.

> - How to pass the tracing context from the client? You went with
> SQLCommenter and others proposed a GUC. A protocol extension would make
> sense too. I can see merits to all of those. It probably would be good
> to support multiple mechanisms, but some might need core changes. It
> might be good to implement the mechanism for accepting trace context in
> core. Without the extension, we could still include the trace ID in the
> logs, for example.

I went with SQLCommenter for the initial implementation since it has
the benefit of already being implemented and working out of the box.
Jelte has an ongoing patch to add the possibility to modify GUC values
through a protocol message [1]. I've tested it and it worked well
without adding too much complexity in pg_tracing. I imagine having a
dedicated traceparent GUC variable could be also used in the core to
propagate in the logs and other places.

> - Include EXPLAIN plans in the traces.
This was already implemented in the first versions (or rather, the
planstate was translated to spans) of the patch. I've removed it in
the latest patch as it was contributing to 50% of the code and also
required a core change, namely a change in instrument.c to track the
first start of a node. Though if you were thinking of the raw EXPLAIN
ANALYZE text dumped as a span metadata, that could be doable.

> # Comments on the implementation
>
> There was discussion already on push vs pull model. Currently, you
> collect the traces in memory / files, and require a client to poll them.
> A push model is more common in applications that support tracing. If
> Postgres could connect directly to the OTEL collector, you'd need one
> fewer running component. You could keep the traces in backend-private
> memory, no need to deal with shared memory and spilling to files.

PostgreSQL metrics are currently exposed through tables like pg_stat_*
and users likely have collectors pulling those metrics (like OTEL
PostgreSQL Receiver [2]). Having this collector also pulling traces
would keep the logic in a single place and would avoid a situation
where both pull and push is used.

> 2. Start a new pgsql-hackers thread on in-core changes that would
> benefit the extension. Write patches for them. I'm thinking of the
> things I listed in the Core changes section above, but maybe there are
> others.
I already have an ongoing patch (more support for extended protocol in
psql [3] needed for tests) and plan to do others (the parse changes
I've mentioned). Though I also don't want to spread myself too thin.


[1]: https://commitfest.postgresql.org/46/4736/
[2]: https://github.com/open-telemetry/opentelemetry-collector-contrib/blob/main/receiver/postgresqlreceiver/README.md
[3]: https://commitfest.postgresql.org/46/4650/

On Fri, Feb 2, 2024 at 5:42 PM Jan Katins <jasc@gmx.net> wrote:
>
> Hi!
>
> On Fri, 2 Feb 2024 at 13:41, Heikki Linnakangas <hlinnaka@iki.fi> wrote:
>>
>> PS. Does any other DBMS implement this? Any lessons to be learned from them?
>
>
> Mysql 8.3 has open telemetrie component, so very fresh:
>
> https://dev.mysql.com/doc/refman/8.3/en/telemetry-trace-install.html
> https://blogs.oracle.com/mysql/post/mysql-telemetry-tracing-with-oci-apm
>
> Mysql ppl are already waiting for PG to catch up (in German): https://chaos.social/@isotopp/111421160719915296 :-)
>
> Best regards,
>
> Jan
Hi,

On 2024-02-09 19:46:58 +0300, Nikita Malakhov wrote:
> I agree with Heikki on most topics and especially the one he recommended
> to publish your extension on GitHub, this tool is very promising for highly
> loaded
> systems, you will get a lot of feedback very soon.
>
> I'm curious about SpinLock - it is recommended for very short operations,
> taking up to several instructions, and docs say that for longer ones it
> will be
> too expensive, and recommends using LWLock. Why have you chosen SpinLock?
> Does it have some benefits here?

Indeed - e.g. end_tracing() looks to hold the spinlock for far too long for
spinlocks to be appropriate. Use an lwlock.

Random stuff I noticed while skimming:
- pg_tracing.c should include postgres.h as the first thing

- afaict none of the use of volatile is required, spinlocks have been barriers
  for a long time now

- you acquire the spinlock for single increments of n_writers, perhaps that
  could become an atomic, to reduce contention?

- I don't think it's a good idea to do memory allocations in the middle of a
  PG_CATCH. If the error was due to out-of-memory, you'll throw another error.


Greetings,

Andres Freund
Hi all!

Thanks for the reviews and comments.

> - pg_tracing.c should include postgres.h as the first thing
Will do.

> afaict none of the use of volatile is required, spinlocks have been barriers
> for a long time now
Got it, I will remove them. I've been mimicking what was done in
pg_stat_statements and all spinlocks are done on volatile variables
[1].

> - I don't think it's a good idea to do memory allocations in the middle of a
> PG_CATCH. If the error was due to out-of-memory, you'll throw another error.
Good point. I was wondering what were the risks of generating spans
for errors. I will try to find a better way to handle this.

To give a quick update: following Heikki's suggestion, I'm currently
working on getting pg_tracing as a separate extension on github. I
will send an update when it's ready.

[1]: https://github.com/postgres/postgres/blob/master/contrib/pg_stat_statements/pg_stat_statements.c#L2000

On Fri, Feb 9, 2024 at 7:50 PM Andres Freund <andres@anarazel.de> wrote:
>
> Hi,
>
> On 2024-02-09 19:46:58 +0300, Nikita Malakhov wrote:
> > I agree with Heikki on most topics and especially the one he recommended
> > to publish your extension on GitHub, this tool is very promising for highly
> > loaded
> > systems, you will get a lot of feedback very soon.
> >
> > I'm curious about SpinLock - it is recommended for very short operations,
> > taking up to several instructions, and docs say that for longer ones it
> > will be
> > too expensive, and recommends using LWLock. Why have you chosen SpinLock?
> > Does it have some benefits here?
>
> Indeed - e.g. end_tracing() looks to hold the spinlock for far too long for
> spinlocks to be appropriate. Use an lwlock.
>
> Random stuff I noticed while skimming:
> - pg_tracing.c should include postgres.h as the first thing
>
> - afaict none of the use of volatile is required, spinlocks have been barriers
>   for a long time now
>
> - you acquire the spinlock for single increments of n_writers, perhaps that
>   could become an atomic, to reduce contention?
>
> - I don't think it's a good idea to do memory allocations in the middle of a
>   PG_CATCH. If the error was due to out-of-memory, you'll throw another error.
>
>
> Greetings,
>
> Andres Freund
> - I don't think it's a good idea to do memory allocations in the middle of a
> PG_CATCH. If the error was due to out-of-memory, you'll throw another error.
Good point. I was wondering what were the risks of generating spans
for errors. I will try to find a better way to handle this.
Hi Anthonin,

> [...]
>
> The usual approach is to have pre-allocated memory. This must actually be written (zeroed usually) or it might be
lazilyallocated only on page fault. And it can't be copy on write memory allocated once in postmaster startup then
inheritedby fork.

>
> That imposes an overhead for every single postgres backend. So maybe there's a better solution.

It looks like the patch rotted a bit, see cfbot. Could you please
submit an updated version?

Best regards,
Aleksander Alekseev (wearing co-CFM hat)
I've rebased and updated the patch with some fixes:
- Removed volatile
- Switched from spinlock to LWLock and removed n_writer
- Moved postgres.h as first header on all files
- Removed possible allocations in PG_CATCH. Though I would probably need to run some more thorough tests on this
I should also have the GitHub repository version of the extension ready this week.
Hi Anthonin,
> [...]
>
> The usual approach is to have pre-allocated memory. This must actually be written (zeroed usually) or it might be lazily allocated only on page fault. And it can't be copy on write memory allocated once in postmaster startup then inherited by fork.
>
> That imposes an overhead for every single postgres backend. So maybe there's a better solution.
It looks like the patch rotted a bit, see cfbot. Could you please
submit an updated version?
Best regards,
Aleksander Alekseev (wearing co-CFM hat)