POC: Extension for adding distributed tracing - pg_tracing
| От | Anthonin Bonnefoy |
|---|---|
| Тема | POC: Extension for adding distributed tracing - pg_tracing |
| Дата | |
| Msg-id | CAO6_XqoADFOMB6J+Vc-nhh-ck3=eyvRwX57_ZcGMkyBWEGWTDA@mail.gmail.com обсуждение исходный текст |
| Ответы |
Re: POC: Extension for adding distributed tracing - pg_tracing
|
| Список | pgsql-hackers |
Hi hackers,
Currently, most distributed tracing solutions only provide details from the client's drivers point of view. We don't have visibility when the query reached the database and how the query was processed.
The goal of this project is to provide distributed tracing within the database to provide more insights on a query execution as an extension. The idea and architecture is heavily inspired by pg_stat_statements and auto_explain.
I have a working prototype of a pg_tracing extension and wanted some feedback on the design and architecture.
Some definitions: (paraphrased from opentelemetry https://opentelemetry.io/docs/concepts/signals/traces/)
A trace groups multiple spans and a span represents a single specific operation. It is defined by:
- a trace_id
- a spanid (randomly generated int64)
- a name
- a parent id (a span can have children)
- a start timestamp
- a duration
- Attributes (key value metadatas)
We will use attributes to propagate the query's instrumentation details: buffer usage, jit, wal usage, first tuple, plan cost...
Triggering a trace:
===============
We rely on https://google.github.io/sqlcommenter/ to propagate trace information.
A query with sqlcommenter will look like: /*dddbs='postgres.db',traceparent='00-00000000000000000000000000000009-0000000000000005-01'*/ select 1;
The traceparent fields are detailed in https://www.w3.org/TR/trace-context/#traceparent-header-field-values
The 3 fields are
00000000000000000000000000000009: trace id
0000000000000005: parent id
01: trace flags (01 == sampled)
If the query is sampled, we instrument the query and generate spans for the following operations:
- Query Span: The top span for a query. They are created after extracting the traceid from traceparent or to represent a nested query. We always have at least one. We may have more if we have a nested query.
- Planner: We track the time spent in the planner and report the planner counters
- Executor: We trace the different steps of the Executor: Start, Run, Finish and End
- Node Span: Created from planstate. The name is extracted from the node type (IndexScan, SeqScan). For the operation name, we generate something similar to the explain.
Storing spans:
===============
Spans are stored in a shared memory buffer. The buffer size is fixed and if it is full, no further spans are generated until the buffer is freed.
We store multiple information with variable sized text in the spans: names, parameter values...
To avoid keeping those in the shared memory, we store them in an external file (similar to pg_stat_statements query text).
Processing spans:
===============
Traces need to be sent to a trace collector. We offload this logic to an external application which will:
- Collect the spans through a new pg_tracing_spans() function output
- Built spans in any format specific to the targeted trace collector (opentelemetry, datadog...)
- Send it to the targeted trace collector using the appropriate protocol (gRPC, http...)
I have an example of a span forwarder that I've been using in my tests available here: https://gist.github.com/bonnefoa/6ed24520bdac026d6a6a6992d308bd50.
This setup permits a lot of flexibility:
- The postgres extension doesn't need any vendor specific knowledge
- The trace forwarder can reuse existing libraries and any languages to send spans
Buffer management:
===============
I've tried to keep the memory management simple. Creating spans will add new elements to the shared_spans buffer.
Once a span is forwarded, there's no need to keep it in the shared memory.
Thus, pg_tracing_spans has a "consume" parameter which will completely empty the shared buffers when called by the forwarder.
If we have a regularly full buffers, then we can:
- increase forwarder's frequency
- increase the shared buffer size
- decrease the amount of generated spans
Statistics are available through pg_tracing_info to keep track of the number of generated spans and dropped events.
Overhead:
===============
I haven't run benchmarks yet, however, we will have multiple ways to control the overhead.
Traces rely heavily on sampling to keep the overhead low: we want extensive information on representative samples of our queries.
For now, we leave the sampling decision to the caller (through the sampled flag) but I will add an additional parameter to allow additional sampling if the rate of traced queries is too high.
Stopping tracing when we have a full buffer is also a good safeguard. If an application is misconfigured and starts sampling every queries, this will stop all tracing and won't impact query performances.
Query Instrumentation:
===============
I have been able to rely on most of existing query instrumentation except for one missing information: I needed to know the start of a node as we currently only have the first tuple and the duration. I added firsttime to Instrumentation. This is the only change done outside the extension's code.
Current status:
===============
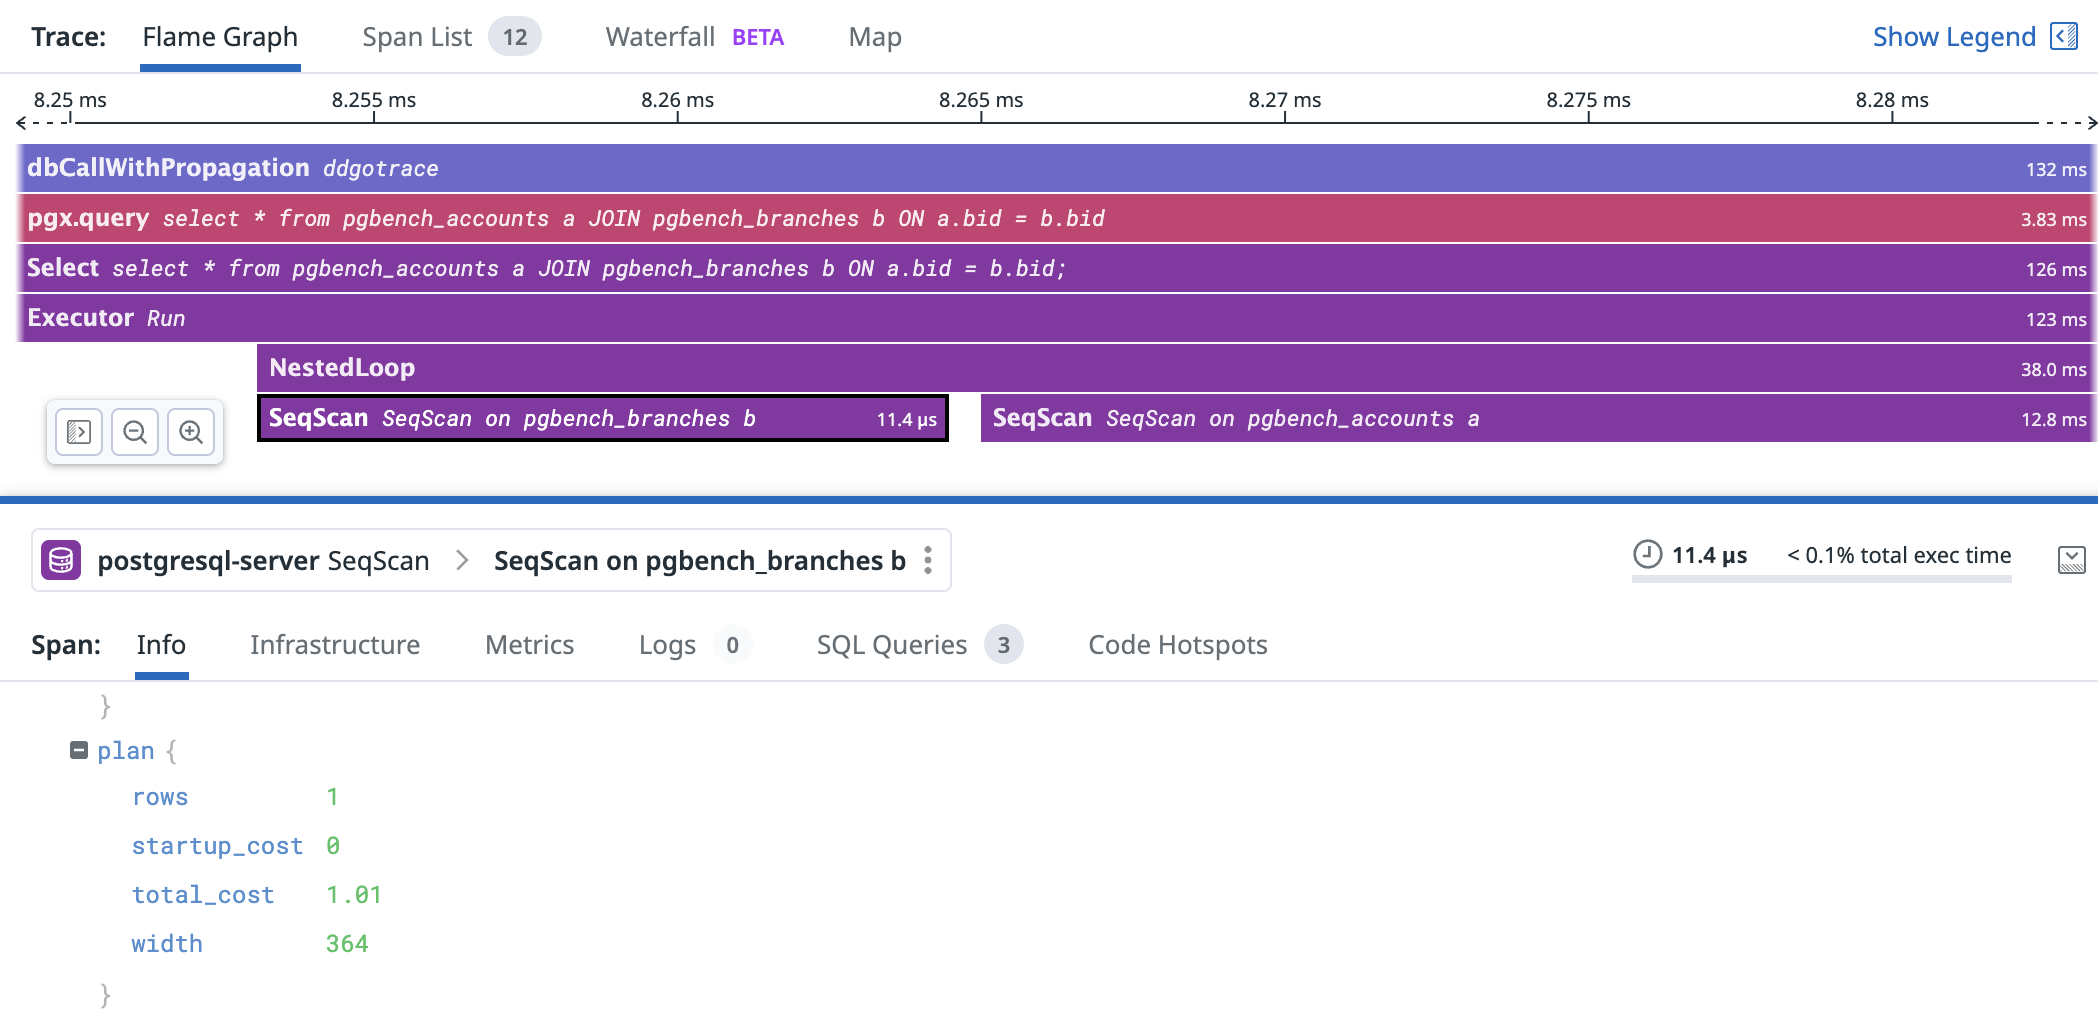
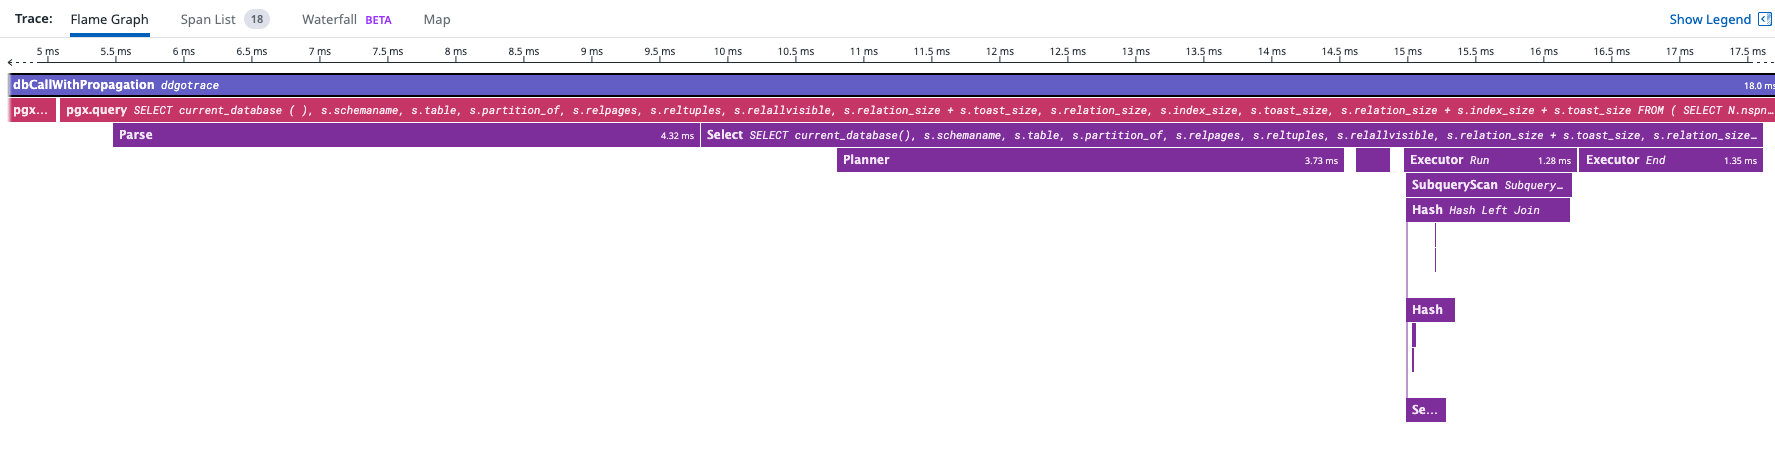
The current code is able to generate spans which once forwarded to the trace collector, I was able to get traces with execution details with similar amount of information that an explain (analyze, buffers) would provide. I have provided screenshots of the result.
There's a lot of work left in cleaning, commenting, handling edge cases and adding tests.
Thoughts and feedback are welcome.
Regards,
Anthonin Bonnefoy
Вложения
В списке pgsql-hackers по дате отправления: