Обсуждение: Parallel Seq Scan vs kernel read ahead
Hello hackers,

Parallel sequential scan relies on the kernel detecting sequential
access, but we don't make the job easy.  The resulting striding
pattern works terribly on strict next-block systems like FreeBSD UFS,
and degrades rapidly when you add too many workers on sliding window
systems like Linux.

Demonstration using FreeBSD on UFS on a virtual machine, taking ball
park figures from iostat:

  create table t as select generate_series(1, 200000000)::int i;

  set max_parallel_workers_per_gather = 0;
  select count(*) from t;
  -> execution time 13.3s, average read size = ~128kB, ~500MB/s

  set max_parallel_workers_per_gather = 1;
  select count(*) from t;
  -> execution time 24.9s, average read size = ~32kB, ~250MB/s

Note the small read size, which means that there was no read
clustering happening at all: that's the logical block size of this
filesystem.

That explains some complaints I've heard about PostgreSQL performance
on that filesystem: parallel query destroys I/O performance.

As a quick experiment, I tried teaching the block allocated to
allocate ranges of up 64 blocks at a time, ramping up incrementally,
and ramping down at the end, and I got:

  set max_parallel_workers_per_gather = 1;
  select count(*) from t;
  -> execution time 7.5s, average read size = ~128kB, ~920MB/s

  set max_parallel_workers_per_gather = 3;
  select count(*) from t;
  -> execution time 5.2s, average read size = ~128kB, ~1.2GB/s

I've attached the quick and dirty patch I used for that.
Вложения
On Wed, May 20, 2020 at 7:24 AM Thomas Munro <thomas.munro@gmail.com> wrote:
>
> Hello hackers,
>
> Parallel sequential scan relies on the kernel detecting sequential
> access, but we don't make the job easy.  The resulting striding
> pattern works terribly on strict next-block systems like FreeBSD UFS,
> and degrades rapidly when you add too many workers on sliding window
> systems like Linux.
>
> Demonstration using FreeBSD on UFS on a virtual machine, taking ball
> park figures from iostat:
>
>   create table t as select generate_series(1, 200000000)::int i;
>
>   set max_parallel_workers_per_gather = 0;
>   select count(*) from t;
>   -> execution time 13.3s, average read size = ~128kB, ~500MB/s
>
>   set max_parallel_workers_per_gather = 1;
>   select count(*) from t;
>   -> execution time 24.9s, average read size = ~32kB, ~250MB/s
>
> Note the small read size, which means that there was no read
> clustering happening at all: that's the logical block size of this
> filesystem.
>
> That explains some complaints I've heard about PostgreSQL performance
> on that filesystem: parallel query destroys I/O performance.
>
> As a quick experiment, I tried teaching the block allocated to
> allocate ranges of up 64 blocks at a time, ramping up incrementally,
> and ramping down at the end, and I got:
>

Good experiment.  IIRC, we have discussed a similar idea during the
development of this feature but we haven't seen any better results by
allocating in ranges on the systems we have tried.  So, we want with
the current approach which is more granular and seems to allow better
parallelism.  I feel we need to ensure that we don't regress
parallelism in existing cases, otherwise, the idea sounds promising to
me.

--
With Regards,
Amit Kapila.
EnterpriseDB: http://www.enterprisedb.com
On Wed, May 20, 2020 at 2:23 PM Amit Kapila <amit.kapila16@gmail.com> wrote:
> Good experiment.  IIRC, we have discussed a similar idea during the
> development of this feature but we haven't seen any better results by
> allocating in ranges on the systems we have tried.  So, we want with
> the current approach which is more granular and seems to allow better
> parallelism.  I feel we need to ensure that we don't regress
> parallelism in existing cases, otherwise, the idea sounds promising to
> me.

Yeah, Linux seems to do pretty well at least with smallish numbers of
workers, and when you use large numbers you can probably tune your way
out of the problem.  ZFS seems to do fine.  I wonder how well the
other OSes cope.
Em qua., 20 de mai. de 2020 às 00:09, Thomas Munro <thomas.munro@gmail.com> escreveu:
On Wed, May 20, 2020 at 2:23 PM Amit Kapila <amit.kapila16@gmail.com> wrote:
> Good experiment. IIRC, we have discussed a similar idea during the
> development of this feature but we haven't seen any better results by
> allocating in ranges on the systems we have tried. So, we want with
> the current approach which is more granular and seems to allow better
> parallelism. I feel we need to ensure that we don't regress
> parallelism in existing cases, otherwise, the idea sounds promising to
> me.
Yeah, Linux seems to do pretty well at least with smallish numbers of
workers, and when you use large numbers you can probably tune your way
out of the problem. ZFS seems to do fine. I wonder how well the
other OSes cope.
Windows 10 (64bits, i5, 8GB, SSD)
postgres=# set max_parallel_workers_per_gather = 0;
SET
Time: 2,537 ms
postgres=# select count(*) from t;
count
-----------
200000000
(1 row)
Time: 47767,916 ms (00:47,768)
postgres=# set max_parallel_workers_per_gather = 1;
SET
Time: 4,889 ms
postgres=# select count(*) from t;
count
-----------
200000000
(1 row)
Time: 32645,448 ms (00:32,645)
SET
Time: 2,537 ms
postgres=# select count(*) from t;
count
-----------
200000000
(1 row)
Time: 47767,916 ms (00:47,768)
postgres=# set max_parallel_workers_per_gather = 1;
SET
Time: 4,889 ms
postgres=# select count(*) from t;
count
-----------
200000000
(1 row)
Time: 32645,448 ms (00:32,645)
How display " -> execution time 5.2s, average read size ="?
regards,
Ranier VIlela
On Wed, May 20, 2020 at 11:03 PM Ranier Vilela <ranier.vf@gmail.com> wrote:
> Time: 47767,916 ms (00:47,768)
> Time: 32645,448 ms (00:32,645)

Just to make sure kernel caching isn't helping here, maybe try making
the table 2x or 4x bigger?  My test was on a virtual machine with only
4GB RAM, so the table couldn't be entirely cached.

> How display " -> execution time 5.2s, average read size ="?

Execution time is what you showed, and average read size should be
inside the Windows performance window somewhere (not sure what it's
called).
Em qua., 20 de mai. de 2020 às 18:49, Thomas Munro <thomas.munro@gmail.com> escreveu:
On Wed, May 20, 2020 at 11:03 PM Ranier Vilela <ranier.vf@gmail.com> wrote:
> Time: 47767,916 ms (00:47,768)
> Time: 32645,448 ms (00:32,645)
Just to make sure kernel caching isn't helping here, maybe try making
the table 2x or 4x bigger? My test was on a virtual machine with only
4GB RAM, so the table couldn't be entirely cached.
4x bigger.
Postgres defaults settings.
postgres=# create table t as select generate_series(1, 800000000)::int i;
SELECT 800000000
postgres=# \timing
Timing is on.
postgres=# set max_parallel_workers_per_gather = 0;
SET
Time: 8,622 ms
postgres=# select count(*) from t;
count
-----------
800000000
(1 row)
Time: 227238,445 ms (03:47,238)
postgres=# set max_parallel_workers_per_gather = 1;
SET
Time: 20,975 ms
postgres=# select count(*) from t;
count
-----------
800000000
(1 row)
Time: 138027,351 ms (02:18,027)
Ranier Vilela
On Thu, May 21, 2020 at 11:15 AM Ranier Vilela <ranier.vf@gmail.com> wrote:
> postgres=# set max_parallel_workers_per_gather = 0;
> Time: 227238,445 ms (03:47,238)
> postgres=# set max_parallel_workers_per_gather = 1;
> Time: 138027,351 ms (02:18,027)

Ok, so it looks like NT/NTFS isn't suffering from this problem.
Thanks for testing!
Em qua., 20 de mai. de 2020 às 20:48, Thomas Munro <thomas.munro@gmail.com> escreveu:
On Thu, May 21, 2020 at 11:15 AM Ranier Vilela <ranier.vf@gmail.com> wrote:
> postgres=# set max_parallel_workers_per_gather = 0;
> Time: 227238,445 ms (03:47,238)
> postgres=# set max_parallel_workers_per_gather = 1;
> Time: 138027,351 ms (02:18,027)
Ok, so it looks like NT/NTFS isn't suffering from this problem.
Thanks for testing!
Maybe it wasn’t clear, the tests were done with your patch applied.
regards,
Ranier Vilela
On Thu, May 21, 2020 at 11:51 AM Ranier Vilela <ranier.vf@gmail.com> wrote:
> Em qua., 20 de mai. de 2020 às 20:48, Thomas Munro <thomas.munro@gmail.com> escreveu:
>> On Thu, May 21, 2020 at 11:15 AM Ranier Vilela <ranier.vf@gmail.com> wrote:
>> > postgres=# set max_parallel_workers_per_gather = 0;
>> > Time: 227238,445 ms (03:47,238)
>> > postgres=# set max_parallel_workers_per_gather = 1;
>> > Time: 138027,351 ms (02:18,027)
>>
>> Ok, so it looks like NT/NTFS isn't suffering from this problem.
>> Thanks for testing!
>
> Maybe it wasn’t clear, the tests were done with your patch applied.

Oh!  And how do the times look without it?
Em qua., 20 de mai. de 2020 às 21:03, Thomas Munro <thomas.munro@gmail.com> escreveu:
On Thu, May 21, 2020 at 11:51 AM Ranier Vilela <ranier.vf@gmail.com> wrote:
> Em qua., 20 de mai. de 2020 às 20:48, Thomas Munro <thomas.munro@gmail.com> escreveu:
>> On Thu, May 21, 2020 at 11:15 AM Ranier Vilela <ranier.vf@gmail.com> wrote:
>> > postgres=# set max_parallel_workers_per_gather = 0;
>> > Time: 227238,445 ms (03:47,238)
>> > postgres=# set max_parallel_workers_per_gather = 1;
>> > Time: 138027,351 ms (02:18,027)
>>
>> Ok, so it looks like NT/NTFS isn't suffering from this problem.
>> Thanks for testing!
>
> Maybe it wasn’t clear, the tests were done with your patch applied.
Oh! And how do the times look without it?
Vanila Postgres (latest)
create table t as select generate_series(1, 800000000)::int i;
set max_parallel_workers_per_gather = 0;
Time: 210524,317 ms (03:30,524)
set max_parallel_workers_per_gather = 1;
Time: 146982,737 ms (02:26,983)
regards,
Ranier Vilela
On Thu, May 21, 2020 at 1:38 PM Ranier Vilela <ranier.vf@gmail.com> wrote:
>> >> On Thu, May 21, 2020 at 11:15 AM Ranier Vilela <ranier.vf@gmail.com> wrote:
>> >> > postgres=# set max_parallel_workers_per_gather = 0;
>> >> > Time: 227238,445 ms (03:47,238)
>> >> > postgres=# set max_parallel_workers_per_gather = 1;
>> >> > Time: 138027,351 ms (02:18,027)

> Vanila Postgres (latest)
>
> create table t as select generate_series(1, 800000000)::int i;
>  set max_parallel_workers_per_gather = 0;
> Time: 210524,317 ms (03:30,524)
> set max_parallel_workers_per_gather = 1;
> Time: 146982,737 ms (02:26,983)

Thanks.  So it seems like Linux, Windows and anything using ZFS are
OK, which probably explains why we hadn't heard complaints about it.
On Thu, 21 May 2020 at 14:32, Thomas Munro <thomas.munro@gmail.com> wrote:
> Thanks.  So it seems like Linux, Windows and anything using ZFS are
> OK, which probably explains why we hadn't heard complaints about it.

I tried out a different test on a Windows 8.1 machine I have here.  I
was concerned that the test that was used here ends up with tuples
that are too narrow and that the executor would spend quite a bit of
time going between nodes and performing the actual aggregation.  I
thought it might be good to add some padding so that there are far
fewer tuples on the page.

I ended up with:

create table t (a int, b text);
-- create a table of 100GB in size.
insert into t select x,md5(x::text) from
generate_series(1,1000000*1572.7381809)x; -- took 1 hr 18 mins
vacuum freeze t;

query = select count(*) from t;
Disk = Samsung SSD 850 EVO mSATA 1TB.

Master:
workers = 0 : Time: 269104.281 ms (04:29.104)  380MB/s
workers = 1 : Time: 741183.646 ms (12:21.184)  138MB/s
workers = 2 : Time: 656963.754 ms (10:56.964)  155MB/s

Patched:

workers = 0 : Should be the same as before as the code for this didn't change.
workers = 1 : Time: 300299.364 ms (05:00.299) 340MB/s
workers = 2 : Time: 270213.726 ms (04:30.214) 379MB/s

(A better query would likely have been just: SELECT * FROM t WHERE a =
1; but I'd run the test by the time I thought of that.)

So, this shows that Windows, at least 8.1, does suffer from this too.

For the patch. I know you just put it together quickly, but I don't
think you can do that ramp up the way you have. It looks like there's
a risk of torn reads and torn writes and I'm unsure how much that
could affect the test results here. It looks like there's a risk that
a worker gets some garbage number of pages to read rather than what
you think it will. Also, I also don't quite understand the need for a
ramp-up in pages per serving. Shouldn't you instantly start at some
size and hold that, then only maybe ramp down at the end so that
workers all finish at close to the same time?  However, I did have
other ideas which I'll explain below.

From my previous work on that function to add the atomics. I did think
that it would be better to dish out more than 1 page at a time.
However, there is the risk that the workload is not evenly distributed
between the workers.  My thoughts were that we could divide the total
pages by the number of workers then again by 100 and dish out blocks
based on that. That way workers will get about 100th of their fair
share of pages at once, so assuming there's an even amount of work to
do per serving of pages, then the last worker should only run on at
most 1% longer.  Perhaps that 100 should be 1000, then the run on time
for the last worker is just 0.1%.  Perhaps the serving size can also
be capped at some maximum like 64. We'll certainly need to ensure it's
at least 1!   I imagine that will eliminate the need for any ramp down
of pages per serving near the end of the scan.

David
On Thu, 21 May 2020 at 17:06, David Rowley <dgrowleyml@gmail.com> wrote:
> For the patch. I know you just put it together quickly, but I don't
> think you can do that ramp up the way you have. It looks like there's
> a risk of torn reads and torn writes and I'm unsure how much that
> could affect the test results here.

Oops. On closer inspection, I see that memory is per worker, not
global to the scan.
On Fri, May 22, 2020 at 10:00 AM David Rowley <dgrowleyml@gmail.com> wrote:
> On Thu, 21 May 2020 at 17:06, David Rowley <dgrowleyml@gmail.com> wrote:
> > For the patch. I know you just put it together quickly, but I don't
> > think you can do that ramp up the way you have. It looks like there's
> > a risk of torn reads and torn writes and I'm unsure how much that
> > could affect the test results here.
>
> Oops. On closer inspection, I see that memory is per worker, not
> global to the scan.

Right, I think it's safe.  I think you were probably right that
ramp-up isn't actually useful though, it's only the end of the scan
that requires special treatment so we don't get unfair allocation as
the work runs out, due to course grain.  I suppose that even if you
have a scheme that falls back to fine grained allocation for the final
N pages, it's still possible that a highly distracted process (most
likely the leader given its double duties) can finish up sitting on a
large range of pages and eventually have to process them all at the
end after the other workers have already knocked off and gone for a
pint.
Hi Thomas,
Some more data points:
create table t_heap as select generate_series(1, 100000000) i;
Query: select count(*) from t_heap;
shared_buffers=32MB (so that I don't have to clear buffers, OS page
cache)
OS: FreeBSD 12.1 with UFS on GCP
4 vCPUs, 4GB RAM Intel Skylake
22G Google PersistentDisk
Time is measured with \timing on.
Without your patch:
max_parallel_workers_per_gather Time(seconds)
0 33.88s
1 57.62s
2 62.01s
6 222.94s
With your patch:
max_parallel_workers_per_gather Time(seconds)
0 29.04s
1 29.17s
2 28.78s
6 291.27s
I checked with explain analyze to ensure that the number of workers
planned = max_parallel_workers_per_gather
Apart from the last result (max_parallel_workers_per_gather=6), all
the other results seem favorable.
Could the last result be down to the fact that the number of workers
planned exceeded the number of vCPUs?
I also wanted to evaluate Zedstore with your patch.
I used the same setup as above.
No discernible difference though, maybe I'm missing something:
Without your patch:
max_parallel_workers_per_gather Time(seconds)
0 25.86s
1 15.70s
2 12.60s
6 12.41s
With your patch:
max_parallel_workers_per_gather Time(seconds)
0 26.96s
1 15.73s
2 12.46s
6 12.10s
--
Soumyadeep
On Thu, May 21, 2020 at 3:28 PM Thomas Munro <thomas.munro@gmail.com> wrote:
On Fri, May 22, 2020 at 10:00 AM David Rowley <dgrowleyml@gmail.com> wrote:
> On Thu, 21 May 2020 at 17:06, David Rowley <dgrowleyml@gmail.com> wrote:
> > For the patch. I know you just put it together quickly, but I don't
> > think you can do that ramp up the way you have. It looks like there's
> > a risk of torn reads and torn writes and I'm unsure how much that
> > could affect the test results here.
>
> Oops. On closer inspection, I see that memory is per worker, not
> global to the scan.
Right, I think it's safe. I think you were probably right that
ramp-up isn't actually useful though, it's only the end of the scan
that requires special treatment so we don't get unfair allocation as
the work runs out, due to course grain. I suppose that even if you
have a scheme that falls back to fine grained allocation for the final
N pages, it's still possible that a highly distracted process (most
likely the leader given its double duties) can finish up sitting on a
large range of pages and eventually have to process them all at the
end after the other workers have already knocked off and gone for a
pint.
On Fri, May 22, 2020 at 1:14 PM Soumyadeep Chakraborty
<sochakraborty@pivotal.io> wrote:
> Some more data points:

Thanks!

> max_parallel_workers_per_gather    Time(seconds)
>                               0           29.04s
>                               1           29.17s
>                               2           28.78s
>                               6          291.27s
>
> I checked with explain analyze to ensure that the number of workers
> planned = max_parallel_workers_per_gather
>
> Apart from the last result (max_parallel_workers_per_gather=6), all
> the other results seem favorable.
> Could the last result be down to the fact that the number of workers
> planned exceeded the number of vCPUs?

Interesting.  I guess it has to do with patterns emerging from various
parameters like that magic number 64 I hard coded into the test patch,
and other unknowns in your storage stack.  I see a small drop off that
I can't explain yet, but not that.

> I also wanted to evaluate Zedstore with your patch.
> I used the same setup as above.
> No discernible difference though, maybe I'm missing something:

It doesn't look like it's using table_block_parallelscan_nextpage() as
a block allocator so it's not affected by the patch.  It has its own
thing zs_parallelscan_nextrange(), which does
pg_atomic_fetch_add_u64(&pzscan->pzs_allocatedtids,
ZS_PARALLEL_CHUNK_SIZE), and that macro is 0x100000.
On Tue, May 19, 2020 at 10:23 PM Amit Kapila <amit.kapila16@gmail.com> wrote:
> Good experiment.  IIRC, we have discussed a similar idea during the
> development of this feature but we haven't seen any better results by
> allocating in ranges on the systems we have tried.  So, we want with
> the current approach which is more granular and seems to allow better
> parallelism.  I feel we need to ensure that we don't regress
> parallelism in existing cases, otherwise, the idea sounds promising to
> me.

I think there's a significant difference. The idea I remember being
discussed at the time was to divide the relation into equal parts at
the very start and give one part to each worker. I think that carries
a lot of risk of some workers finishing much sooner than others. This
idea, AIUI, is to divide the relation into chunks that are small
compared to the size of the relation, but larger than 1 block. That
carries some risk of an unequal division of work, as has already been
noted, but it's much less, especially if we use smaller chunk sizes
once we get close to the end, as proposed here.

--
Robert Haas
EnterpriseDB: http://www.enterprisedb.com
The Enterprise PostgreSQL Company
On Thu, May 21, 2020 at 6:28 PM Thomas Munro <thomas.munro@gmail.com> wrote:
> Right, I think it's safe.  I think you were probably right that
> ramp-up isn't actually useful though, it's only the end of the scan
> that requires special treatment so we don't get unfair allocation as
> the work runs out, due to course grain.

The ramp-up seems like it might be useful if the query involves a LIMIT.

--
Robert Haas
EnterpriseDB: http://www.enterprisedb.com
The Enterprise PostgreSQL Company
On Sat, May 23, 2020 at 12:00 AM Robert Haas <robertmhaas@gmail.com> wrote:
>
> On Tue, May 19, 2020 at 10:23 PM Amit Kapila <amit.kapila16@gmail.com> wrote:
> > Good experiment.  IIRC, we have discussed a similar idea during the
> > development of this feature but we haven't seen any better results by
> > allocating in ranges on the systems we have tried.  So, we want with
> > the current approach which is more granular and seems to allow better
> > parallelism.  I feel we need to ensure that we don't regress
> > parallelism in existing cases, otherwise, the idea sounds promising to
> > me.
>
> I think there's a significant difference. The idea I remember being
> discussed at the time was to divide the relation into equal parts at
> the very start and give one part to each worker.
>

I have checked the archives and found that we have done some testing
by allowing each worker to work on a block-by-block basis and by
having a fixed number of chunks for each worker.  See the results [1]
(the program used is attached in another email [2]).  The conclusion
was that we didn't find much difference with any of those approaches.
Now, the reason could be that because we have tested on a machine (I
think it was hydra (Power-7)) where the chunk-size doesn't matter but
I think it can show some difference in the machines on which Thomas
and David are testing.  At that time there was also a discussion to
chunk on the basis of "each worker processes one 1GB-sized segment"
which Tom and Stephen seem to support [3].  I think an idea to divide
the relation into segments based on workers for a parallel scan has
been used by other database (DynamoDB) as well [4] so it is not
completely without merit.  I understand that larger sized chunks can
lead to unequal work distribution but they have their own advantages,
so we might want to get the best of both the worlds where in the
beginning we have larger sized chunks and then slowly reduce the
chunk-size towards the end of the scan.  I am not sure what is the
best thing to do here but maybe some experiments can shed light on
this mystery.


[1] - https://www.postgresql.org/message-id/CAA4eK1JHCmN2X1LjQ4bOmLApt%2BbtOuid5Vqqk5G6dDFV69iyHg%40mail.gmail.com
[2] - https://www.postgresql.org/message-id/CAA4eK1JyVNEBE8KuxKd3bJhkG6tSbpBYX_%2BZtP34ZSTCSucA1A%40mail.gmail.com
[3] - https://www.postgresql.org/message-id/30549.1422459647%40sss.pgh.pa.us
[4] - https://docs.aws.amazon.com/amazondynamodb/latest/developerguide/Scan.html#Scan.ParallelScan

--
With Regards,
Amit Kapila.
EnterpriseDB: http://www.enterprisedb.com
On Sat, 23 May 2020 at 06:31, Robert Haas <robertmhaas@gmail.com> wrote:
>
> On Thu, May 21, 2020 at 6:28 PM Thomas Munro <thomas.munro@gmail.com> wrote:
> > Right, I think it's safe.  I think you were probably right that
> > ramp-up isn't actually useful though, it's only the end of the scan
> > that requires special treatment so we don't get unfair allocation as
> > the work runs out, due to course grain.
>
> The ramp-up seems like it might be useful if the query involves a LIMIT.

That's true, but I think the intelligence there would need to go
beyond, "if there's a LIMIT clause, do ramp-up", as we might have
already fully ramped up well before the LIMIT is reached.

David
> It doesn't look like it's using table_block_parallelscan_nextpage() as
> a block allocator so it's not affected by the patch.  It has its own
> thing zs_parallelscan_nextrange(), which does
> pg_atomic_fetch_add_u64(&pzscan->pzs_allocatedtids,
> ZS_PARALLEL_CHUNK_SIZE), and that macro is 0x100000.

My apologies, I was too hasty. Indeed, you are correct. Zedstore's
unit of work is chunks of the logical zstid space. There is a
correlation between the zstid and blocks: zstids near each other are
likely to lie in the same block or in neighboring blocks. It would be
interesting to try something like this patch for Zedstore.

Regards,
Soumyadeep
On Sat, May 23, 2020 at 12:00 AM Robert Haas
<robertmhaas(at)gmail(dot)com> wrote:
> I think there's a significant difference. The idea I remember being
> discussed at the time was to divide the relation into equal parts at
> the very start and give one part to each worker. I think that carries
> a lot of risk of some workers finishing much sooner than others.

Was the idea of work-stealing considered? Here is what I have been
thinking about:

Each worker would be assigned a contiguous chunk of blocks at init time.
Then if a worker is finished with its work, it can inspect other
workers' remaining work and "steal" some of the blocks from the end of
the victim worker's allocation.

Considerations for such a scheme:

1. Victim selection: Who will be the victim worker? It can be selected at
random if nothing else.

2. How many blocks to steal? Stealing half of the victim's remaining
blocks seems to be fair.

3. Stealing threshold: We should disallow stealing if the amount of
remaining work is not enough in the victim worker.

4. Additional parallel state: Representing the chunk of "work". I guess
one variable for the current block and one for the last block in the
chunk allocated. The latter would have to be protected with atomic
fetches as it would be decremented by the stealing worker.

5. Point 4 implies that there might be more atomic fetch operations as
compared to this patch. Idk if that is a lesser evil than the workers
being idle..probably not? A way to salvage that a little would be to
forego atomic fetches when the amount of work remaining is less than the
threshold discussed in 3 as there is no possibility of work stealing then.


Regards,

Soumyadeep
On Wed, Jun 3, 2020 at 3:18 PM Soumyadeep Chakraborty
<soumyadeep2007@gmail.com> wrote:
> Idk if that is a lesser evil than the workers
> being idle..probably not?

Apologies, I meant that the extra atomic fetches is probably a lesser
evil than the workers being idle.

Soumyadeep
On Thu, 21 May 2020 at 17:06, David Rowley <dgrowleyml@gmail.com> wrote:
> create table t (a int, b text);
> -- create a table of 100GB in size.
> insert into t select x,md5(x::text) from
> generate_series(1,1000000*1572.7381809)x; -- took 1 hr 18 mins
> vacuum freeze t;
>
> query = select count(*) from t;
> Disk = Samsung SSD 850 EVO mSATA 1TB.
>
> Master:
> workers = 0 : Time: 269104.281 ms (04:29.104)  380MB/s
> workers = 1 : Time: 741183.646 ms (12:21.184)  138MB/s
> workers = 2 : Time: 656963.754 ms (10:56.964)  155MB/s
>
> Patched:
>
> workers = 0 : Should be the same as before as the code for this didn't change.
> workers = 1 : Time: 300299.364 ms (05:00.299) 340MB/s
> workers = 2 : Time: 270213.726 ms (04:30.214) 379MB/s
>
> (A better query would likely have been just: SELECT * FROM t WHERE a =
> 1; but I'd run the test by the time I thought of that.)
>
> So, this shows that Windows, at least 8.1, does suffer from this too.

I repeated this test on an up-to-date Windows 10 machine to see if the
later kernel is any better at the readahead.

Results for the same test are:

Master:

max_parallel_workers_per_gather = 0: Time: 148481.244 ms (02:28.481)
(706.2MB/sec)
max_parallel_workers_per_gather = 1: Time: 327556.121 ms (05:27.556)
(320.1MB/sec)
max_parallel_workers_per_gather = 2: Time: 329055.530 ms (05:29.056)
(318.6MB/sec)

Patched:

max_parallel_workers_per_gather = 0: Time: 141363.991 ms (02:21.364)
(741.7MB/sec)
max_parallel_workers_per_gather = 1: Time: 144982.202 ms (02:24.982)
(723.2MB/sec)
max_parallel_workers_per_gather = 2: Time: 143355.656 ms (02:23.356)
(731.4MB/sec)

David
On Wed, Jun 10, 2020 at 5:06 PM David Rowley <dgrowleyml@gmail.com> wrote:
> I repeated this test on an up-to-date Windows 10 machine to see if the
> later kernel is any better at the readahead.
>
> Results for the same test are:
>
> Master:
>
> max_parallel_workers_per_gather = 0: Time: 148481.244 ms (02:28.481)
> (706.2MB/sec)
> max_parallel_workers_per_gather = 1: Time: 327556.121 ms (05:27.556)
> (320.1MB/sec)
> max_parallel_workers_per_gather = 2: Time: 329055.530 ms (05:29.056)
> (318.6MB/sec)
>
> Patched:
>
> max_parallel_workers_per_gather = 0: Time: 141363.991 ms (02:21.364)
> (741.7MB/sec)
> max_parallel_workers_per_gather = 1: Time: 144982.202 ms (02:24.982)
> (723.2MB/sec)
> max_parallel_workers_per_gather = 2: Time: 143355.656 ms (02:23.356)
> (731.4MB/sec)

Thanks!

I also heard from Andres that he likes this patch with his AIO
prototype, because of the way request merging works.  So it seems like
there are several reasons to want it.

But ... where should we get the maximum step size from?  A GUC?
On Wed, 10 Jun 2020 at 17:21, Thomas Munro <thomas.munro@gmail.com> wrote:
> I also heard from Andres that he likes this patch with his AIO
> prototype, because of the way request merging works.  So it seems like
> there are several reasons to want it.
>
> But ... where should we get the maximum step size from?  A GUC?

I guess we'd need to determine if other step sizes were better under
any conditions.  I guess one condition would be if there was a LIMIT
clause. I could check if setting it to 1024 makes any difference, but
I'm thinking it won't since I got fairly consistent results on all
worker settings with the patched version.

David
On Wed, 10 Jun 2020 at 17:39, David Rowley <dgrowleyml@gmail.com> wrote:
>
> On Wed, 10 Jun 2020 at 17:21, Thomas Munro <thomas.munro@gmail.com> wrote:
> > I also heard from Andres that he likes this patch with his AIO
> > prototype, because of the way request merging works.  So it seems like
> > there are several reasons to want it.
> >
> > But ... where should we get the maximum step size from?  A GUC?
>
> I guess we'd need to determine if other step sizes were better under
> any conditions.  I guess one condition would be if there was a LIMIT
> clause. I could check if setting it to 1024 makes any difference, but
> I'm thinking it won't since I got fairly consistent results on all
> worker settings with the patched version.

I did another round of testing on the same machine trying some step
sizes larger than 64 blocks. I can confirm that it does improve the
situation further going bigger than 64.

I got up as far as 16384, but made a couple of additional changes for
that run only. Instead of increasing the ramp-up 1 block at a time, I
initialised phsw_step_size to 1 and multiplied it by 2 until I reached
the chosen step size. With numbers that big, ramping up 1 block at a
time was slow enough that I'd never have reached the target step size

Here are the results of the testing:

Master:

max_parallel_workers_per_gather = 0: Time: 148481.244 ms (02:28.481)
(706.2MB/sec)
max_parallel_workers_per_gather = 1: Time: 327556.121 ms (05:27.556)
(320.1MB/sec)
max_parallel_workers_per_gather = 2: Time: 329055.530 ms (05:29.056)
(318.6MB/sec)

Patched stepsize = 64:

max_parallel_workers_per_gather = 0: Time: 141363.991 ms (02:21.364)
(741.7MB/sec)
max_parallel_workers_per_gather = 1: Time: 144982.202 ms (02:24.982)
(723.2MB/sec)
max_parallel_workers_per_gather = 2: Time: 143355.656 ms (02:23.356)
(731.4MB/sec)

Patched stepsize = 1024:

max_parallel_workers_per_gather = 0: Time: 152599.159 ms (02:32.599)
(687.1MB/sec)
max_parallel_workers_per_gather = 1: Time: 104227.232 ms (01:44.227)
(1006.04MB/sec)
max_parallel_workers_per_gather = 2: Time: 97149.343 ms (01:37.149)
(1079.3MB/sec)

Patched stepsize = 8192:

max_parallel_workers_per_gather = 0: Time: 143524.038 ms (02:23.524)
(730.59MB/sec)
max_parallel_workers_per_gather = 1: Time: 102899.288 ms (01:42.899)
(1019.0MB/sec)
max_parallel_workers_per_gather = 2: Time: 91148.340 ms (01:31.148)
(1150.4MB/sec)

Patched stepsize = 16384 (power 2 ramp-up)

max_parallel_workers_per_gather = 0: Time: 144598.502 ms (02:24.599)
(725.16MB/sec)
max_parallel_workers_per_gather = 1: Time: 97344.160 ms (01:37.344)
(1077.1MB/sec)
max_parallel_workers_per_gather = 2: Time: 88025.420 ms (01:28.025)
(1191.2MB/sec)

I thought about what you mentioned about a GUC, and I think it's a bad
idea to do that. I think it would be better to choose based on the
relation size. For smaller relations, we want to keep the step size
small. Someone may enable parallel query on such a small relation if
they're doing something like calling an expensive function on the
results, so we do need to avoid going large for small relations.

I considered something like:

create function nextpower2(a bigint) returns bigint as $$ declare n
bigint := 1; begin while n < a loop n := n * 2; end loop; return n;
end; $$ language plpgsql;
select pg_size_pretty(power(2,p)::numeric * 8192) rel_size,
nextpower2(power(2,p)::bigint / 1024) as stepsize from
generate_series(1,32) p;
 rel_size | stepsize
----------+----------
 16 kB    |        1
 32 kB    |        1
 64 kB    |        1
 128 kB   |        1
 256 kB   |        1
 512 kB   |        1
 1024 kB  |        1
 2048 kB  |        1
 4096 kB  |        1
 8192 kB  |        1
 16 MB    |        2
 32 MB    |        4
 64 MB    |        8
 128 MB   |       16
 256 MB   |       32
 512 MB   |       64
 1024 MB  |      128
 2048 MB  |      256
 4096 MB  |      512
 8192 MB  |     1024
 16 GB    |     2048
 32 GB    |     4096
 64 GB    |     8192
 128 GB   |    16384
 256 GB   |    32768
 512 GB   |    65536
 1024 GB  |   131072
 2048 GB  |   262144
 4096 GB  |   524288
 8192 GB  |  1048576
 16 TB    |  2097152
 32 TB    |  4194304

So with that algorithm with this 100GB table that I've been using in
my test, we'd go with a step size of 16384. I think we'd want to avoid
going any more than that. The above code means we'll do between just
below 0.1% and 0.2% of the relation per step. If I divided the number
of blocks by say 128 instead of 1024, then that would be about 0.78%
and 1.56% of the relation each time. It's not unrealistic today that
someone might throw that many workers at a job, so, I'd say dividing
by 1024 or even 2048 would likely be about right.

David
On Wed, Jun 10, 2020 at 6:04 PM David Rowley <dgrowleyml@gmail.com> wrote:
>
> On Wed, 10 Jun 2020 at 17:39, David Rowley <dgrowleyml@gmail.com> wrote:
> >
> > On Wed, 10 Jun 2020 at 17:21, Thomas Munro <thomas.munro@gmail.com> wrote:
> > > I also heard from Andres that he likes this patch with his AIO
> > > prototype, because of the way request merging works.  So it seems like
> > > there are several reasons to want it.
> > >
> > > But ... where should we get the maximum step size from?  A GUC?
> >
> > I guess we'd need to determine if other step sizes were better under
> > any conditions.  I guess one condition would be if there was a LIMIT
> > clause. I could check if setting it to 1024 makes any difference, but
> > I'm thinking it won't since I got fairly consistent results on all
> > worker settings with the patched version.
>
> I did another round of testing on the same machine trying some step
> sizes larger than 64 blocks. I can confirm that it does improve the
> situation further going bigger than 64.
>

Can we try the same test with 4, 8, 16 workers as well?  I don't
foresee any problem with a higher number of workers but it might be
better to once check that if it is not too much additional work.

--
With Regards,
Amit Kapila.
EnterpriseDB: http://www.enterprisedb.com
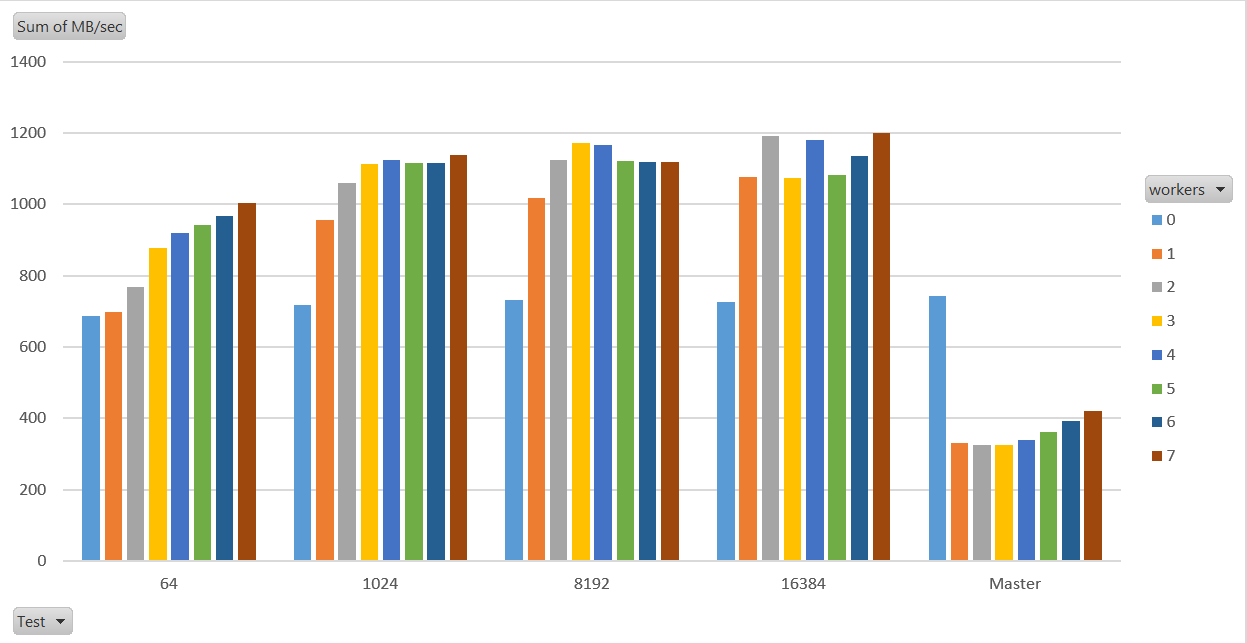
On Thu, 11 Jun 2020 at 01:24, Amit Kapila <amit.kapila16@gmail.com> wrote:
> Can we try the same test with 4, 8, 16 workers as well?  I don't
> foresee any problem with a higher number of workers but it might be
> better to once check that if it is not too much additional work.

I ran the tests again with up to 7 workers. The CPU here only has 8
cores (a laptop), so I'm not sure if there's much sense in going
higher than that?

CPU = Intel i7-8565U. 16GB RAM.

Note that I did the power2 ramp-up with each of the patched tests this
time. Thomas' version ramps up 1 pages at a time, which is ok when
only ramping up to 64 pages, but not for these higher numbers I'm
testing with. (Patch attached)

Results attached in a graph format, or in text below:

Master:

workers=0: Time: 141175.935 ms (02:21.176) (742.7MB/sec)
workers=1: Time: 316854.538 ms (05:16.855) (330.9MB/sec)
workers=2: Time: 323471.791 ms (05:23.472) (324.2MB/sec)
workers=3: Time: 321637.945 ms (05:21.638) (326MB/sec)
workers=4: Time: 308689.599 ms (05:08.690) (339.7MB/sec)
workers=5: Time: 289014.709 ms (04:49.015) (362.8MB/sec)
workers=6: Time: 267785.27 ms (04:27.785) (391.6MB/sec)
workers=7: Time: 248735.817 ms (04:08.736) (421.6MB/sec)

Patched 64: (power 2 ramp-up)

workers=0: Time: 152752.558 ms (02:32.753) (686.5MB/sec)
workers=1: Time: 149940.841 ms (02:29.941) (699.3MB/sec)
workers=2: Time: 136534.043 ms (02:16.534) (768MB/sec)
workers=3: Time: 119387.248 ms (01:59.387) (878.3MB/sec)
workers=4: Time: 114080.131 ms (01:54.080) (919.2MB/sec)
workers=5: Time: 111472.144 ms (01:51.472) (940.7MB/sec)
workers=6: Time: 108290.608 ms (01:48.291) (968.3MB/sec)
workers=7: Time: 104349.947 ms (01:44.350) (1004.9MB/sec)

Patched 1024: (power 2 ramp-up)

workers=0: Time: 146106.086 ms (02:26.106) (717.7MB/sec)
workers=1: Time: 109832.773 ms (01:49.833) (954.7MB/sec)
workers=2: Time: 98921.515 ms (01:38.922) (1060MB/sec)
workers=3: Time: 94259.243 ms (01:34.259) (1112.4MB/sec)
workers=4: Time: 93275.637 ms (01:33.276) (1124.2MB/sec)
workers=5: Time: 93921.452 ms (01:33.921) (1116.4MB/sec)
workers=6: Time: 93988.386 ms (01:33.988) (1115.6MB/sec)
workers=7: Time: 92096.414 ms (01:32.096) (1138.6MB/sec)

Patched 8192: (power 2 ramp-up)

workers=0: Time: 143367.057 ms (02:23.367) (731.4MB/sec)
workers=1: Time: 103138.918 ms (01:43.139) (1016.7MB/sec)
workers=2: Time: 93368.573 ms (01:33.369) (1123.1MB/sec)
workers=3: Time: 89464.529 ms (01:29.465) (1172.1MB/sec)
workers=4: Time: 89921.393 ms (01:29.921) (1166.1MB/sec)
workers=5: Time: 93575.401 ms (01:33.575) (1120.6MB/sec)
workers=6: Time: 93636.584 ms (01:33.637) (1119.8MB/sec)
workers=7: Time: 93682.21 ms (01:33.682) (1119.3MB/sec)

Patched 16384 (power 2 ramp-up)

workers=0: Time: 144598.502 ms (02:24.599) (725.2MB/sec)
workers=1: Time: 97344.16 ms (01:37.344) (1077.2MB/sec)
workers=2: Time: 88025.42 ms (01:28.025) (1191.2MB/sec)
workers=3: Time: 97711.521 ms (01:37.712) (1073.1MB/sec)
workers=4: Time: 88877.913 ms (01:28.878) (1179.8MB/sec)
workers=5: Time: 96985.978 ms (01:36.986) (1081.2MB/sec)
workers=6: Time: 92368.543 ms (01:32.369) (1135.2MB/sec)
workers=7: Time: 87498.156 ms (01:27.498) (1198.4MB/sec)

David
Вложения
On Thu, Jun 11, 2020 at 7:18 AM David Rowley <dgrowleyml@gmail.com> wrote:
>
> On Thu, 11 Jun 2020 at 01:24, Amit Kapila <amit.kapila16@gmail.com> wrote:
> > Can we try the same test with 4, 8, 16 workers as well?  I don't
> > foresee any problem with a higher number of workers but it might be
> > better to once check that if it is not too much additional work.
>
> I ran the tests again with up to 7 workers. The CPU here only has 8
> cores (a laptop), so I'm not sure if there's much sense in going
> higher than that?
>

I think it proves your point that there is a value in going for step
size greater than 64.  However, I think the difference at higher sizes
is not significant.  For example, the difference between 8192 and
16384 doesn't seem much if we leave higher worker count where the data
could be a bit misleading due to variation.  I could see that there is
a clear and significant difference till 1024 but after that difference
is not much.

--
With Regards,
Amit Kapila.
EnterpriseDB: http://www.enterprisedb.com
On Thu, 11 Jun 2020 at 14:09, Amit Kapila <amit.kapila16@gmail.com> wrote:
>
> On Thu, Jun 11, 2020 at 7:18 AM David Rowley <dgrowleyml@gmail.com> wrote:
> >
> > On Thu, 11 Jun 2020 at 01:24, Amit Kapila <amit.kapila16@gmail.com> wrote:
> > > Can we try the same test with 4, 8, 16 workers as well?  I don't
> > > foresee any problem with a higher number of workers but it might be
> > > better to once check that if it is not too much additional work.
> >
> > I ran the tests again with up to 7 workers. The CPU here only has 8
> > cores (a laptop), so I'm not sure if there's much sense in going
> > higher than that?
> >
>
> I think it proves your point that there is a value in going for step
> size greater than 64.  However, I think the difference at higher sizes
> is not significant.  For example, the difference between 8192 and
> 16384 doesn't seem much if we leave higher worker count where the data
> could be a bit misleading due to variation.  I could see that there is
> a clear and significant difference till 1024 but after that difference
> is not much.

I guess the danger with going too big is that we have some Seqscan
filter that causes some workers to do very little to nothing with the
rows, despite discarding them and other workers are left with rows
that are not filtered and require some expensive processing.  Keeping
the number of blocks on the smaller side would reduce the chances of
someone being hit by that.   The algorithm I proposed above still can
be capped by doing something like nblocks = Min(1024,
pg_nextpower2_32(pbscan->phs_nblocks / 1024));  That way we'll end up
with:


 rel_size | stepsize
----------+----------
 16 kB    |        1
 32 kB    |        1
 64 kB    |        1
 128 kB   |        1
 256 kB   |        1
 512 kB   |        1
 1024 kB  |        1
 2048 kB  |        1
 4096 kB  |        1
 8192 kB  |        1
 16 MB    |        2
 32 MB    |        4
 64 MB    |        8
 128 MB   |       16
 256 MB   |       32
 512 MB   |       64
 1024 MB  |      128
 2048 MB  |      256
 4096 MB  |      512
 8192 MB  |     1024
 16 GB    |     1024
 32 GB    |     1024
 64 GB    |     1024
 128 GB   |     1024
 256 GB   |     1024
 512 GB   |     1024
 1024 GB  |     1024
 2048 GB  |     1024
 4096 GB  |     1024
 8192 GB  |     1024
 16 TB    |     1024
 32 TB    |     1024
(32 rows)

David
On Thu, Jun 11, 2020 at 8:35 AM David Rowley <dgrowleyml@gmail.com> wrote:
>
> On Thu, 11 Jun 2020 at 14:09, Amit Kapila <amit.kapila16@gmail.com> wrote:
> >
> > On Thu, Jun 11, 2020 at 7:18 AM David Rowley <dgrowleyml@gmail.com> wrote:
> > >
> > > On Thu, 11 Jun 2020 at 01:24, Amit Kapila <amit.kapila16@gmail.com> wrote:
> > > > Can we try the same test with 4, 8, 16 workers as well?  I don't
> > > > foresee any problem with a higher number of workers but it might be
> > > > better to once check that if it is not too much additional work.
> > >
> > > I ran the tests again with up to 7 workers. The CPU here only has 8
> > > cores (a laptop), so I'm not sure if there's much sense in going
> > > higher than that?
> > >
> >
> > I think it proves your point that there is a value in going for step
> > size greater than 64.  However, I think the difference at higher sizes
> > is not significant.  For example, the difference between 8192 and
> > 16384 doesn't seem much if we leave higher worker count where the data
> > could be a bit misleading due to variation.  I could see that there is
> > a clear and significant difference till 1024 but after that difference
> > is not much.
>
> I guess the danger with going too big is that we have some Seqscan
> filter that causes some workers to do very little to nothing with the
> rows, despite discarding them and other workers are left with rows
> that are not filtered and require some expensive processing.  Keeping
> the number of blocks on the smaller side would reduce the chances of
> someone being hit by that.
>

Right and good point.

>   The algorithm I proposed above still can
> be capped by doing something like nblocks = Min(1024,
> pg_nextpower2_32(pbscan->phs_nblocks / 1024));  That way we'll end up
> with:
>

I think something on these lines would be a good idea especially
keeping step-size proportional to relation size.  However, I am not
completely sure if doubling the step-size with equal increase in
relation size (ex. what is happening between 16MB~8192MB) is the best
idea.  Why not double the step-size when relation size increases by
four times?  Will some more tests help us to identify this?  I also
don't know what is the right answer here so just trying to brainstorm.

--
With Regards,
Amit Kapila.
EnterpriseDB: http://www.enterprisedb.com
On Thu, 11 Jun 2020 at 16:03, Amit Kapila <amit.kapila16@gmail.com> wrote:
> I think something on these lines would be a good idea especially
> keeping step-size proportional to relation size.  However, I am not
> completely sure if doubling the step-size with equal increase in
> relation size (ex. what is happening between 16MB~8192MB) is the best
> idea.  Why not double the step-size when relation size increases by
> four times?  Will some more tests help us to identify this?  I also
> don't know what is the right answer here so just trying to brainstorm.

Brainstorming sounds good. I'm by no means under any illusion that the
formula is correct.

But, why four times?  The way I did it tries to keep the number of
chunks roughly the same each time. I think the key is the number of
chunks more than the size of the chunks. Having fewer chunks increases
the chances of an imbalance of work between workers, and with what you
mention, the number of chunks will vary more than what I have proposed

The code I showed above will produce something between 512-1024 chunks
for all cases until we 2^20 pages, then we start capping the chunk
size to 1024.  I could probably get onboard with making it depend on
the number of parallel workers, but perhaps it would be better just to
divide by, say, 16384 rather than 1024, as I proposed above. That way
we'll be more fine-grained, but we'll still read in larger than 1024
chunk sizes when the relation gets beyond 128GB.

David
On Thu, Jun 11, 2020 at 10:13 AM David Rowley <dgrowleyml@gmail.com> wrote:
>
> On Thu, 11 Jun 2020 at 16:03, Amit Kapila <amit.kapila16@gmail.com> wrote:
> > I think something on these lines would be a good idea especially
> > keeping step-size proportional to relation size.  However, I am not
> > completely sure if doubling the step-size with equal increase in
> > relation size (ex. what is happening between 16MB~8192MB) is the best
> > idea.  Why not double the step-size when relation size increases by
> > four times?  Will some more tests help us to identify this?  I also
> > don't know what is the right answer here so just trying to brainstorm.
>
> Brainstorming sounds good. I'm by no means under any illusion that the
> formula is correct.
>
> But, why four times?
>

Just trying to see if we can optimize such that we use bigger
step-size for bigger relations and smaller step-size for smaller
relations.

>  The way I did it tries to keep the number of
> chunks roughly the same each time. I think the key is the number of
> chunks more than the size of the chunks. Having fewer chunks increases
> the chances of an imbalance of work between workers, and with what you
> mention, the number of chunks will vary more than what I have proposed
>

But, I think it will lead to more number of chunks for smaller relations.

> The code I showed above will produce something between 512-1024 chunks
> for all cases until we 2^20 pages, then we start capping the chunk
> size to 1024.  I could probably get onboard with making it depend on
> the number of parallel workers, but perhaps it would be better just to
> divide by, say, 16384 rather than 1024, as I proposed above. That way
> we'll be more fine-grained, but we'll still read in larger than 1024
> chunk sizes when the relation gets beyond 128GB.
>

I think increasing step-size might be okay for very large relations.

Another point I am thinking is that whatever formula we come up here
might not be a good fit for every case.  For ex. as you mentioned
above that larger step-size can impact the performance based on
qualification, similarly there could be other things like having a
target list or qual having some function which takes more time for
certain tuples and lesser for others especially if function evaluation
is based on some column values.  So, can we think of providing a
rel_option for step-size?
--
With Regards,
Amit Kapila.
EnterpriseDB: http://www.enterprisedb.com
On Thu, 11 Jun 2020 at 23:35, Amit Kapila <amit.kapila16@gmail.com> wrote:
> Another point I am thinking is that whatever formula we come up here
> might not be a good fit for every case.  For ex. as you mentioned
> above that larger step-size can impact the performance based on
> qualification, similarly there could be other things like having a
> target list or qual having some function which takes more time for
> certain tuples and lesser for others especially if function evaluation
> is based on some column values.  So, can we think of providing a
> rel_option for step-size?

I think someone at some point is not going to like the automatic
choice. So perhaps a reloption to allow users to overwrite it is a
good idea. -1 should most likely mean use the automatic choice based
on relation size.  I think for parallel seq scans that filter a large
portion of the records most likely need some sort of index, but there
are perhaps some genuine cases for not having one. e.g perhaps the
query is just not run often enough for an index to be worthwhile. In
that case, the performance is likely less critical, but at least the
reloption would allow users to get the old behaviour.

David
On Fri, Jun 12, 2020 at 2:24 AM David Rowley <dgrowleyml@gmail.com> wrote:
>
> On Thu, 11 Jun 2020 at 23:35, Amit Kapila <amit.kapila16@gmail.com> wrote:
> > Another point I am thinking is that whatever formula we come up here
> > might not be a good fit for every case.  For ex. as you mentioned
> > above that larger step-size can impact the performance based on
> > qualification, similarly there could be other things like having a
> > target list or qual having some function which takes more time for
> > certain tuples and lesser for others especially if function evaluation
> > is based on some column values.  So, can we think of providing a
> > rel_option for step-size?
>
> I think someone at some point is not going to like the automatic
> choice. So perhaps a reloption to allow users to overwrite it is a
> good idea. -1 should most likely mean use the automatic choice based
> on relation size.  I think for parallel seq scans that filter a large
> portion of the records most likely need some sort of index, but there
> are perhaps some genuine cases for not having one. e.g perhaps the
> query is just not run often enough for an index to be worthwhile. In
> that case, the performance is likely less critical, but at least the
> reloption would allow users to get the old behaviour.
>

makes sense to me.

--
With Regards,
Amit Kapila.
EnterpriseDB: http://www.enterprisedb.com
On Thu, Jun 11, 2020 at 4:54 PM David Rowley <dgrowleyml@gmail.com> wrote:
> I think someone at some point is not going to like the automatic
> choice. So perhaps a reloption to allow users to overwrite it is a
> good idea. -1 should most likely mean use the automatic choice based
> on relation size.  I think for parallel seq scans that filter a large
> portion of the records most likely need some sort of index, but there
> are perhaps some genuine cases for not having one. e.g perhaps the
> query is just not run often enough for an index to be worthwhile. In
> that case, the performance is likely less critical, but at least the
> reloption would allow users to get the old behaviour.

Let me play the devil's advocate here. I feel like if the step size is
limited by the relation size and there is ramp-up and ramp-down, or
maybe even if you don't have all 3 of those but perhaps say 2 of them,
the chances of there being a significant downside from using this seem
quite small. At that point I wonder whether you really need an option.
It's true that someone might not like it, but there are all sorts of
things that at least one person doesn't like and one can't cater to
all of them.

To put that another way, in what scenario do we suppose that a
reasonable person would wish to use this reloption? If there's none,
we don't need it. If there is one, can we develop a mitigation that
solves their problem automatically instead?

--
Robert Haas
EnterpriseDB: http://www.enterprisedb.com
The Enterprise PostgreSQL Company
On Fri, Jun 12, 2020 at 11:28 PM Robert Haas <robertmhaas@gmail.com> wrote:
>
> On Thu, Jun 11, 2020 at 4:54 PM David Rowley <dgrowleyml@gmail.com> wrote:
> > I think someone at some point is not going to like the automatic
> > choice. So perhaps a reloption to allow users to overwrite it is a
> > good idea. -1 should most likely mean use the automatic choice based
> > on relation size.  I think for parallel seq scans that filter a large
> > portion of the records most likely need some sort of index, but there
> > are perhaps some genuine cases for not having one. e.g perhaps the
> > query is just not run often enough for an index to be worthwhile. In
> > that case, the performance is likely less critical, but at least the
> > reloption would allow users to get the old behaviour.
>
> Let me play the devil's advocate here. I feel like if the step size is
> limited by the relation size and there is ramp-up and ramp-down, or
> maybe even if you don't have all 3 of those but perhaps say 2 of them,
> the chances of there being a significant downside from using this seem
> quite small. At that point I wonder whether you really need an option.
> It's true that someone might not like it, but there are all sorts of
> things that at least one person doesn't like and one can't cater to
> all of them.
>
> To put that another way, in what scenario do we suppose that a
> reasonable person would wish to use this reloption?
>

The performance can vary based on qualification where some workers
discard more rows as compared to others, with the current system with
step-size as one, the probability of unequal work among workers is
quite low as compared to larger step-sizes.

--
With Regards,
Amit Kapila.
EnterpriseDB: http://www.enterprisedb.com
On Sat, Jun 13, 2020 at 2:13 AM Amit Kapila <amit.kapila16@gmail.com> wrote:
> The performance can vary based on qualification where some workers
> discard more rows as compared to others, with the current system with
> step-size as one, the probability of unequal work among workers is
> quite low as compared to larger step-sizes.

It seems like this would require incredibly bad luck, though. If the
step size is less than 1/1024 of the relation size, and we ramp down
for, say, the last 5% of the relation, then the worst case is that
chunk 972 of 1024 is super-slow compared to all the other blocks, so
that it takes longer to process chunk 972 only than it does to process
chunks 973-1024 combined. It is not impossible, but that chunk has to
be like 50x worse than all the others, which doesn't seem like
something that is going to happen often enough to be worth worrying
about very much. I'm not saying it will never happen. I'm just
skeptical about the benefit of adding a GUC or reloption for a corner
case like this. I think people will fiddle with it when it isn't
really needed, and won't realize it exists in the scenarios where it
would have helped. And then, because we have the setting, we'll have
to keep it around forever, even as we improve the algorithm in other
ways, which could become a maintenance burden. I think it's better to
treat stuff like this as an implementation detail rather than
something we expect users to adjust.

--
Robert Haas
EnterpriseDB: http://www.enterprisedb.com
The Enterprise PostgreSQL Company
On Tue, 16 Jun 2020 at 03:29, Robert Haas <robertmhaas@gmail.com> wrote:
>
> On Sat, Jun 13, 2020 at 2:13 AM Amit Kapila <amit.kapila16@gmail.com> wrote:
> > The performance can vary based on qualification where some workers
> > discard more rows as compared to others, with the current system with
> > step-size as one, the probability of unequal work among workers is
> > quite low as compared to larger step-sizes.
>
> It seems like this would require incredibly bad luck, though. If the
> step size is less than 1/1024 of the relation size, and we ramp down
> for, say, the last 5% of the relation, then the worst case is that
> chunk 972 of 1024 is super-slow compared to all the other blocks, so
> that it takes longer to process chunk 972 only than it does to process
> chunks 973-1024 combined. It is not impossible, but that chunk has to
> be like 50x worse than all the others, which doesn't seem like
> something that is going to happen often enough to be worth worrying
> about very much. I'm not saying it will never happen. I'm just
> skeptical about the benefit of adding a GUC or reloption for a corner
> case like this. I think people will fiddle with it when it isn't
> really needed, and won't realize it exists in the scenarios where it
> would have helped.

I'm trying to think of likely scenarios where "lots of work at the
end" is going to be common.  I can think of queue processing, but
everything I can think about there requires an UPDATE to the processed
flag, which won't be using parallel query anyway. There's then
processing something based on some period of time like "the last
hour", "today". For append-only tables the latest information is
likely to be at the end of the heap.  For that, anyone that's getting
a SeqScan on a large relation should likely have added an index. If a
btree is too costly, then BRIN is pretty perfect for that case.

FWIW, I'm not really keen on adding a reloption or a GUC.  I've also
voiced here that I'm not even keen on the ramp-up.

To summarise what's all been proposed so far:

1. Use a constant, (e.g. 64) as the parallel step size
2. Ramp up the step size over time
3. Ramp down the step size towards the end of the scan.
4. Auto-determine a good stepsize based on the size of the relation.
5. Add GUC to allow users to control or override the step size.
6. Add relption to allow users to control or override the step size.


Here are my thoughts on each of those:

#1 is a bad idea as there are legitimate use-cases for using parallel
query on small tables. e.g calling some expensive parallel safe
function. Small tables are more likely to be cached.
#2 I don't quite understand why this is useful
#3 I understand this is to try to make it so workers all complete
around about the same time.
#4 We really should be doing it this way.
#5 Having a global knob to control something that is very specific to
the size of a relation does not make much sense to me.
#6. I imagine someone will have some weird use-case that works better
when parallel workers get 1 page at a time. I'm not convinced that
they're not doing something else wrong.

So my vote is for 4 with possibly 3, if we can come up with something
smart enough * that works well in parallel.  I think there's less of a
need for this if we divided the relation into more chunks, e.g. 8192
or 16384.

* Perhaps when there are less than 2 full chunks remaining, workers
can just take half of what is left. Or more specifically
Max(pg_next_power2(remaining_blocks) / 2, 1), which ideally would work
out allocating an amount of pages proportional to the amount of beer
each mathematician receives in the "An infinite number of
mathematicians walk into a bar" joke, obviously with the exception
that we stop dividing when we get to 1. However, I'm not quite sure
how well that can be made to work with multiple bartenders working in
parallel.

David
On Mon, Jun 15, 2020 at 8:59 PM Robert Haas <robertmhaas@gmail.com> wrote:
>
> On Sat, Jun 13, 2020 at 2:13 AM Amit Kapila <amit.kapila16@gmail.com> wrote:
> > The performance can vary based on qualification where some workers
> > discard more rows as compared to others, with the current system with
> > step-size as one, the probability of unequal work among workers is
> > quite low as compared to larger step-sizes.
>
> It seems like this would require incredibly bad luck, though.
>

I agree that won't be a common scenario but apart from that also I am
not sure if we can conclude that the proposed patch won't cause any
regressions.  See one of the tests [1] done by Soumyadeep where the
patch has caused regression in one of the cases, now we can either try
to improve the patch and see we didn't cause any regressions or assume
that those are some minority cases which we don't care.  Another point
is that this thread has started with a theory that this idea can give
benefits on certain filesystems and AFAICS we have tested it on one
other type of system, so not sure if that is sufficient.

Having said that, I just want to clarify that I am positive about this
work but just not very sure that it is a universal win based on the
testing done till now.

[1] - https://www.postgresql.org/message-id/CADwEdoqirzK3H8bB%3DxyJ192EZCNwGfcCa_WJ5GHVM7Sv8oenuA%40mail.gmail.com

--
With Regards,
Amit Kapila.
EnterpriseDB: http://www.enterprisedb.com
On Mon, Jun 15, 2020 at 5:09 PM David Rowley <dgrowleyml@gmail.com> wrote:
> To summarise what's all been proposed so far:
>
> 1. Use a constant, (e.g. 64) as the parallel step size
> 2. Ramp up the step size over time
> 3. Ramp down the step size towards the end of the scan.
> 4. Auto-determine a good stepsize based on the size of the relation.
> 5. Add GUC to allow users to control or override the step size.
> 6. Add relption to allow users to control or override the step size.
>
> Here are my thoughts on each of those:
>
> #1 is a bad idea as there are legitimate use-cases for using parallel
> query on small tables. e.g calling some expensive parallel safe
> function. Small tables are more likely to be cached.

I agree.

> #2 I don't quite understand why this is useful

I was thinking that if the query had a small LIMIT, you'd want to
avoid handing out excessively large chunks, but actually that seems
like it might just be fuzzy thinking on my part. We're not committing
to scanning the entirety of the chunk just because we've assigned it
to a worker.

> #3 I understand this is to try to make it so workers all complete
> around about the same time.
> #4 We really should be doing it this way.
> #5 Having a global knob to control something that is very specific to
> the size of a relation does not make much sense to me.
> #6. I imagine someone will have some weird use-case that works better
> when parallel workers get 1 page at a time. I'm not convinced that
> they're not doing something else wrong.

Agree with all of that.

> So my vote is for 4 with possibly 3, if we can come up with something
> smart enough * that works well in parallel.  I think there's less of a
> need for this if we divided the relation into more chunks, e.g. 8192
> or 16384.

I agree with that too.

> * Perhaps when there are less than 2 full chunks remaining, workers
> can just take half of what is left. Or more specifically
> Max(pg_next_power2(remaining_blocks) / 2, 1), which ideally would work
> out allocating an amount of pages proportional to the amount of beer
> each mathematician receives in the "An infinite number of
> mathematicians walk into a bar" joke, obviously with the exception
> that we stop dividing when we get to 1. However, I'm not quite sure
> how well that can be made to work with multiple bartenders working in
> parallel.

That doesn't sound nearly aggressive enough to me. I mean, let's
suppose that we're concerned about the scenario where one chunk takes
50x as long as all the other chunks. Well, if we have 1024 chunks
total, and we hit the problem chunk near the beginning, there will be
no problem. In effect, there are 1073 units of work instead of 1024,
and we accidentally assigned one guy 50 units of work when we thought
we were assigning 1 unit of work. If there's enough work left that we
can assign each other worker 49 units more than what we would have
done had that chunk been the same cost as all the others, then there's
no problem. So for instance if there are 4 workers, we can still even
things out if we hit the problematic chunk more than ~150 chunks from
the end. If we're closer to the end than that, there's no way to avoid
the slow chunk delaying the overall completion time, and the problem
gets worse as the problem chunk gets closer to the end.

How can we improve? Well, if when we're less than 150 chunks from the
end, we reduce the chunk size by 2x, then instead of having 1 chunk
that is 50x as expensive, hopefully we'll have 2 smaller chunks that
are each 50x as expensive. They'll get assigned to 2 different
workers, and the remaining 2 workers now need enough extra work from
other chunks to even out the work distribution, which should still be
possible. It gets tough though if breaking the one expensive chunk in
half produces 1 regular-price half-chunk and one half-chunk that is
50x as expensive as all the others. Because we have <150 chunks left,
there's no way to keep everybody else busy until the sole expensive
half-chunk completes. In a sufficiently-extreme scenario, assigning
even a single full block to a worker is too much, and you really want
to handle the tuples out individually.

Anyway, if we don't do anything special until we get down to the last
2 chunks, it's only going to make a difference when one of those last
2 chunks happens to be the expensive one. If say the third-to-last
chunk is the expensive one, subdividing the last 2 chunks lets all the
workers who didn't get the expensive chunk fight over the scraps, but
that's not an improvement. If anything it's worse, because there's
more communication overhead and you don't gain anything vs. just
assigning each chunk to a worker straight up.

In a real example we don't know that we have a single expensive chunk
-- each chunk just has its own cost, and they could all be the same,
or some could be much more expensive. When we have a lot of work left,
we can be fairly cavalier in handing out larger chunks of it with the
full confidence that even if some of those chunks turn out to be way
more expensive than others, we'll still be able to equalize the
finishing times by our choice of how to distribute the remaining work.
But as there's less and less work left, I think you need to hand out
the work in smaller increments to maximize the chances of obtaining an
equal work distribution.

So maybe one idea is to base the chunk size on the number of blocks
remaining to be scanned. Say that the chunk size is limited to 1/512
of the *remaining* blocks in the relation, probably with some upper
limit. I doubt going beyond 1GB makes any sense just because that's
how large the files are, for example, and that might be too big for
other reasons. But let's just use that as an example. Say you have a
20TB relation. You hand out 1GB segments until you get down to 512GB
remaining. Then you hand out 512MB segments until you get down to
256GB remaining, and then 256MB segments until you get down to 128GB
remaining, and so on. Once you get down to the last 4MB you're handing
out individual blocks, just as you would do from the beginning if the
whole relation size was 4MB.

This kind of thing is a bit overcomplicated and doesn't really help if
the first 1GB you hand out at the very beginning turns out to be the
1GB chunk of death, and it takes a bazillion times longer than
anything else, and it's just going to be the last worker to finish no
matter what you do about anything else. The increasing granularity
near the end is just fighting over scraps in that case. The only thing
you can do to avoid this kind of problem is use a lower maximum chunk
size from the beginning, and I think we might want to consider doing
that, because I suspect that the incremental benefits from 64MB chunks
to 1GB chunks are pretty small, for example.

But, in more normal cases where you have some somewhat-expensive
chunks mixed in with the regular-price chunks, I think this sort of
thing should work pretty well. If you never give out more that 1/512
of the remaining blocks, then you can still achieve an equal work
distribution as long as you don't hit a chunk whose cost relative to
others is more than 512/(# of processes you have - 1). So for example
with 6 processes, you need a single chunk that's more than 100x as
expensive as the others to break it. That can definitely happen,
because we can construct arbitrarily bad cases for this sort of thing,
but hopefully they wouldn't come up all that frequently...

--
Robert Haas
EnterpriseDB: http://www.enterprisedb.com
The Enterprise PostgreSQL Company
On Tue, Jun 16, 2020 at 6:57 AM Amit Kapila <amit.kapila16@gmail.com> wrote:
> I agree that won't be a common scenario but apart from that also I am
> not sure if we can conclude that the proposed patch won't cause any
> regressions.  See one of the tests [1] done by Soumyadeep where the
> patch has caused regression in one of the cases, now we can either try
> to improve the patch and see we didn't cause any regressions or assume
> that those are some minority cases which we don't care.  Another point
> is that this thread has started with a theory that this idea can give
> benefits on certain filesystems and AFAICS we have tested it on one
> other type of system, so not sure if that is sufficient.

Yeah, it seems like those cases might need some more investigation,
but they're also not necessarily an argument for a configuration
setting. It's not so much that I dislike the idea of being able to
configure something here; it's really that I don't want a reloption
that feels like magic. For example, we know that work_mem can be
really hard to configure because there may be no value that's high
enough to make your queries run fast during normal periods but low
enough to avoid running out of memory during busy periods. That kind
of thing sucks, and we should avoid creating more such cases.

One problem here is that the best value might depend not only on the
relation but on the individual query. A GUC could be changed
per-query, but different tables in the query might need different
values. Changing a reloption requires locking, and you wouldn't want
to have to keep changing it for each different query. Now if we figure
out that something is hardware-dependent -- like we come up with a
good formula that adjusts the value automatically most of the time,
but say it needs to more more on SSDs than on spinning disks or the
other way around, well then that's a good candidate for some kind of
setting, maybe a tablespace option. But if it seems to depend on the
query, we need a better idea, not a user-configurable setting.

--
Robert Haas
EnterpriseDB: http://www.enterprisedb.com
The Enterprise PostgreSQL Company
On Wed, 17 Jun 2020 at 03:20, Robert Haas <robertmhaas@gmail.com> wrote:
>
> On Mon, Jun 15, 2020 at 5:09 PM David Rowley <dgrowleyml@gmail.com> wrote:
> > * Perhaps when there are less than 2 full chunks remaining, workers
> > can just take half of what is left. Or more specifically
> > Max(pg_next_power2(remaining_blocks) / 2, 1), which ideally would work
> > out allocating an amount of pages proportional to the amount of beer
> > each mathematician receives in the "An infinite number of
> > mathematicians walk into a bar" joke, obviously with the exception
> > that we stop dividing when we get to 1. However, I'm not quite sure
> > how well that can be made to work with multiple bartenders working in
> > parallel.
>
> That doesn't sound nearly aggressive enough to me. I mean, let's
> suppose that we're concerned about the scenario where one chunk takes
> 50x as long as all the other chunks. Well, if we have 1024 chunks
> total, and we hit the problem chunk near the beginning, there will be
> no problem. In effect, there are 1073 units of work instead of 1024,
> and we accidentally assigned one guy 50 units of work when we thought
> we were assigning 1 unit of work. If there's enough work left that we
> can assign each other worker 49 units more than what we would have
> done had that chunk been the same cost as all the others, then there's
> no problem. So for instance if there are 4 workers, we can still even
> things out if we hit the problematic chunk more than ~150 chunks from
> the end. If we're closer to the end than that, there's no way to avoid
> the slow chunk delaying the overall completion time, and the problem
> gets worse as the problem chunk gets closer to the end.

I've got something like that in the attached.  Currently, I've set the
number of chunks to 2048 and I'm starting the ramp down when 64 chunks
remain, which means we'll start the ramp-down when there's about 3.1%
of the scan remaining. I didn't see the point of going with the larger
number of chunks and having ramp-down code.

Attached is the patch and an .sql file with a function which can be
used to demonstrate what chunk sizes the patch will choose and demo
the ramp-down.

e.g.
# select show_parallel_scan_chunks(1000000, 2048, 64);

It would be really good if people could test this using the test case
mentioned in [1]. We really need to get a good idea of how this
behaves on various operating systems.

With a 32TB relation, the code will make the chunk size 16GB.  Perhaps
I should change the code to cap that at 1GB.

David

[1] https://www.postgresql.org/message-id/CAApHDvrfJfYH51_WY-iQqPw8yGR4fDoTxAQKqn%2BSa7NTKEVWtg%40mail.gmail.com
Вложения
On Thu, Jun 18, 2020 at 6:15 AM David Rowley <dgrowleyml@gmail.com> wrote:
> With a 32TB relation, the code will make the chunk size 16GB.  Perhaps
> I should change the code to cap that at 1GB.

It seems pretty hard to believe there's any significant advantage to a
chunk size >1GB, so I would be in favor of that change.

--
Robert Haas
EnterpriseDB: http://www.enterprisedb.com
The Enterprise PostgreSQL Company
On Fri, 19 Jun 2020 at 03:26, Robert Haas <robertmhaas@gmail.com> wrote:
>
> On Thu, Jun 18, 2020 at 6:15 AM David Rowley <dgrowleyml@gmail.com> wrote:
> > With a 32TB relation, the code will make the chunk size 16GB.  Perhaps
> > I should change the code to cap that at 1GB.
>
> It seems pretty hard to believe there's any significant advantage to a
> chunk size >1GB, so I would be in favor of that change.

I could certainly make that change.  With the standard page size, 1GB
is 131072 pages and a power of 2. That would change for non-standard
page sizes, so we'd need to decide if we want to keep the chunk size a
power of 2, or just cap it exactly at whatever number of pages 1GB is.

I'm not sure how much of a difference it'll make, but I also just want
to note that synchronous scans can mean we'll start the scan anywhere
within the table, so capping to 1GB does not mean we read an entire
extent. It's more likely to span 2 extents.

David
On Fri, 19 Jun 2020 at 11:34, David Rowley <dgrowleyml@gmail.com> wrote:
>
> On Fri, 19 Jun 2020 at 03:26, Robert Haas <robertmhaas@gmail.com> wrote:
> >
> > On Thu, Jun 18, 2020 at 6:15 AM David Rowley <dgrowleyml@gmail.com> wrote:
> > > With a 32TB relation, the code will make the chunk size 16GB.  Perhaps
> > > I should change the code to cap that at 1GB.
> >
> > It seems pretty hard to believe there's any significant advantage to a
> > chunk size >1GB, so I would be in favor of that change.
>
> I could certainly make that change.  With the standard page size, 1GB
> is 131072 pages and a power of 2. That would change for non-standard
> page sizes, so we'd need to decide if we want to keep the chunk size a
> power of 2, or just cap it exactly at whatever number of pages 1GB is.
>
> I'm not sure how much of a difference it'll make, but I also just want
> to note that synchronous scans can mean we'll start the scan anywhere
> within the table, so capping to 1GB does not mean we read an entire
> extent. It's more likely to span 2 extents.

Here's a patch which caps the maximum chunk size to 131072.  If
someone doubles the page size then that'll be 2GB instead of 1GB. I'm
not personally worried about that.

I tested the performance on a Windows 10 laptop using the test case from [1]

Master:

workers=0: Time: 141175.935 ms (02:21.176)
workers=1: Time: 316854.538 ms (05:16.855)
workers=2: Time: 323471.791 ms (05:23.472)
workers=3: Time: 321637.945 ms (05:21.638)
workers=4: Time: 308689.599 ms (05:08.690)
workers=5: Time: 289014.709 ms (04:49.015)
workers=6: Time: 267785.270 ms (04:27.785)
workers=7: Time: 248735.817 ms (04:08.736)

Patched:

workers=0: Time: 155985.204 ms (02:35.985)
workers=1: Time: 112238.741 ms (01:52.239)
workers=2: Time: 105861.813 ms (01:45.862)
workers=3: Time: 91874.311 ms (01:31.874)
workers=4: Time: 92538.646 ms (01:32.539)
workers=5: Time: 93012.902 ms (01:33.013)
workers=6: Time: 94269.076 ms (01:34.269)
workers=7: Time: 90858.458 ms (01:30.858)

David

[1] https://www.postgresql.org/message-id/CAApHDvrfJfYH51_WY-iQqPw8yGR4fDoTxAQKqn%2BSa7NTKEVWtg%40mail.gmail.com
Вложения
On Thu, Jun 18, 2020 at 10:10 PM David Rowley <dgrowleyml@gmail.com> wrote:
> Here's a patch which caps the maximum chunk size to 131072.  If
> someone doubles the page size then that'll be 2GB instead of 1GB. I'm
> not personally worried about that.

Maybe use RELSEG_SIZE?

> I tested the performance on a Windows 10 laptop using the test case from [1]
>
> Master:
>
> workers=0: Time: 141175.935 ms (02:21.176)
> workers=1: Time: 316854.538 ms (05:16.855)
> workers=2: Time: 323471.791 ms (05:23.472)
> workers=3: Time: 321637.945 ms (05:21.638)
> workers=4: Time: 308689.599 ms (05:08.690)
> workers=5: Time: 289014.709 ms (04:49.015)
> workers=6: Time: 267785.270 ms (04:27.785)
> workers=7: Time: 248735.817 ms (04:08.736)
>
> Patched:
>
> workers=0: Time: 155985.204 ms (02:35.985)
> workers=1: Time: 112238.741 ms (01:52.239)
> workers=2: Time: 105861.813 ms (01:45.862)
> workers=3: Time: 91874.311 ms (01:31.874)
> workers=4: Time: 92538.646 ms (01:32.539)
> workers=5: Time: 93012.902 ms (01:33.013)
> workers=6: Time: 94269.076 ms (01:34.269)
> workers=7: Time: 90858.458 ms (01:30.858)

Nice results. I wonder if these stack with the gains Thomas was
discussing with his DSM-from-the-main-shmem-segment patch.

--
Robert Haas
EnterpriseDB: http://www.enterprisedb.com
The Enterprise PostgreSQL Company
On Sat, 20 Jun 2020 at 08:00, Robert Haas <robertmhaas@gmail.com> wrote:
>
> On Thu, Jun 18, 2020 at 10:10 PM David Rowley <dgrowleyml@gmail.com> wrote:
> > Here's a patch which caps the maximum chunk size to 131072.  If
> > someone doubles the page size then that'll be 2GB instead of 1GB. I'm
> > not personally worried about that.
>
> Maybe use RELSEG_SIZE?

I was hoping to keep the guarantees that the chunk size is always a
power of 2.  If, for example, someone configured PostgreSQL
--with-segsize=3, then RELSEG_SIZE would be 393216 with the standard
BLCKSZ.

Not having it a power of 2 does mean the ramp-down is more uneven when
the sizes become very small:

postgres=# select 393216>>x from generate_Series(0,18)x;
 ?column?
----------
   393216
   196608
    98304
    49152
    24576
    12288
     6144
     3072
     1536
      768
      384
      192
       96
       48
       24
       12
        6
        3
        1
(19 rows)

Perhaps that's not a problem though, but then again, perhaps just
keeping it at 131072 regardless of RELSEG_SIZE and BLCKSZ is also ok.
The benchmarks I did on Windows [1] showed that the returns diminished
once we started making the step size some decent amount so my thoughts
are that I've set PARALLEL_SEQSCAN_MAX_CHUNK_SIZE to something large
enough that it'll make no difference to the performance anyway. So
there's probably not much point in giving it too much thought.

Perhaps pg_nextpower2_32(RELSEG_SIZE) would be okay though.

David

[1] https://www.postgresql.org/message-id/CAApHDvopPkA+q5y_k_6CUV4U6DPhmz771VeUMuzLs3D3mWYMOg@mail.gmail.com
On Fri, 19 Jun 2020 at 14:10, David Rowley <dgrowleyml@gmail.com> wrote:
> Here's a patch which caps the maximum chunk size to 131072.  If
> someone doubles the page size then that'll be 2GB instead of 1GB. I'm
> not personally worried about that.
>
> I tested the performance on a Windows 10 laptop using the test case from [1]

I also tested this an AMD machine running Ubuntu 20.04 on kernel
version 5.4.0-37.  I used the same 100GB table I mentioned in [1], but
with the query "select * from t where a < 0;", which saves having to
do any aggregate work.

There seems to be quite a big win with Linux too. See the attached
graphs.  Both graphs are based on the same results, just the MB/sec
one takes the query time in milliseconds and converts that into MB/sec
for the 100 GB table. i.e. 100*1024/(<milliseconds> /1000)

The machine is a 64core / 128 thread AMD machine (3990x) with a 1TB
Samsung 970 Pro evo plus SSD, 64GB RAM

> [1] https://www.postgresql.org/message-id/CAApHDvrfJfYH51_WY-iQqPw8yGR4fDoTxAQKqn%2BSa7NTKEVWtg%40mail.gmail.com
Вложения
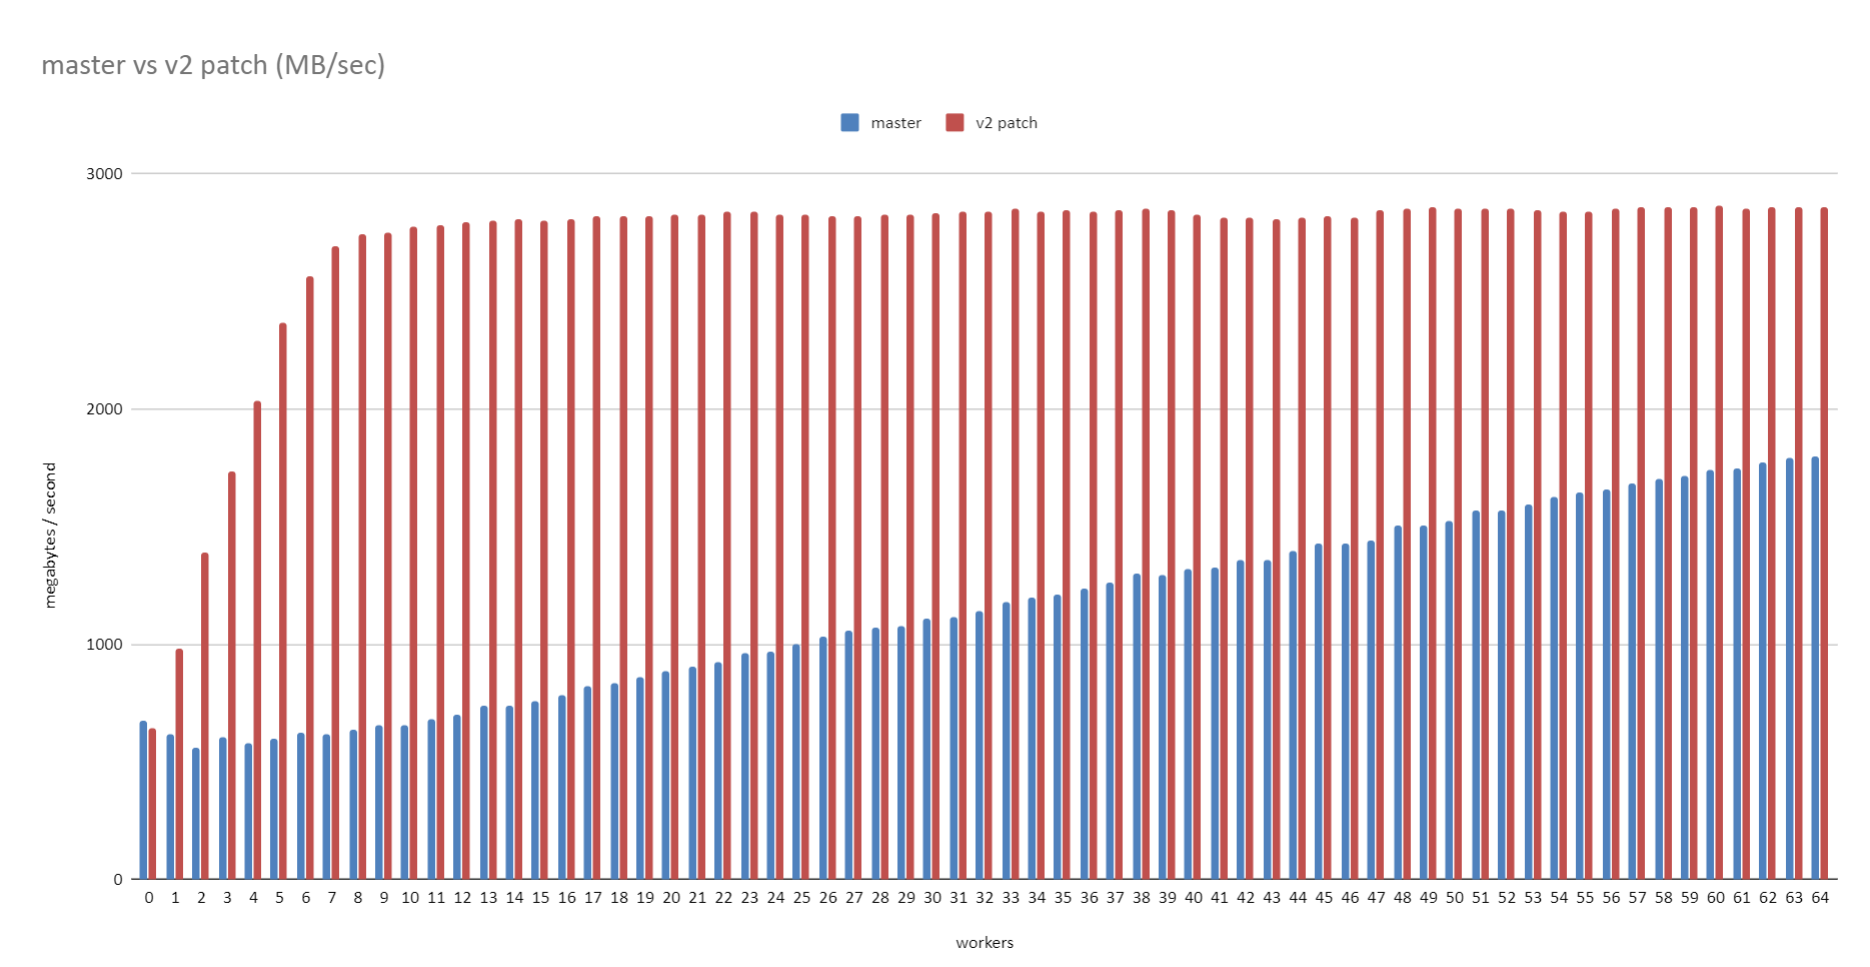
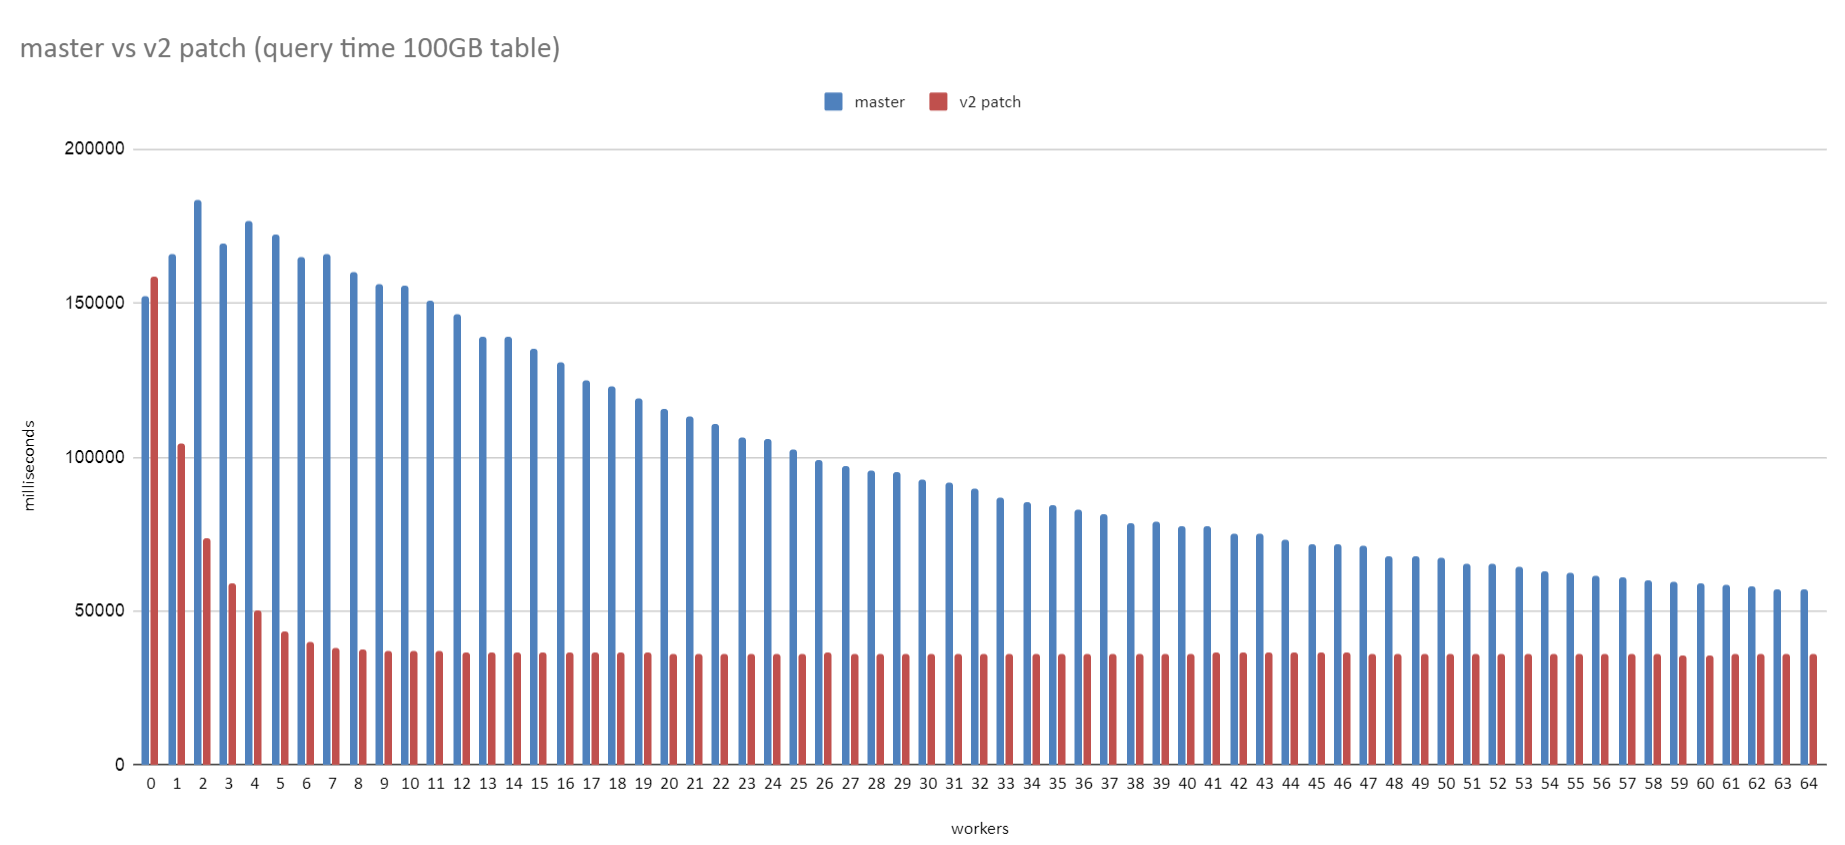
On Mon, 22 Jun 2020 at 16:54, David Rowley <dgrowleyml@gmail.com> wrote:
> I also tested this an AMD machine running Ubuntu 20.04 on kernel
> version 5.4.0-37.  I used the same 100GB table I mentioned in [1], but
> with the query "select * from t where a < 0;", which saves having to
> do any aggregate work.

I just wanted to add a note here that Thomas and I just discussed this
a bit offline. He recommended I try setting the kernel readhead a bit
higher.

It was set to 128kB, so I cranked it up to 2MB with:

sudo blockdev --setra 4096 /dev/nvme0n1p2

I didn't want to run the full test again as it took quite a long time,
so I just tried with 32 workers.

The first two results here are taken from the test results I just
posted 1 hour ago.

Master readhead=128kB = 89921.283 ms
v2 patch readhead=128kB = 36085.642 ms
master readhead=2MB = 60984.905 ms
v2 patch readhead=2MB = 22611.264 ms

There must be a fairly large element of reading from the page cache
there since 22.6 seconds means 4528MB/sec over the 100GB table. The
maximum for a PCIe 3.0 x4 slot is 3940MB/s

David
On Sun, Jun 21, 2020 at 6:52 PM David Rowley <dgrowleyml@gmail.com> wrote:
> Perhaps that's not a problem though, but then again, perhaps just
> keeping it at 131072 regardless of RELSEG_SIZE and BLCKSZ is also ok.
> The benchmarks I did on Windows [1] showed that the returns diminished
> once we started making the step size some decent amount so my thoughts
> are that I've set PARALLEL_SEQSCAN_MAX_CHUNK_SIZE to something large
> enough that it'll make no difference to the performance anyway. So
> there's probably not much point in giving it too much thought.
>
> Perhaps pg_nextpower2_32(RELSEG_SIZE) would be okay though.

I guess I don't care that much; it was just a thought. Maybe tying it
to RELSEG_SIZE is a bad idea anyway. After all, what if we find cases
where 1GB is too much? Like, how much benefit do we get from making it
1GB rather than 64MB, say? I don't think we should be making this
value big just because we can.

--
Robert Haas
EnterpriseDB: http://www.enterprisedb.com
The Enterprise PostgreSQL Company
Em seg., 22 de jun. de 2020 às 02:53, David Rowley <dgrowleyml@gmail.com> escreveu:
On Mon, 22 Jun 2020 at 16:54, David Rowley <dgrowleyml@gmail.com> wrote:
> I also tested this an AMD machine running Ubuntu 20.04 on kernel
> version 5.4.0-37. I used the same 100GB table I mentioned in [1], but
> with the query "select * from t where a < 0;", which saves having to
> do any aggregate work.
I just wanted to add a note here that Thomas and I just discussed this
a bit offline. He recommended I try setting the kernel readhead a bit
higher.
It was set to 128kB, so I cranked it up to 2MB with:
sudo blockdev --setra 4096 /dev/nvme0n1p2
I didn't want to run the full test again as it took quite a long time,
so I just tried with 32 workers.
The first two results here are taken from the test results I just
posted 1 hour ago.
Master readhead=128kB = 89921.283 ms
v2 patch readhead=128kB = 36085.642 ms
master readhead=2MB = 60984.905 ms
v2 patch readhead=2MB = 22611.264 ms
notebook with i5, 8GB, 256 GB (SSD)
Windows 10 64 bits (2004
msvc 2019 64 bits
Postgresql head (with v2 patch)
Configuration: none
Connection local ipv4 (not localhost)
create table t (a int, b text);
insert into t select x,md5(x::text) from
generate_series(1,1000000*1572.7381809)x;
vacuum freeze t;
insert into t select x,md5(x::text) from
generate_series(1,1000000*1572.7381809)x;
vacuum freeze t;
set max_parallel_workers_per_gather = 0;
Time: 354211,826 ms (05:54,212)
set max_parallel_workers_per_gather = 1;
Time: 332805,773 ms (05:32,806)
set max_parallel_workers_per_gather = 2;
Time: 282566,711 ms (04:42,567)
set max_parallel_workers_per_gather = 3;
Time: 263383,945 ms (04:23,384)
set max_parallel_workers_per_gather = 4;
Time: 255728,259 ms (04:15,728)
set max_parallel_workers_per_gather = 5;
Time: 238288,720 ms (03:58,289)
set max_parallel_workers_per_gather = 6;
Time: 238647,792 ms (03:58,648)
set max_parallel_workers_per_gather = 7;
Time: 231295,763 ms (03:51,296)
set max_parallel_workers_per_gather = 8;
Time: 232502,828 ms (03:52,503)
set max_parallel_workers_per_gather = 9;
Time: 230970,604 ms (03:50,971)
set max_parallel_workers_per_gather = 10;
Time: 232104,182 ms (03:52,104)
set max_parallel_workers_per_gather = 8;
postgres=# explain select count(*) from t;
QUERY PLAN
-------------------------------------------------------------------------------------------
Finalize Aggregate (cost=15564556.43..15564556.44 rows=1 width=8)
-> Gather (cost=15564555.60..15564556.41 rows=8 width=8)
Workers Planned: 8
-> Partial Aggregate (cost=15563555.60..15563555.61 rows=1 width=8)
-> Parallel Seq Scan on t (cost=0.00..15072074.88 rows=196592288 width=0)
(5 rows)
Questions:
1. Why acquire and release lock in retry: loop.
Wouldn't that be better?
/* Grab the spinlock. */
SpinLockAcquire(&pbscan->phs_mutex);
retry:
/*
* If the scan's startblock has not yet been initialized, we must do so
* now. If this is not a synchronized scan, we just start at block 0, but
* if it is a synchronized scan, we must get the starting position from
* the synchronized scan machinery. We can't hold the spinlock while
* doing that, though, so release the spinlock, get the information we
* need, and retry. If nobody else has initialized the scan in the
* meantime, we'll fill in the value we fetched on the second time
* through.
*/
if (pbscan->phs_startblock == InvalidBlockNumber)
{
if (!pbscan->base.phs_syncscan)
pbscan->phs_startblock = 0;
else if (sync_startpage != InvalidBlockNumber)
pbscan->phs_startblock = sync_startpage;
else
{
sync_startpage = ss_get_location(rel, pbscan->phs_nblocks);
goto retry;
}
}
SpinLockRelease(&pbscan->phs_mutex);
}
Acquire lock once, before retry?
2. Is there any configuration to improve performance?
regards,
Ranier Vilela
Ranier,

This topic is largely unrelated to the current thread. Also...

On Mon, Jun 22, 2020 at 12:47 PM Ranier Vilela <ranier.vf@gmail.com> wrote:
> Questions:
> 1. Why acquire and release lock in retry: loop.

This is a super-bad idea. Note the coding rule mentioned in spin.h.
There are many discussion on this mailing list about the importance of
keeping the critical section for a spinlock to a few instructions.
Calling another function that *itself acquires an LWLock* is
definitely not OK.

--
Robert Haas
EnterpriseDB: http://www.enterprisedb.com
The Enterprise PostgreSQL Company
Em seg., 22 de jun. de 2020 às 16:33, Robert Haas <robertmhaas@gmail.com> escreveu:
Ranier,
This topic is largely unrelated to the current thread. Also...
Weel, I was trying to improve the patch for the current thread.
Or perhaps, you are referring to something else, which I may not have understood.
On Mon, Jun 22, 2020 at 12:47 PM Ranier Vilela <ranier.vf@gmail.com> wrote:
> Questions:
> 1. Why acquire and release lock in retry: loop.
This is a super-bad idea. Note the coding rule mentioned in spin.h.
There are many discussion on this mailing list about the importance of
keeping the critical section for a spinlock to a few instructions.
Calling another function that *itself acquires an LWLock* is
definitely not OK.
Perhaps, I was not clear and it is another misunderstanding.
I am not suggesting a function to acquire the lock.
By the way, I did the tests with this change and it worked perfectly.
But, as it is someone else's patch, I asked why to learn.
By the way, my suggestion is with less instructions than the patch.
The only change I asked is why to acquire and release the lock repeatedly within the goto retry, when you already have it.
If I can acquire the lock before retry: and release it only at the end when I leave table_block_parallelscan_startblock_init,
why not do it.
I will attach the suggested excerpt so that I have no doubts about what I am asking.
Ranier Vilela
Вложения
On Fri, Jun 19, 2020 at 2:10 PM David Rowley <dgrowleyml@gmail.com> wrote:
> Here's a patch which caps the maximum chunk size to 131072.  If
> someone doubles the page size then that'll be 2GB instead of 1GB. I'm
> not personally worried about that.

I wonder how this interacts with the sync scan feature.  It has a
conflicting goal...
On Tue, 23 Jun 2020 at 09:52, Thomas Munro <thomas.munro@gmail.com> wrote:
>
> On Fri, Jun 19, 2020 at 2:10 PM David Rowley <dgrowleyml@gmail.com> wrote:
> > Here's a patch which caps the maximum chunk size to 131072.  If
> > someone doubles the page size then that'll be 2GB instead of 1GB. I'm
> > not personally worried about that.
>
> I wonder how this interacts with the sync scan feature.  It has a
> conflicting goal...

Of course, syncscan relies on subsequent scanners finding buffers
cached, either in (ideally) shared buffers or the kernel cache. The
scans need to be roughly synchronised for that to work.  If we go and
make the chunk size too big, then that'll reduce the chances useful
buffers being found by subsequent scans.  It sounds like a good reason
to try and find the smallest chunk size that allows readahead to work
well. The benchmarks I did on Windows certainly show that there are
diminishing returns when the chunk size gets larger, so capping it at
some number of megabytes would probably be a good idea.  It would just
take a bit of work to figure out how many megabytes that should be.
Likely it's going to depend on the size of shared buffers and how much
memory the machine has got, but also what other work is going on that
might be evicting buffers at the same time. Perhaps something in the
range of 2-16MB would be ok.  I can do some tests with that and see if
I can get the same performance as with the larger chunks.

David
On Tue, 23 Jun 2020 at 07:33, Robert Haas <robertmhaas@gmail.com> wrote:
> On Mon, Jun 22, 2020 at 12:47 PM Ranier Vilela <ranier.vf@gmail.com> wrote:
> > Questions:
> > 1. Why acquire and release lock in retry: loop.
>
> This is a super-bad idea. Note the coding rule mentioned in spin.h.
> There are many discussion on this mailing list about the importance of
> keeping the critical section for a spinlock to a few instructions.
> Calling another function that *itself acquires an LWLock* is
> definitely not OK.

Just a short history lesson for Ranier to help clear up any confusion:

Back before 3cda10f41 there was some merit in improving the
performance of these functions. Before that, we used to dish out pages
under a lock. With that old method, if given enough workers and a
simple enough query, we could start to see workers waiting on the lock
just to obtain the next block number they're to work on.  After the
atomics were added in that commit, we didn't really see that again.

What we're trying to fix here is the I/O pattern that these functions
induce and that's all we should be doing here.  Changing this is
tricky to get right as we need to consider so many operating systems
and how they deal with I/O readahead.

David
Em seg., 22 de jun. de 2020 às 23:29, David Rowley <dgrowleyml@gmail.com> escreveu:
On Tue, 23 Jun 2020 at 07:33, Robert Haas <robertmhaas@gmail.com> wrote:
> On Mon, Jun 22, 2020 at 12:47 PM Ranier Vilela <ranier.vf@gmail.com> wrote:
> > Questions:
> > 1. Why acquire and release lock in retry: loop.
>
> This is a super-bad idea. Note the coding rule mentioned in spin.h.
> There are many discussion on this mailing list about the importance of
> keeping the critical section for a spinlock to a few instructions.
> Calling another function that *itself acquires an LWLock* is
> definitely not OK.
Just a short history lesson for Ranier to help clear up any confusion:
Back before 3cda10f41 there was some merit in improving the
performance of these functions. Before that, we used to dish out pages
under a lock. With that old method, if given enough workers and a
simple enough query, we could start to see workers waiting on the lock
just to obtain the next block number they're to work on. After the
atomics were added in that commit, we didn't really see that again.
It is a good explanation. I already imagined it could be to help other processes, but I still wasn't sure.
However, I did a test with this modification (lock before retry), and it worked.
However, I did a test with this modification (lock before retry), and it worked.
What we're trying to fix here is the I/O pattern that these functions
induce and that's all we should be doing here. Changing this is
tricky to get right as we need to consider so many operating systems
and how they deal with I/O readahead.
Yes, I understand that focus here is I/O.
Sorry, by the noise.
regards,
Ranier Vilela
On Tue, 23 Jun 2020 at 10:50, David Rowley <dgrowleyml@gmail.com> wrote:
>
> On Tue, 23 Jun 2020 at 09:52, Thomas Munro <thomas.munro@gmail.com> wrote:
> >
> > On Fri, Jun 19, 2020 at 2:10 PM David Rowley <dgrowleyml@gmail.com> wrote:
> > > Here's a patch which caps the maximum chunk size to 131072.  If
> > > someone doubles the page size then that'll be 2GB instead of 1GB. I'm
> > > not personally worried about that.
> >
> > I wonder how this interacts with the sync scan feature.  It has a
> > conflicting goal...
>
> Of course, syncscan relies on subsequent scanners finding buffers
> cached, either in (ideally) shared buffers or the kernel cache. The
> scans need to be roughly synchronised for that to work.  If we go and
> make the chunk size too big, then that'll reduce the chances useful
> buffers being found by subsequent scans.  It sounds like a good reason
> to try and find the smallest chunk size that allows readahead to work
> well. The benchmarks I did on Windows certainly show that there are
> diminishing returns when the chunk size gets larger, so capping it at
> some number of megabytes would probably be a good idea.  It would just
> take a bit of work to figure out how many megabytes that should be.
> Likely it's going to depend on the size of shared buffers and how much
> memory the machine has got, but also what other work is going on that
> might be evicting buffers at the same time. Perhaps something in the
> range of 2-16MB would be ok.  I can do some tests with that and see if
> I can get the same performance as with the larger chunks.

I did some further benchmarking on both Windows 10 and on Linux with
the 5.4.0-37 kernel running on Ubuntu 20.04.  I started by reducing
PARALLEL_SEQSCAN_MAX_CHUNK_SIZE down to 256 and ran the test multiple
times, each time doubling the PARALLEL_SEQSCAN_MAX_CHUNK_SIZE.  On the
Linux test, I used the standard kernel readhead of 128kB. Thomas and I
discovered earlier that increasing that increases the throughput all
round.

These tests were done with the PARALLEL_SEQSCAN_NCHUNKS as 2048, which
means with the 100GB table I used for testing, the uncapped chunk size
of 8192 blocks would be selected (aka 16MB).  The performance is quite
a bit slower when the chunk size is capped to 256 blocks and it does
increase again with larger maximum chunk sizes, but the returns do get
smaller and smaller with each doubling of
PARALLEL_SEQSCAN_MAX_CHUNK_SIZE. Uncapped, or 8192 did give the best
performance on both Windows and Linux. I didn't test with anything
higher than that.

So, based on these results, it seems 16MBs is not a bad value to cap
the chunk size at. If that turns out to be true for other tests too,
then likely 16MB is not too unrealistic a value to cap the size of the
block chunks to.

Please see the attached v2_on_linux.png and v2_on_windows.png for the
results of that.

I also performed another test to see how the performance looks with
both synchronize_seqscans on and off.  To test this I decided that a
100GB table on a 64GB RAM machine was just not larger enough, so I
increased the table size to 800GB. I set parallel_workers for the
relation to 10 and ran:

drowley@amd3990x:~$ cat bench.sql
select * from t where a < 0;
pgbench -n -f bench.sql -T 10800 -P 600 -c 6 -j 6 postgres

(This query returns 0 rows).

So each query had 11 backends (including the main process) and there
were 6 of those running concurrently. i.e 66 backends busy working on
the problem in total.

The results of that were:

Auto chunk size selection without any cap (for an 800GB table that's
65536 blocks)

synchronize_seqscans = on: latency average = 372738.134 ms (2197.7 MB/s) <-- bad
synchronize_seqscans = off: latency average = 320204.028 ms (2558.3 MB/s)

So here it seems that synchronize_seqscans = on slows things down.

Trying again after capping the number of blocks per chunk to 8192:

synchronize_seqscans = on: latency average = 321969.172 ms (2544.3 MB/s)
synchronize_seqscans = off: latency average = 321389.523 ms (2548.9 MB/s)

So the performance there is about the same.

I was surprised to see that synchronize_seqscans = off didn't slow
down the performance by about 6x. So I tested to see what master does,
and:

synchronize_seqscans = on: latency average = 1070226.162 ms (765.4MB/s)
synchronize_seqscans = off: latency average = 1085846.859 ms (754.4MB/s)

It does pretty poorly in both cases.

The full results of that test are in the attached
800gb_table_synchronize_seqscans_test.txt file.

In summary, based on these tests, I don't think we're making anything
worse in regards to synchronize_seqscans if we cap the maximum number
of blocks to allocate to each worker at once to 8192. Perhaps there's
some argument for using something smaller than that for servers with
very little RAM, but I don't personally think so as it still depends
on the table size and It's hard to imagine tables in the hundreds of
GBs on servers that struggle with chunk allocations of 16MB.  The
table needs to be at least ~70GB to get a 8192 chunk size with the
current v2 patch settings.

David
Вложения
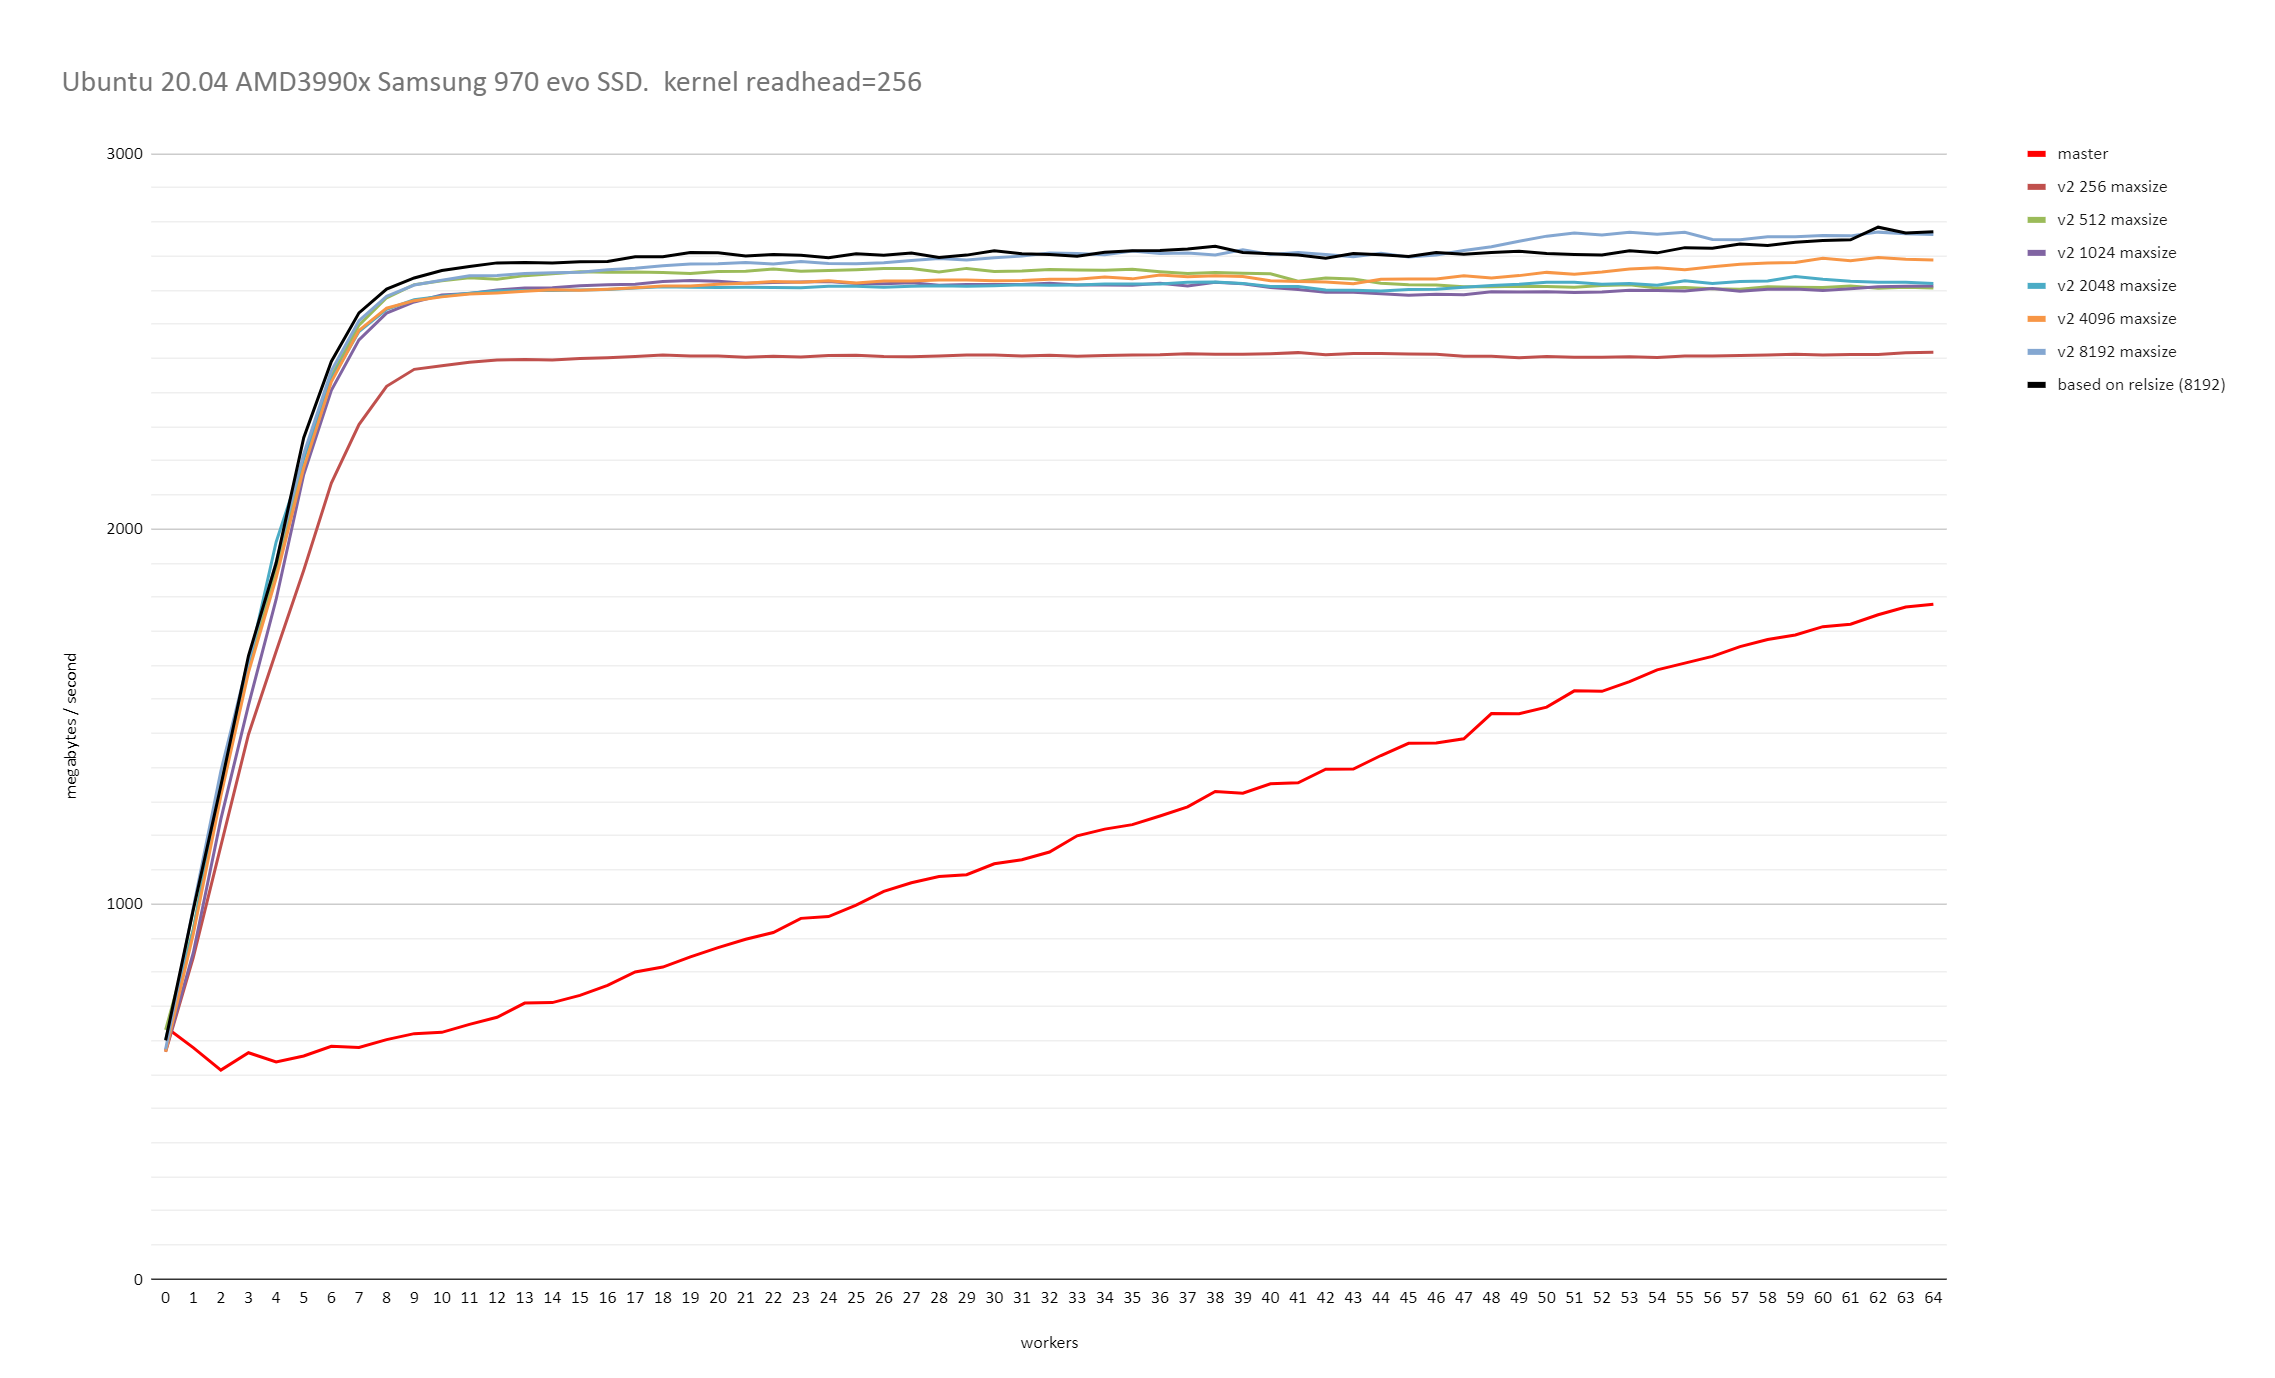
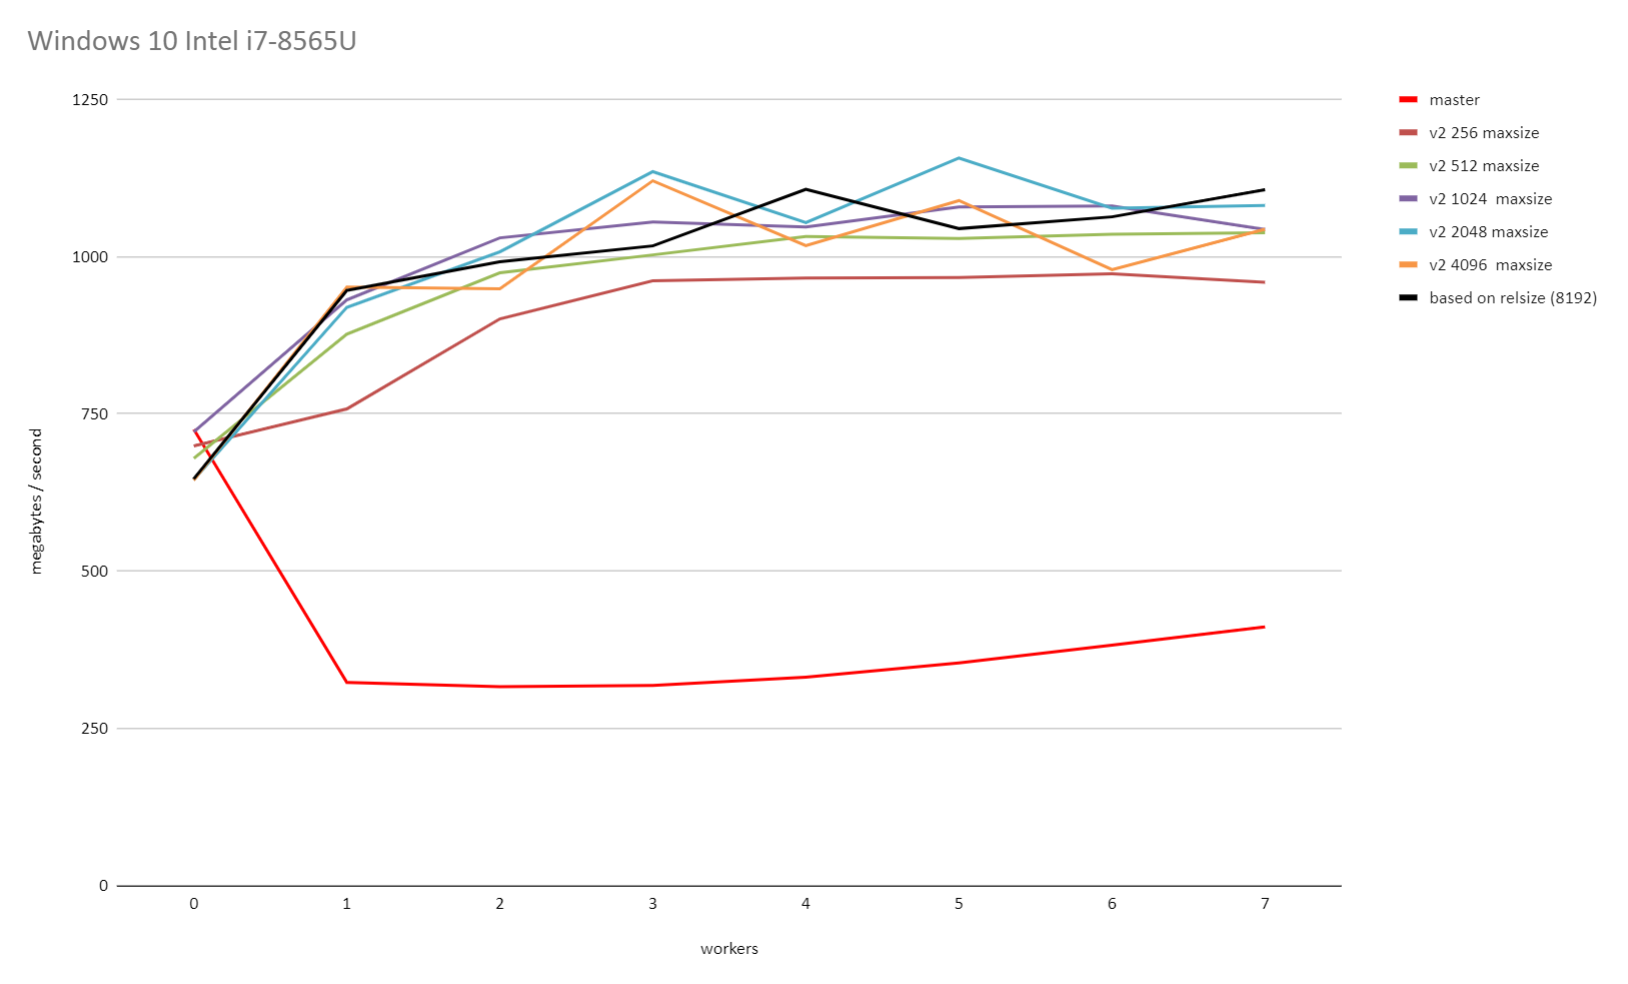
On Tue, Jun 23, 2020 at 11:53 PM David Rowley <dgrowleyml@gmail.com> wrote:
> In summary, based on these tests, I don't think we're making anything
> worse in regards to synchronize_seqscans if we cap the maximum number
> of blocks to allocate to each worker at once to 8192. Perhaps there's
> some argument for using something smaller than that for servers with
> very little RAM, but I don't personally think so as it still depends
> on the table size and It's hard to imagine tables in the hundreds of
> GBs on servers that struggle with chunk allocations of 16MB.  The
> table needs to be at least ~70GB to get a 8192 chunk size with the
> current v2 patch settings.

Nice research. That makes me happy. I had a feeling the maximum useful
chunk size ought to be more in this range than the larger values we
were discussing before, but I didn't even think about the effect on
synchronized scans.

--
Robert Haas
EnterpriseDB: http://www.enterprisedb.com
The Enterprise PostgreSQL Company
On Fri, Jun 26, 2020 at 3:33 AM Robert Haas <robertmhaas@gmail.com> wrote:
> On Tue, Jun 23, 2020 at 11:53 PM David Rowley <dgrowleyml@gmail.com> wrote:
> > In summary, based on these tests, I don't think we're making anything
> > worse in regards to synchronize_seqscans if we cap the maximum number
> > of blocks to allocate to each worker at once to 8192. Perhaps there's
> > some argument for using something smaller than that for servers with
> > very little RAM, but I don't personally think so as it still depends
> > on the table size and It's hard to imagine tables in the hundreds of
> > GBs on servers that struggle with chunk allocations of 16MB.  The
> > table needs to be at least ~70GB to get a 8192 chunk size with the
> > current v2 patch settings.
>
> Nice research. That makes me happy. I had a feeling the maximum useful
> chunk size ought to be more in this range than the larger values we
> were discussing before, but I didn't even think about the effect on
> synchronized scans.

+1.  This seems about right to me.  We can always reopen the
discussion if someone shows up with evidence in favour of a tweak to
the formula, but this seems to address the basic problem pretty well,
and also fits nicely with future plans for AIO and DIO.
On Tue, 14 Jul 2020 at 19:13, Thomas Munro <thomas.munro@gmail.com> wrote:
>
> On Fri, Jun 26, 2020 at 3:33 AM Robert Haas <robertmhaas@gmail.com> wrote:
> > On Tue, Jun 23, 2020 at 11:53 PM David Rowley <dgrowleyml@gmail.com> wrote:
> > > In summary, based on these tests, I don't think we're making anything
> > > worse in regards to synchronize_seqscans if we cap the maximum number
> > > of blocks to allocate to each worker at once to 8192. Perhaps there's
> > > some argument for using something smaller than that for servers with
> > > very little RAM, but I don't personally think so as it still depends
> > > on the table size and It's hard to imagine tables in the hundreds of
> > > GBs on servers that struggle with chunk allocations of 16MB.  The
> > > table needs to be at least ~70GB to get a 8192 chunk size with the
> > > current v2 patch settings.
> >
> > Nice research. That makes me happy. I had a feeling the maximum useful
> > chunk size ought to be more in this range than the larger values we
> > were discussing before, but I didn't even think about the effect on
> > synchronized scans.
>
> +1.  This seems about right to me.  We can always reopen the
> discussion if someone shows up with evidence in favour of a tweak to
> the formula, but this seems to address the basic problem pretty well,
> and also fits nicely with future plans for AIO and DIO.

Thank you both of you for having a look at the results.

I'm now pretty happy with this too. I do understand that we've not
exactly exhaustively tested all our supported operating systems.
However, we've seen some great speedups with Windows 10 and Linux with
SSDs. Thomas saw great speedups with FreeBSD with the original patch
using chunk sizes of 64 blocks. (I wonder if it's worth verifying that
it increases further with the latest patch with the same test you did
in the original email on this thread?)

I'd like to propose that if anyone wants to do further testing on
other operating systems with SSDs or HDDs then it would be good if
that could be done within a 1 week from this email. There are various
benchmarking ideas on this thread for inspiration.

If we've not seen any performance regressions within 1 week, then I
propose that we (pending final review) push this to allow wider
testing. It seems we're early enough in the PG14 cycle that there's a
large window of time for us to do something about any reported
performance regressions that come in.

I also have in mind that Amit was keen to see a GUC or reloption to
allow users to control this. My thoughts on that are still that it
would be possible to craft a case where we scan an entire heap to get
a very small number of rows that are all located in the same area in
the table and then call some expensive function on those rows. The
chunk size ramp down code will help reduce the chances of one worker
running on much longer than its co-workers, but not eliminate the
chances.  Even the code as it stands today could suffer from this to a
lesser extent if all the matching rows are on a single page. My
current thoughts are that this just seems unlikely and that the
granularity of 1 block for cases like this was never that great
anyway. I suppose a more ideal plan shape would "Distribute" matching
rows to allow another set of workers to pick these rows up one-by-one
and process them. Our to-date lack of such an operator probably counts
a little towards the fact that one parallel worker being tied up with
a large amount of work is not that common.  Based on those thoughts,
I'd like to avoid any GUC/reloption until we see evidence that it's
really needed.

Any objections to any of the above?

David
On Wed, Jul 15, 2020 at 5:55 AM David Rowley <dgrowleyml@gmail.com> wrote:
>
> On Tue, 14 Jul 2020 at 19:13, Thomas Munro <thomas.munro@gmail.com> wrote:
> >
> > On Fri, Jun 26, 2020 at 3:33 AM Robert Haas <robertmhaas@gmail.com> wrote:
> > > On Tue, Jun 23, 2020 at 11:53 PM David Rowley <dgrowleyml@gmail.com> wrote:
> > > > In summary, based on these tests, I don't think we're making anything
> > > > worse in regards to synchronize_seqscans if we cap the maximum number
> > > > of blocks to allocate to each worker at once to 8192. Perhaps there's
> > > > some argument for using something smaller than that for servers with
> > > > very little RAM, but I don't personally think so as it still depends
> > > > on the table size and It's hard to imagine tables in the hundreds of
> > > > GBs on servers that struggle with chunk allocations of 16MB.  The
> > > > table needs to be at least ~70GB to get a 8192 chunk size with the
> > > > current v2 patch settings.
> > >
> > > Nice research. That makes me happy. I had a feeling the maximum useful
> > > chunk size ought to be more in this range than the larger values we
> > > were discussing before, but I didn't even think about the effect on
> > > synchronized scans.
> >
> > +1.  This seems about right to me.  We can always reopen the
> > discussion if someone shows up with evidence in favour of a tweak to
> > the formula, but this seems to address the basic problem pretty well,
> > and also fits nicely with future plans for AIO and DIO.
>
> Thank you both of you for having a look at the results.
>
> I'm now pretty happy with this too. I do understand that we've not
> exactly exhaustively tested all our supported operating systems.
> However, we've seen some great speedups with Windows 10 and Linux with
> SSDs. Thomas saw great speedups with FreeBSD with the original patch
> using chunk sizes of 64 blocks. (I wonder if it's worth verifying that
> it increases further with the latest patch with the same test you did
> in the original email on this thread?)
>
> I'd like to propose that if anyone wants to do further testing on
> other operating systems with SSDs or HDDs then it would be good if
> that could be done within a 1 week from this email. There are various
> benchmarking ideas on this thread for inspiration.
>

Yeah, I agree it would be good if we could do what you said.

> If we've not seen any performance regressions within 1 week, then I
> propose that we (pending final review) push this to allow wider
> testing.

I think Soumyadeep has reported a regression case [1] with the earlier
version of the patch.  I am not sure if we have verified that the
situation improves with the latest version of the patch.  I request
Soumyadeep to please try once with the latest patch.

[1] - https://www.postgresql.org/message-id/CADwEdoqirzK3H8bB%3DxyJ192EZCNwGfcCa_WJ5GHVM7Sv8oenuA%40mail.gmail.com
--
With Regards,
Amit Kapila.
EnterpriseDB: http://www.enterprisedb.com
On Wed, 15 Jul 2020 at 14:51, Amit Kapila <amit.kapila16@gmail.com> wrote:
>
> On Wed, Jul 15, 2020 at 5:55 AM David Rowley <dgrowleyml@gmail.com> wrote:
> > If we've not seen any performance regressions within 1 week, then I
> > propose that we (pending final review) push this to allow wider
> > testing.
>
> I think Soumyadeep has reported a regression case [1] with the earlier
> version of the patch.  I am not sure if we have verified that the
> situation improves with the latest version of the patch.  I request
> Soumyadeep to please try once with the latest patch.

Yeah, it would be good to see some more data points on that test.
Jumping from 2 up to 6 workers just leaves us to guess where the
performance started to become bad. It would be good to know if the
regression is repeatable or if it was affected by some other process.

I see the disk type on that report was Google PersistentDisk. I don't
pretend to be any sort of expert on network filesystems, but I guess a
regression would be possible in that test case if say there was an
additional layer of caching of very limited size between the kernel
cache and the disks, maybe on a remote machine. If it were doing some
sort of prefetching to try to reduce latency and requests to the
actual disks then perhaps going up to 6 workers with 64 chunk size (as
Thomas' patch used at that time) caused more cache misses on that
cache due to the requests exceeding what had already been prefetched.
That's just a stab in the dark. Maybe someone with knowledge of these
network file systems can come up with a better theory.

It would be good to see EXPLAIN (ANALYZE, BUFFERS) with SET
track_io_timing = on; for each value of max_parallel_workers.

David

> [1] - https://www.postgresql.org/message-id/CADwEdoqirzK3H8bB%3DxyJ192EZCNwGfcCa_WJ5GHVM7Sv8oenuA%40mail.gmail.com
On Wednesday, July 15, 2020 12:52 PM (GMT+9), David Rowley wrote:

>On Wed, 15 Jul 2020 at 14:51, Amit Kapila <amit.kapila16@gmail.com> wrote:
>>
>> On Wed, Jul 15, 2020 at 5:55 AM David Rowley <dgrowleyml@gmail.com> wrote:
>>> If we've not seen any performance regressions within 1 week, then I
>>> propose that we (pending final review) push this to allow wider
>>> testing.
>>
>> I think Soumyadeep has reported a regression case [1] with the earlier
>> version of the patch.  I am not sure if we have verified that the
>> situation improves with the latest version of the patch.  I request
>> Soumyadeep to please try once with the latest patch.
>...
>Yeah, it would be good to see some more data points on that test.
>Jumping from 2 up to 6 workers just leaves us to guess where the performance
>started to become bad. >It would be good to know if the regression is
>repeatable or if it was affected by some other process.
>...
>It would be good to see EXPLAIN (ANALYZE, BUFFERS) with SET track_io_timing = on;
>for each value of >max_parallel_workers.

Hi,

If I'm following the thread correctly, we may have gains on this patch
of Thomas and David, but we need to test its effects on different
filesystems. It's also been clarified by David through benchmark tests
that synchronize_seqscans is not affected as long as the set cap per
chunk size of parallel scan is at 8192.

I also agree that having a control on this through GUC can be
beneficial for users, however, that can be discussed in another
thread or development in the future.

David Rowley wrote:
>I'd like to propose that if anyone wants to do further testing on
>other operating systems with SSDs or HDDs then it would be good if
>that could be done within a 1 week from this email. There are various
>benchmarking ideas on this thread for inspiration.

I'd like to join on testing it, this one using HDD, and at the bottom
are the results. Due to my machine limitations, I only tested
0~6 workers, that even if I increase max_parallel_workers_per_gather
more than that, the query planner would still cap the workers at 6.
I also set the track_io_timing to on as per David's recommendation.

Tested on:
XFS filesystem, HDD virtual machine
RHEL4, 64-bit,
4 CPUs, Intel Core Processor (Haswell, IBRS)
PostgreSQL 14devel on x86_64-pc-linux-gnu


----Test Case (Soumyadeep's) [1]

shared_buffers = 32MB (to use OS page cache)

create table t_heap as select generate_series(1, 100000000) i;   --about 3.4GB size

SET track_io_timing = on;

\timing

set max_parallel_workers_per_gather = 0;      --0 to 6

SELECT count(*) from t_heap;
EXPLAIN (ANALYZE, BUFFERS) SELECT count(*) from t_heap;

[Summary]
I used the same query from the thread. However, the sql query execution time
and query planner execution time results between the master and patched do
not vary much.
OTOH, in terms of I/O stats, I observed similar regression in both master
and patched as we increase max_parallel_workers_per_gather.

It could also be possible that each benchmark setting for max_parallel_workers_per_gather
is affected by previous result . IOW, later benchmark runs benefit from the data cached by
previous runs on OS level.
Any advice? Please refer to tables below for results.

(MASTER/UNPATCHED)
| Parallel Workers | SQLExecTime  |  PlannerExecTime |  Buffers                    |
|------------------|--------------|------------------|-----------------------------|
| 0                | 12942.606 ms | 37031.786 ms     | shared hit=32 read=442446   |
| 1                |  4959.567 ms | 17601.813 ms     | shared hit=128 read=442350  |
| 2                |  3273.610 ms | 11766.441 ms     | shared hit=288 read=442190  |
| 3                |  2449.342 ms |  9057.236 ms     | shared hit=512 read=441966  |
| 4                |  2482.404 ms |  8853.702 ms     | shared hit=800 read=441678  |
| 5                |  2430.944 ms |  8777.630 ms     | shared hit=1152 read=441326 |
| 6                |  2493.416 ms |  8798.200 ms     | shared hit=1568 read=440910 |

(PATCHED V2)
| Parallel Workers | SQLExecTime |  PlannerExecTime |  Buffers                    |
|------------------|-------------|------------------|-----------------------------|
| 0                | 9283.193 ms | 34471.050 ms     | shared hit=2624 read=439854 |
| 1                | 4872.728 ms | 17449.725 ms     | shared hit=2528 read=439950 |
| 2                | 3240.301 ms | 11556.243 ms     | shared hit=2368 read=440110 |
| 3                | 2419.512 ms |  8709.572 ms     | shared hit=2144 read=440334 |
| 4                | 2746.820 ms |  8768.812 ms     | shared hit=1856 read=440622 |
| 5                | 2424.687 ms |  8699.762 ms     | shared hit=1504 read=440974 |
| 6                | 2581.999 ms |  8627.627 ms     | shared hit=1440 read=441038 |

(I/O Read Stat)
| Parallel Workers | I/O (Master)  | I/O (Patched) |
|------------------|---------------|---------------|
| 0                | read=1850.233 | read=1071.209 |
| 1                | read=1246.939 | read=1115.361 |
| 2                | read=1079.837 | read=1090.425 |
| 3                | read=1342.133 | read=1094.115 |
| 4                | read=1478.821 | read=1355.966 |
| 5                | read=1691.244 | read=1679.446 |
| 6                | read=1952.384 | read=1881.733 |

I hope this helps in a way.

Regards,
Kirk Jamison

[1] https://www.postgresql.org/message-id/CADwEdoqirzK3H8bB=xyJ192EZCNwGfcCa_WJ5GHVM7Sv8oenuA@mail.gmail.com
On Fri, Jul 17, 2020 at 11:35 AM k.jamison@fujitsu.com
<k.jamison@fujitsu.com> wrote:
>
> On Wednesday, July 15, 2020 12:52 PM (GMT+9), David Rowley wrote:
>
> >On Wed, 15 Jul 2020 at 14:51, Amit Kapila <amit.kapila16@gmail.com> wrote:
> >>
> >> On Wed, Jul 15, 2020 at 5:55 AM David Rowley <dgrowleyml@gmail.com> wrote:
> >>> If we've not seen any performance regressions within 1 week, then I
> >>> propose that we (pending final review) push this to allow wider
> >>> testing.
> >>
> >> I think Soumyadeep has reported a regression case [1] with the earlier
> >> version of the patch.  I am not sure if we have verified that the
> >> situation improves with the latest version of the patch.  I request
> >> Soumyadeep to please try once with the latest patch.
> >...
> >Yeah, it would be good to see some more data points on that test.
> >Jumping from 2 up to 6 workers just leaves us to guess where the performance
> >started to become bad. >It would be good to know if the regression is
> >repeatable or if it was affected by some other process.
> >...
> >It would be good to see EXPLAIN (ANALYZE, BUFFERS) with SET track_io_timing = on;
> >for each value of >max_parallel_workers.
>
> Hi,
>
> If I'm following the thread correctly, we may have gains on this patch
> of Thomas and David, but we need to test its effects on different
> filesystems. It's also been clarified by David through benchmark tests
> that synchronize_seqscans is not affected as long as the set cap per
> chunk size of parallel scan is at 8192.
>
> I also agree that having a control on this through GUC can be
> beneficial for users, however, that can be discussed in another
> thread or development in the future.
>
> David Rowley wrote:
> >I'd like to propose that if anyone wants to do further testing on
> >other operating systems with SSDs or HDDs then it would be good if
> >that could be done within a 1 week from this email. There are various
> >benchmarking ideas on this thread for inspiration.
>
> I'd like to join on testing it, this one using HDD, and at the bottom
> are the results. Due to my machine limitations, I only tested
> 0~6 workers, that even if I increase max_parallel_workers_per_gather
> more than that, the query planner would still cap the workers at 6.
> I also set the track_io_timing to on as per David's recommendation.
>
> Tested on:
> XFS filesystem, HDD virtual machine
> RHEL4, 64-bit,
> 4 CPUs, Intel Core Processor (Haswell, IBRS)
> PostgreSQL 14devel on x86_64-pc-linux-gnu
>
>
> ----Test Case (Soumyadeep's) [1]
>
> shared_buffers = 32MB (to use OS page cache)
>
> create table t_heap as select generate_series(1, 100000000) i;   --about 3.4GB size
>
> SET track_io_timing = on;
>
> \timing
>
> set max_parallel_workers_per_gather = 0;      --0 to 6
>
> SELECT count(*) from t_heap;
> EXPLAIN (ANALYZE, BUFFERS) SELECT count(*) from t_heap;
>
> [Summary]
> I used the same query from the thread. However, the sql query execution time
> and query planner execution time results between the master and patched do
> not vary much.
> OTOH, in terms of I/O stats, I observed similar regression in both master
> and patched as we increase max_parallel_workers_per_gather.
>
> It could also be possible that each benchmark setting for max_parallel_workers_per_gather
> is affected by previous result . IOW, later benchmark runs benefit from the data cached by
> previous runs on OS level.
>

Yeah, I think to some extent that is visible in results because, after
patch, at 0 workers, the execution time is reduced significantly
whereas there is not much difference at other worker counts.  I think
for non-parallel case (0 workers), there shouldn't be any difference.
Also, I am not sure if there is any reason why after patch the number
of shared hits is improved, probably due to caching effects?

> Any advice?

I think recreating the database and restarting the server after each
run might help in getting consistent results.  Also, you might want to
take median of three runs.

--
With Regards,
Amit Kapila.
EnterpriseDB: http://www.enterprisedb.com
On Friday, July 17, 2020 6:18 PM (GMT+9), Amit Kapila wrote:

> On Fri, Jul 17, 2020 at 11:35 AM k.jamison@fujitsu.com <k.jamison@fujitsu.com>
> wrote:
> >
> > On Wednesday, July 15, 2020 12:52 PM (GMT+9), David Rowley wrote:
> >
> > >On Wed, 15 Jul 2020 at 14:51, Amit Kapila <amit.kapila16@gmail.com> wrote:
> > >>
> > >> On Wed, Jul 15, 2020 at 5:55 AM David Rowley <dgrowleyml@gmail.com>
> wrote:
> > >>> If we've not seen any performance regressions within 1 week, then
> > >>> I propose that we (pending final review) push this to allow wider
> > >>> testing.
> > >>
> > >> I think Soumyadeep has reported a regression case [1] with the
> > >> earlier version of the patch.  I am not sure if we have verified
> > >> that the situation improves with the latest version of the patch.
> > >> I request Soumyadeep to please try once with the latest patch.
> > >...
> > >Yeah, it would be good to see some more data points on that test.
> > >Jumping from 2 up to 6 workers just leaves us to guess where the
> > >performance started to become bad. >It would be good to know if the
> > >regression is repeatable or if it was affected by some other process.
> > >...
> > >It would be good to see EXPLAIN (ANALYZE, BUFFERS) with SET
> > >track_io_timing = on; for each value of >max_parallel_workers.
> >
> > Hi,
> >
> > If I'm following the thread correctly, we may have gains on this patch
> > of Thomas and David, but we need to test its effects on different
> > filesystems. It's also been clarified by David through benchmark tests
> > that synchronize_seqscans is not affected as long as the set cap per
> > chunk size of parallel scan is at 8192.
> >
> > I also agree that having a control on this through GUC can be
> > beneficial for users, however, that can be discussed in another thread
> > or development in the future.
> >
> > David Rowley wrote:
> > >I'd like to propose that if anyone wants to do further testing on
> > >other operating systems with SSDs or HDDs then it would be good if
> > >that could be done within a 1 week from this email. There are various
> > >benchmarking ideas on this thread for inspiration.
> >
> > I'd like to join on testing it, this one using HDD, and at the bottom
> > are the results. Due to my machine limitations, I only tested
> > 0~6 workers, that even if I increase max_parallel_workers_per_gather
> > more than that, the query planner would still cap the workers at 6.
> > I also set the track_io_timing to on as per David's recommendation.
> >
> > Tested on:
> > XFS filesystem, HDD virtual machine
> > RHEL4, 64-bit,
> > 4 CPUs, Intel Core Processor (Haswell, IBRS) PostgreSQL 14devel on
> > x86_64-pc-linux-gnu
> >
> >
> > ----Test Case (Soumyadeep's) [1]
> >
> > shared_buffers = 32MB (to use OS page cache)
> >
> > create table t_heap as select generate_series(1, 100000000) i;   --about
> 3.4GB size
> >
> > SET track_io_timing = on;
> >
> > \timing
> >
> > set max_parallel_workers_per_gather = 0;      --0 to 6
> >
> > SELECT count(*) from t_heap;
> > EXPLAIN (ANALYZE, BUFFERS) SELECT count(*) from t_heap;
> >
> > [Summary]
> > I used the same query from the thread. However, the sql query
> > execution time and query planner execution time results between the
> > master and patched do not vary much.
> > OTOH, in terms of I/O stats, I observed similar regression in both
> > master and patched as we increase max_parallel_workers_per_gather.
> >
> > It could also be possible that each benchmark setting for
> > max_parallel_workers_per_gather is affected by previous result . IOW,
> > later benchmark runs benefit from the data cached by previous runs on OS level.
> >
>
> Yeah, I think to some extent that is visible in results because, after patch, at 0
> workers, the execution time is reduced significantly whereas there is not much
> difference at other worker counts.  I think for non-parallel case (0 workers),
> there shouldn't be any difference.
> Also, I am not sure if there is any reason why after patch the number of shared hits
> is improved, probably due to caching effects?
>
> > Any advice?
>
> I think recreating the database and restarting the server after each run might help
> in getting consistent results.  Also, you might want to take median of three runs.

Thank you for the advice. I repeated the test as per your advice and average of 3 runs
per worker/s planned.
It still shows the following similar performance results between Master and Patch V2.
I wonder why there's no difference though.

The test on my machine is roughly like this:

createdb test
psql -d test
create table t_heap as select generate_series(1, 100000000) i;
\q

pg_ctl restart
psql -d test
SET track_io_timing = on;
SET max_parallel_workers_per_gather = 0;
SHOW max_parallel_workers_per_gather;
EXPLAIN (ANALYZE, BUFFERS) SELECT count(*) from t_heap;
\timing
SELECT count(*) from t_heap;

drop table t_heap;
\q
dropdb test
pg_ctl restart

Below are the results. Again, almost no discernible difference between the master and patch.
Also, the results when max_parallel_workers_per_gather is more than 4 could be inaccurate
due to my machine's limitation of only having v4 CPUs. Even so, query planner capped it at
6 workers.

Query Planner I/O Timings (track_io_timing = on) in ms :
| Worker | I/O READ (Master) | I/O READ (Patch) | I/O WRITE (Master) | I/O WRITE (Patch) |
|--------|-------------------|------------------|--------------------|-------------------|
| 0      | "1,130.777"       | "1,250.821"      | "01,698.051"       | "01,733.439"      |
| 1      | "1,603.016"       | "1,660.767"      | "02,312.248"       | "02,291.661"      |
| 2      | "2,036.269"       | "2,107.066"      | "02,698.216"       | "02,796.893"      |
| 3      | "2,298.811"       | "2,307.254"      | "05,695.991"       | "05,894.183"      |
| 4      | "2,098.642"       | "2,135.960"      | "23,837.088"       | "26,537.158"      |
| 5      | "1,956.536"       | "1,997.464"      | "45,891.851"       | "48,049.338"      |
| 6      | "2,201.816"       | "2,219.001"      | "61,937.828"       | "67,809.486"      |

Query Planner Execution Time (ms):
| Worker | QueryPlanner (Master) | QueryPlanner (Patch) |
|--------|-----------------------|----------------------|
| 0.000  | "40,454.252"          | "40,521.578"         |
| 1.000  | "21,332.067"          | "21,205.068"         |
| 2.000  | "14,266.756"          | "14,385.539"         |
| 3.000  | "11,597.936"          | "11,722.055"         |
| 4.000  | "12,937.468"          | "13,439.247"         |
| 5.000  | "14,383.083"          | "14,782.866"         |
| 6.000  | "14,671.336"          | "15,507.581"         |

Based from the results above, the I/O latency increases as number of workers
also increase. Despite that, the query planner execution time is almost closely same
when 2 or more workers are used (14~11s). Same results between Master and Patch V2.

As for buffers, same results are shown per worker (both Master and Patch).
| Worker | Buffers                                          |
|--------|--------------------------------------------------|
| 0      | shared read=442478 dirtied=442478 written=442446 |
| 1      | shared read=442478 dirtied=442478 written=442414 |
| 2      | shared read=442478 dirtied=442478 written=442382 |
| 3      | shared read=442478 dirtied=442478 written=442350 |
| 4      | shared read=442478 dirtied=442478 written=442318 |
| 5      | shared read=442478 dirtied=442478 written=442286 |
| 6      | shared read=442478 dirtied=442478 written=442254 |


SQL Query Execution Time (ms) :
| Worker | SQL (Master) | SQL (Patch)  |
|--------|--------------|--------------|
| 0      | "10,418.606" | "10,377.377" |
| 1      | "05,427.460"  | "05,402.727" |
| 2      | "03,662.998"  | "03,650.277" |
| 3      | "02,718.837"  | "02,692.871" |
| 4      | "02,759.802"  | "02,693.370" |
| 5      | "02,761.834"  | "02,682.590" |
| 6      | "02,711.434"  | "02,726.332" |

The SQL query execution time definitely benefitted from previous run of query planner,
so the results are faster. But again, both Master and Patched have almost the same results.
Nonetheless, the execution time is almost consistent when
max_parallel_workers_per_gather is 2 (default) and above.

I am definitely missing something. Perhaps I think I could not understand why there's no
I/O difference between the Master and Patched (V2). Or has it been already improved
even without this patch?

Kind regards,
Kirk Jamison
On Tue, Jul 21, 2020 at 8:06 AM k.jamison@fujitsu.com
<k.jamison@fujitsu.com> wrote:
>
> Thank you for the advice. I repeated the test as per your advice and average of 3 runs
> per worker/s planned.
> It still shows the following similar performance results between Master and Patch V2.
> I wonder why there's no difference though.
>
> The test on my machine is roughly like this:
>
> createdb test
> psql -d test
> create table t_heap as select generate_series(1, 100000000) i;
> \q
>
> pg_ctl restart
> psql -d test
> SET track_io_timing = on;
> SET max_parallel_workers_per_gather = 0;
> SHOW max_parallel_workers_per_gather;
> EXPLAIN (ANALYZE, BUFFERS) SELECT count(*) from t_heap;
> \timing
> SELECT count(*) from t_heap;
>
> drop table t_heap;
> \q
> dropdb test
> pg_ctl restart
>
> Below are the results. Again, almost no discernible difference between the master and patch.
> Also, the results when max_parallel_workers_per_gather is more than 4 could be inaccurate
> due to my machine's limitation of only having v4 CPUs. Even so, query planner capped it at
> 6 workers.
>
> Query Planner I/O Timings (track_io_timing = on) in ms :
> | Worker | I/O READ (Master) | I/O READ (Patch) | I/O WRITE (Master) | I/O WRITE (Patch) |
> |--------|-------------------|------------------|--------------------|-------------------|
> | 0      | "1,130.777"       | "1,250.821"      | "01,698.051"       | "01,733.439"      |
> | 1      | "1,603.016"       | "1,660.767"      | "02,312.248"       | "02,291.661"      |
> | 2      | "2,036.269"       | "2,107.066"      | "02,698.216"       | "02,796.893"      |
> | 3      | "2,298.811"       | "2,307.254"      | "05,695.991"       | "05,894.183"      |
> | 4      | "2,098.642"       | "2,135.960"      | "23,837.088"       | "26,537.158"      |
> | 5      | "1,956.536"       | "1,997.464"      | "45,891.851"       | "48,049.338"      |
> | 6      | "2,201.816"       | "2,219.001"      | "61,937.828"       | "67,809.486"      |
>
> Query Planner Execution Time (ms):
> | Worker | QueryPlanner (Master) | QueryPlanner (Patch) |
> |--------|-----------------------|----------------------|
> | 0.000  | "40,454.252"          | "40,521.578"         |
> | 1.000  | "21,332.067"          | "21,205.068"         |
> | 2.000  | "14,266.756"          | "14,385.539"         |
> | 3.000  | "11,597.936"          | "11,722.055"         |
> | 4.000  | "12,937.468"          | "13,439.247"         |
> | 5.000  | "14,383.083"          | "14,782.866"         |
> | 6.000  | "14,671.336"          | "15,507.581"         |
>
> Based from the results above, the I/O latency increases as number of workers
> also increase. Despite that, the query planner execution time is almost closely same
> when 2 or more workers are used (14~11s). Same results between Master and Patch V2.
>
> As for buffers, same results are shown per worker (both Master and Patch).
> | Worker | Buffers                                          |
> |--------|--------------------------------------------------|
> | 0      | shared read=442478 dirtied=442478 written=442446 |
> | 1      | shared read=442478 dirtied=442478 written=442414 |
> | 2      | shared read=442478 dirtied=442478 written=442382 |
> | 3      | shared read=442478 dirtied=442478 written=442350 |
> | 4      | shared read=442478 dirtied=442478 written=442318 |
> | 5      | shared read=442478 dirtied=442478 written=442286 |
> | 6      | shared read=442478 dirtied=442478 written=442254 |
>
>
> SQL Query Execution Time (ms) :
> | Worker | SQL (Master) | SQL (Patch)  |
> |--------|--------------|--------------|
> | 0      | "10,418.606" | "10,377.377" |
> | 1      | "05,427.460"  | "05,402.727" |
> | 2      | "03,662.998"  | "03,650.277" |
> | 3      | "02,718.837"  | "02,692.871" |
> | 4      | "02,759.802"  | "02,693.370" |
> | 5      | "02,761.834"  | "02,682.590" |
> | 6      | "02,711.434"  | "02,726.332" |
>
> The SQL query execution time definitely benefitted from previous run of query planner,
> so the results are faster. But again, both Master and Patched have almost the same results.
> Nonetheless, the execution time is almost consistent when
> max_parallel_workers_per_gather is 2 (default) and above.
>
> I am definitely missing something. Perhaps I think I could not understand why there's no
> I/O difference between the Master and Patched (V2). Or has it been already improved
> even without this patch?
>

I don't think it is strange that you are not seeing much difference
because as per the initial email by Thomas this patch is not supposed
to give benefits on all systems.  I think we wanted to check that the
patch should not regress performance in cases where it doesn't give
benefits.  I think it might be okay to run with a higher number of
workers than you have CPUs in the system as we wanted to check if such
cases regress as shown by Soumyadeep above [1].  Can you once try with
8 and or 10 workers as well?

[1] - https://www.postgresql.org/message-id/CADwEdoqirzK3H8bB%3DxyJ192EZCNwGfcCa_WJ5GHVM7Sv8oenuA%40mail.gmail.com

--
With Regards,
Amit Kapila.
EnterpriseDB: http://www.enterprisedb.com
On Tuesday, July 21, 2020 12:18 PM, Amit Kapila wrote:
> On Tue, Jul 21, 2020 at 8:06 AM k.jamison@fujitsu.com <k.jamison@fujitsu.com>
> wrote:
> >
> > Thank you for the advice. I repeated the test as per your advice and
> > average of 3 runs per worker/s planned.
> > It still shows the following similar performance results between Master and
> Patch V2.
> > I wonder why there's no difference though.
> >
> > The test on my machine is roughly like this:
> >
> > createdb test
> > psql -d test
> > create table t_heap as select generate_series(1, 100000000) i; \q
> >
> > pg_ctl restart
> > psql -d test
> > SET track_io_timing = on;
> > SET max_parallel_workers_per_gather = 0; SHOW
> > max_parallel_workers_per_gather; EXPLAIN (ANALYZE, BUFFERS) SELECT
> > count(*) from t_heap; \timing SELECT count(*) from t_heap;
> >
> > drop table t_heap;
> > \q
> > dropdb test
> > pg_ctl restart
> >
> > Below are the results. Again, almost no discernible difference between the
> master and patch.
> > Also, the results when max_parallel_workers_per_gather is more than 4
> > could be inaccurate due to my machine's limitation of only having v4
> > CPUs. Even so, query planner capped it at
> > 6 workers.
> >
> > Query Planner I/O Timings (track_io_timing = on) in ms :
> > | Worker | I/O READ (Master) | I/O READ (Patch) | I/O WRITE (Master) |
> > | I/O WRITE (Patch) |
> >
> |--------|-------------------|------------------|--------------------|-------------
> ------|
> > | 0      | "1,130.777"       | "1,250.821"      | "01,698.051"       |
> "01,733.439"      |
> > | 1      | "1,603.016"       | "1,660.767"      | "02,312.248"       |
> "02,291.661"      |
> > | 2      | "2,036.269"       | "2,107.066"      | "02,698.216"       |
> "02,796.893"      |
> > | 3      | "2,298.811"       | "2,307.254"      | "05,695.991"       |
> "05,894.183"      |
> > | 4      | "2,098.642"       | "2,135.960"      | "23,837.088"       |
> "26,537.158"      |
> > | 5      | "1,956.536"       | "1,997.464"      | "45,891.851"       |
> "48,049.338"      |
> > | 6      | "2,201.816"       | "2,219.001"      | "61,937.828"       |
> "67,809.486"      |
> >
> > Query Planner Execution Time (ms):
> > | Worker | QueryPlanner (Master) | QueryPlanner (Patch) |
> > |--------|-----------------------|----------------------|
> > | 0.000  | "40,454.252"          | "40,521.578"         |
> > | 1.000  | "21,332.067"          | "21,205.068"         |
> > | 2.000  | "14,266.756"          | "14,385.539"         |
> > | 3.000  | "11,597.936"          | "11,722.055"         |
> > | 4.000  | "12,937.468"          | "13,439.247"         |
> > | 5.000  | "14,383.083"          | "14,782.866"         |
> > | 6.000  | "14,671.336"          | "15,507.581"         |
> >
> > Based from the results above, the I/O latency increases as number of
> > workers also increase. Despite that, the query planner execution time
> > is almost closely same when 2 or more workers are used (14~11s). Same
> results between Master and Patch V2.
> >
> > As for buffers, same results are shown per worker (both Master and Patch).
> > | Worker | Buffers                                          |
> > |--------|--------------------------------------------------|
> > | 0      | shared read=442478 dirtied=442478 written=442446 |
> > | 1      | shared read=442478 dirtied=442478 written=442414 |
> > | 2      | shared read=442478 dirtied=442478 written=442382 |
> > | 3      | shared read=442478 dirtied=442478 written=442350 |
> > | 4      | shared read=442478 dirtied=442478 written=442318 |
> > | 5      | shared read=442478 dirtied=442478 written=442286 |
> > | 6      | shared read=442478 dirtied=442478 written=442254 |
> >
> >
> > SQL Query Execution Time (ms) :
> > | Worker | SQL (Master) | SQL (Patch)  |
> > |--------|--------------|--------------|
> > | 0      | "10,418.606" | "10,377.377" |
> > | 1      | "05,427.460"  | "05,402.727" |
> > | 2      | "03,662.998"  | "03,650.277" |
> > | 3      | "02,718.837"  | "02,692.871" |
> > | 4      | "02,759.802"  | "02,693.370" |
> > | 5      | "02,761.834"  | "02,682.590" |
> > | 6      | "02,711.434"  | "02,726.332" |
> >
> > The SQL query execution time definitely benefitted from previous run
> > of query planner, so the results are faster. But again, both Master and Patched
> have almost the same results.
> > Nonetheless, the execution time is almost consistent when
> > max_parallel_workers_per_gather is 2 (default) and above.
> >
> > I am definitely missing something. Perhaps I think I could not
> > understand why there's no I/O difference between the Master and
> > Patched (V2). Or has it been already improved even without this patch?
> >
>
> I don't think it is strange that you are not seeing much difference because as per
> the initial email by Thomas this patch is not supposed to give benefits on all
> systems.  I think we wanted to check that the patch should not regress
> performance in cases where it doesn't give benefits.  I think it might be okay to
> run with a higher number of workers than you have CPUs in the system as we
> wanted to check if such cases regress as shown by Soumyadeep above [1].  Can
> you once try with
> 8 and or 10 workers as well?
>
> [1] -
> https://www.postgresql.org/message-id/CADwEdoqirzK3H8bB%3DxyJ192EZCN
> wGfcCa_WJ5GHVM7Sv8oenuA%40mail.gmail.com

You are right. Kindly excuse me on that part, which only means it may or may not have any
benefits on the filesystem I am using. But for other fs, as we can see from David's benchmarks
significant results/benefits.

Following your advice on regression test case, I increased the number of workers,
but the query planner still capped the workers at 6, so the results from 6 workers onwards
are almost the same.
I don't see significant difference between master and patched on my machine
as per my test results below. (Just for reconfirmation)

Query Planner I/O Timings (ms):
| Worker | I/O READ (Master) | I/O READ (Patch) | I/O WRITE (Master) | I/O WRITE (Patch) |
|--------|-------------------|------------------|--------------------|-------------------|
| 0      | "1,130.78"        | "1,250.82"       | "1,698.05"         | "1,733.44"        |
| 1      | "1,603.02"        | "1,660.77"       | "2,312.25"         | "2,291.66"        |
| 2      | "2,036.27"        | "2,107.07"       | "2,698.22"         | "2,796.89"        |
| 3      | "2,298.81"        | "2,307.25"       | "5,695.99"         | "5,894.18"        |
| 4      | "2,098.64"        | "2,135.96"       | "23,837.09"        | "26,537.16"       |
| 5      | "1,956.54"        | "1,997.46"       | "45,891.85"        | "48,049.34"       |
| 6      | "2,201.82"        | "2,219.00"       | "61,937.83"        | "67,809.49"       |
| 8      | "2,117.80"        | "2,169.67"       | "60,671.22"        | "68,676.36"       |
| 16     | "2,052.73"        | "2,134.86"       | "60,635.17"        | "66,462.82"       |
| 32     | "2,036.00"        | "2,200.98"       | "60,833.92"        | "67,702.49"       |

Query Planner Execution Time (ms):
| Worker | QueryPlanner (Master) | QueryPlanner (Patch) |
|--------|-----------------------|----------------------|
| 0      | "40,454.25"           | "40,521.58"          |
| 1      | "21,332.07"           | "21,205.07"          |
| 2      | "14,266.76"           | "14,385.54"          |
| 3      | "11,597.94"           | "11,722.06"          |
| 4      | "12,937.47"           | "13,439.25"          |
| 5      | "14,383.08"           | "14,782.87"          |
| 6      | "14,671.34"           | "15,507.58"          |
| 8      | "14,679.50"           | "15,615.69"          |
| 16     | "14,474.78"           | "15,274.61"          |
| 32     | "14,462.11"           | "15,470.68"          |

| Worker | Buffers                                          |
|--------|--------------------------------------------------|
| 0      | shared read=442478 dirtied=442478 written=442446 |
| 1      | shared read=442478 dirtied=442478 written=442414 |
| 2      | shared read=442478 dirtied=442478 written=442382 |
| 3      | shared read=442478 dirtied=442478 written=442350 |
| 4      | shared read=442478 dirtied=442478 written=442318 |
| 5      | shared read=442478 dirtied=442478 written=442286 |
| 6      | shared read=442478 dirtied=442478 written=442254 |
| 8      | shared read=442478 dirtied=442478 written=442254 |
| 16     | shared read=442478 dirtied=442478 written=442254 |
| 32     | shared read=442478 dirtied=442478 written=442254 |

I also re-ran the query and measured the execution time (ms) with \timing
| Worker | SQL (Master) | SQL (Patch) |
|--------|--------------|-------------|
| 0      | 15476.458    | 15278.772   |
| 1      | 8292.702     | 8426.435    |
| 2      | 6256.673     | 6232.456    |
| 3      | 6357.217     | 6340.013    |
| 4      | 7591.311     | 7913.881    |
| 5      | 8165.315     | 8070.592    |
| 6      | 8065.578     | 8200.076    |
| 8      | 7988.302     | 8609.138    |
| 16     | 8025.170     | 8469.895    |
| 32     | 8019.393     | 8645.150    |

Again tested on:
XFS filesystem, HDD virtual machine, 8GB RAM
RHEL4, 64-bit,
4 CPUs, Intel Core Processor (Haswell, IBRS)
PostgreSQL 14devel on x86_64-pc-linux-gnu

So I guess it does not affect the filesystem that I am using. So I think it's OK.

Kind regards,
Kirk Jamison
On Tue, Jul 21, 2020 at 3:08 PM k.jamison@fujitsu.com
<k.jamison@fujitsu.com> wrote:
>
> On Tuesday, July 21, 2020 12:18 PM, Amit Kapila wrote:
> > On Tue, Jul 21, 2020 at 8:06 AM k.jamison@fujitsu.com <k.jamison@fujitsu.com>
> > wrote:
> > >
> > > I am definitely missing something. Perhaps I think I could not
> > > understand why there's no I/O difference between the Master and
> > > Patched (V2). Or has it been already improved even without this patch?
> > >
> >
> > I don't think it is strange that you are not seeing much difference because as per
> > the initial email by Thomas this patch is not supposed to give benefits on all
> > systems.  I think we wanted to check that the patch should not regress
> > performance in cases where it doesn't give benefits.  I think it might be okay to
> > run with a higher number of workers than you have CPUs in the system as we
> > wanted to check if such cases regress as shown by Soumyadeep above [1].  Can
> > you once try with
> > 8 and or 10 workers as well?
> >
>
> You are right. Kindly excuse me on that part, which only means it may or may not have any
> benefits on the filesystem I am using. But for other fs, as we can see from David's benchmarks
> significant results/benefits.
>
> Following your advice on regression test case, I increased the number of workers,
> but the query planner still capped the workers at 6, so the results from 6 workers onwards
> are almost the same.
>

I am slightly confused if the number of workers are capped at 6, then
what exactly the data at 32 worker count means?  If you want query
planner to choose more number of workers, then I think either you need
to increase the data or use Alter Table <tbl_name> Set
(parallel_workers = <num_workers_you_want>);

> I don't see significant difference between master and patched on my machine
> as per my test results below. (Just for reconfirmation)
>

I see the difference of about 7-8% at higher (32) client-count.  Am, I
missing something?

--
With Regards,
Amit Kapila.
EnterpriseDB: http://www.enterprisedb.com
Hi Kirk,

Thank you for doing some testing on this. It's very useful to get some
samples from other hardware / filesystem / os combinations.

On Tue, 21 Jul 2020 at 21:38, k.jamison@fujitsu.com
<k.jamison@fujitsu.com> wrote:
> Query Planner I/O Timings (ms):
> | Worker | I/O READ (Master) | I/O READ (Patch) | I/O WRITE (Master) | I/O WRITE (Patch) |
> |--------|-------------------|------------------|--------------------|-------------------|
> | 0      | "1,130.78"        | "1,250.82"       | "1,698.05"         | "1,733.44"        |


> | Worker | Buffers                                          |
> |--------|--------------------------------------------------|
> | 0      | shared read=442478 dirtied=442478 written=442446 |

I'm thinking the scale of this test might be a bit too small for the
machine you're using to test.  When you see "shared read" in the
EXPLAIN (ANALYZE, BUFFERS) output, it does not necessarily mean that
the page had to be read from disk.  We use buffered I/O, so the page
could just have been fetched from the kernel's cache.

If we do some maths here on the timing. It took 1130.78 milliseconds
to read 442478 pages, which, assuming the standard page size of 8192
bytes, that's 3457 MB in 1130.78 milliseconds, or 3057 MB/sec.  Is
that a realistic throughput for this machine in terms of I/O? Or do
you think that some of these pages might be coming from the Kernel's
cache?

I understand that Amit wrote:

On Fri, 17 Jul 2020 at 21:18, Amit Kapila <amit.kapila16@gmail.com> wrote:
> I think recreating the database and restarting the server after each
> run might help in getting consistent results.  Also, you might want to
> take median of three runs.

Please also remember, if you're recreating the database after having
restarted the machine that creating the table will likely end up
caching some of the pages either in shared buffers or the Kernel's
cache. It would be better to leave the database intact and just reboot
the machine.  I didn't really like that option with my tests so I just
increased the size of the table beyond any size that my machines could
have cached.  With the 16GB RAM Windows laptop, I used a 100GB table
and with the 64GB workstation, I used an 800GB table.  I think my test
using SELECT * FROM t WHERE a < 0; with a table that has a padding
column is likely going to be a more accurate test. Providing there is
no rows with a < 0 in the table then the executor will spend almost
all of the time in nodeSeqscan.c trying to find a row with a < 0.
There's no additional overhead of aggregation doing the count(*).
Having the additional padding column means that we read more data per
evaluation of the a < 0 expression.  Also, having a single column
table is not that realistic.

I'm pretty keen to see this machine running something closer to the
test I mentioned in [1] but the benchmark query I mentioned in [2]
with the "t" table being at least twice the size of RAM in the
machine. Larger would be better though. With such a scaled test, I
don't think there's much need to reboot the machine in between. Just
run a single query first to warm up the cache before timing anything.
Having the table a few times larger than RAM will mean that we can be
certain that the disk was actually used during the test. The more data
we can be certain came from disk the more we can trust that the
results are meaningful.

Thanks again for testing this.

David

[1] https://www.postgresql.org/message-id/CAApHDvrfJfYH51_WY-iQqPw8yGR4fDoTxAQKqn+Sa7NTKEVWtg@mail.gmail.com
[2] https://www.postgresql.org/message-id/CAApHDvo+LEGKMcavOiPYK8NEbgP-LrXns2TJ1n_XNRJVE9X+Cw@mail.gmail.com
On Wed, Jul 22, 2020 at 5:25 AM David Rowley <dgrowleyml@gmail.com> wrote:
>
> I understand that Amit wrote:
>
> On Fri, 17 Jul 2020 at 21:18, Amit Kapila <amit.kapila16@gmail.com> wrote:
> > I think recreating the database and restarting the server after each
> > run might help in getting consistent results.  Also, you might want to
> > take median of three runs.
>
> Please also remember, if you're recreating the database after having
> restarted the machine that creating the table will likely end up
> caching some of the pages either in shared buffers or the Kernel's
> cache.
>

Yeah, that is true but every time before the test the same amount of
data should be present in shared buffers (or OS cache) if any which
will help in getting consistent results.  However, it is fine to
reboot the machine as well if that is a convenient way.

--
With Regards,
Amit Kapila.
EnterpriseDB: http://www.enterprisedb.com
On Wed, Jul 22, 2020 at 3:57 PM Amit Kapila <amit.kapila16@gmail.com> wrote:
> Yeah, that is true but every time before the test the same amount of
> data should be present in shared buffers (or OS cache) if any which
> will help in getting consistent results.  However, it is fine to
> reboot the machine as well if that is a convenient way.

We really should have an extension (pg_prewarm?) that knows how to
kick stuff out PostgreSQL's shared buffers and the page cache
(POSIX_FADV_DONTNEED).
On Tuesday, July 21, 2020 7:33 PM, Amit Kapila wrote:
> On Tue, Jul 21, 2020 at 3:08 PM k.jamison@fujitsu.com <k.jamison@fujitsu.com>
> wrote:
> >
> > On Tuesday, July 21, 2020 12:18 PM, Amit Kapila wrote:
> > > On Tue, Jul 21, 2020 at 8:06 AM k.jamison@fujitsu.com
> > > <k.jamison@fujitsu.com>
> > > wrote:
> > > >
> > > > I am definitely missing something. Perhaps I think I could not
> > > > understand why there's no I/O difference between the Master and
> > > > Patched (V2). Or has it been already improved even without this patch?
> > > >
> > >
> > > I don't think it is strange that you are not seeing much difference
> > > because as per the initial email by Thomas this patch is not
> > > supposed to give benefits on all systems.  I think we wanted to
> > > check that the patch should not regress performance in cases where
> > > it doesn't give benefits.  I think it might be okay to run with a
> > > higher number of workers than you have CPUs in the system as we
> > > wanted to check if such cases regress as shown by Soumyadeep above
> > > [1].  Can you once try with
> > > 8 and or 10 workers as well?
> > >
> >
> > You are right. Kindly excuse me on that part, which only means it may
> > or may not have any benefits on the filesystem I am using. But for
> > other fs, as we can see from David's benchmarks significant results/benefits.
> >
> > Following your advice on regression test case, I increased the number
> > of workers, but the query planner still capped the workers at 6, so
> > the results from 6 workers onwards are almost the same.
> >
>
> I am slightly confused if the number of workers are capped at 6, then what exactly
> the data at 32 worker count means?  If you want query planner to choose more
> number of workers, then I think either you need to increase the data or use Alter
> Table <tbl_name> Set (parallel_workers = <num_workers_you_want>);

Oops I'm sorry, the "workers" labelled in those tables actually mean max_parallel_workers_per_gather
and not parallel_workers. In the query planner, I thought the _per_gather corresponds or controls
the workers planned/launched values, and those are the numbers that I used in the tables.

I used the default max_parallel_workers & max_worker_proceses which is 8 by default in postgresql.conf.
IOW, I ran all those tests with maximum of 8 processes set. But my query planner capped both the
Workers Planned and Launched at 6 for some reason when increasing the value for
max_parallel_workers_per_gather.

However, when I used the ALTER TABLE SET (parallel_workers = N) based from your suggestion,
the query planner acquired that set value only for "Workers Planned", but not for "Workers Launched".
The behavior of query planner is also different when I also set the value of max_worker_processes
and max_parallel_workers to parallel_workers + 1.

For example (ran on Master),
1. Set same value as parallel_workers, but "Workers Launched" and "Workers Planned" do not match.
max_worker_processes = 8
max_parallel_workers = 8
ALTER TABLE t_heap SET (parallel_workers = 8);
ALTER TABLE
SET max_parallel_workers_per_gather = 8;
SET
test=# EXPLAIN (ANALYZE, BUFFERS) SELECT count(*) from t_heap;
                                                                    QUERY PLAN

--------------------------------------------------------------------------------------------------------------------------------------------------
 Finalize Aggregate  (cost=619778.66..619778.67 rows=1 width=8) (actual time=16316.295..16316.295 rows=1 loops=1)
   Buffers: shared read=442478 dirtied=442478 written=442222
   ->  Gather  (cost=619777.83..619778.64 rows=8 width=8) (actual time=16315.528..16316.668 rows=8 loops=1)
         Workers Planned: 8
         Workers Launched: 7
         Buffers: shared read=442478 dirtied=442478 written=442222
         ->  Partial Aggregate  (cost=618777.83..618777.84 rows=1 width=8) (actual time=16305.092..16305.092 rows=1
loops=8)
               Buffers: shared read=442478 dirtied=442478 written=442222
               ->  Parallel Seq Scan on t_heap  (cost=0.00..583517.86 rows=14103986 width=0) (actual
time=0.725..14290.117rows=12500000 loops=8)

                     Buffers: shared read=442478 dirtied=442478 written=442222
 Planning Time: 5.327 ms
   Buffers: shared hit=17 read=10
 Execution Time: 16316.915 ms
(13 rows)

2. Match the workers launched and workers planned values (parallel_workers + 1)
max_worker_processes = 9
max_parallel_workers = 9

ALTER TABLE t_heap SET (parallel_workers = 8);
ALTER TABLE;
SET max_parallel_workers_per_gather = 8;
SET

test=# EXPLAIN (ANALYZE, BUFFERS) SELECT count(*) from t_heap;
                                                                    QUERY PLAN

--------------------------------------------------------------------------------------------------------------------------------------------------
 Finalize Aggregate  (cost=619778.66..619778.67 rows=1 width=8) (actual time=16783.944..16783.944 rows=1 loops=1)
   Buffers: shared read=442478 dirtied=442478 written=442190
   ->  Gather  (cost=619777.83..619778.64 rows=8 width=8) (actual time=16783.796..16785.474 rows=9 loops=1)
         Workers Planned: 8
         Workers Launched: 8
         Buffers: shared read=442478 dirtied=442478 written=442190
         ->  Partial Aggregate  (cost=618777.83..618777.84 rows=1 width=8) (actual time=16770.218..16770.218 rows=1
loops=9)
               Buffers: shared read=442478 dirtied=442478 written=442190
               ->  Parallel Seq Scan on t_heap  (cost=0.00..583517.86 rows=14103986 width=0) (actual
time=6.004..14967.329rows=11111111 loops=9)

                     Buffers: shared read=442478 dirtied=442478 written=442190
 Planning Time: 4.755 ms
   Buffers: shared hit=17 read=10
 Execution Time: 16785.719 ms
(13 rows)


Kind regards,
Kirk Jamison
On Wed, 22 Jul 2020 at 16:40, k.jamison@fujitsu.com
<k.jamison@fujitsu.com> wrote:
> I used the default max_parallel_workers & max_worker_proceses which is 8 by default in postgresql.conf.
> IOW, I ran all those tests with maximum of 8 processes set. But my query planner capped both the
> Workers Planned and Launched at 6 for some reason when increasing the value for
> max_parallel_workers_per_gather.

max_parallel_workers_per_gather just imposes a limit on the planner as
to the maximum number of parallel workers it may choose for a given
parallel portion of a plan. The actual number of workers the planner
will decide is best to use is based on the size of the relation. More
pages = more workers. It sounds like in this case the planner didn't
think it was worth using more than 6 workers.

The parallel_workers reloption, when not set to -1 overwrites the
planner's decision on how many workers to use. It'll just always try
to use "parallel_workers".

> However, when I used the ALTER TABLE SET (parallel_workers = N) based from your suggestion,
> the query planner acquired that set value only for "Workers Planned", but not for "Workers Launched".
> The behavior of query planner is also different when I also set the value of max_worker_processes
> and max_parallel_workers to parallel_workers + 1.

When it comes to execution, the executor is limited to how many
parallel worker processes are available to execute the plan. If all
workers happen to be busy with other tasks then it may find itself
having to process the entire query in itself without any help from
workers.  Or there may be workers available, just not as many as the
planner picked to execute the query.

The number of available workers is configured with the
"max_parallel_workers". That's set in postgresql.conf.   PostgreSQL
won't complain if you try to set a relation's parallel_workers
reloption to a number higher than the "max_parallel_workers" GUC.
"max_parallel_workers" is further limited by "max_worker_processes".
Likely you'll want to set both those to at least 32 for this test,
then just adjust the relation's parallel_workers setting for each
test.

David
On Wednesday, July 22, 2020 2:21 PM (GMT+9), David Rowley wrote:

> On Wed, 22 Jul 2020 at 16:40, k.jamison@fujitsu.com <k.jamison@fujitsu.com>
> wrote:
> > I used the default max_parallel_workers & max_worker_proceses which is 8 by
> default in postgresql.conf.
> > IOW, I ran all those tests with maximum of 8 processes set. But my
> > query planner capped both the Workers Planned and Launched at 6 for
> > some reason when increasing the value for max_parallel_workers_per_gather.
>
> max_parallel_workers_per_gather just imposes a limit on the planner as to the
> maximum number of parallel workers it may choose for a given parallel portion of
> a plan. The actual number of workers the planner will decide is best to use is
> based on the size of the relation. More pages = more workers. It sounds like in
> this case the planner didn't think it was worth using more than 6 workers.
>
> The parallel_workers reloption, when not set to -1 overwrites the planner's
> decision on how many workers to use. It'll just always try to use
> "parallel_workers".
>
> > However, when I used the ALTER TABLE SET (parallel_workers = N) based
> > from your suggestion, the query planner acquired that set value only for
> "Workers Planned", but not for "Workers Launched".
> > The behavior of query planner is also different when I also set the
> > value of max_worker_processes and max_parallel_workers to parallel_workers
> + 1.
>
> When it comes to execution, the executor is limited to how many parallel worker
> processes are available to execute the plan. If all workers happen to be busy with
> other tasks then it may find itself having to process the entire query in itself
> without any help from workers.  Or there may be workers available, just not as
> many as the planner picked to execute the query.

Even though I read the documentation [1][2] on parallel query, I might not have
understood it clearly yet. So thank you very much for explaining simpler how the
relation size, GUCs, and reloption affect the query planner's behavior
So in this test case, I shouldn't force the workers to have same values for workers
planned and workers launched, is it correct? To just let the optimizer do its own decision.

> The number of available workers is configured with the
> "max_parallel_workers". That's set in postgresql.conf.   PostgreSQL
> won't complain if you try to set a relation's parallel_workers reloption to a number
> higher than the "max_parallel_workers" GUC.
> "max_parallel_workers" is further limited by "max_worker_processes".
> Likely you'll want to set both those to at least 32 for this test, then just adjust the
> relation's parallel_workers setting for each test.
>
Thank you for the advice. For the same test case [3], I will use the following configuration:
shared_buffers = 32MB
max_parallel_workers =32
max_worker_processes = 32

Maybe the relation size is also small as you mentioned, that the query optimizer decided
to only use 6 workers in my previous test. So let me see first if the results would vary
again with the above configuration and testing different values for parallel_workers.

Kind regards,
Kirk Jamison

[1] https://www.postgresql.org/docs/13/how-parallel-query-works.html
[2] https://www.postgresql.org/docs/current/runtime-config-resource.html
[3] https://www.postgresql.org/message-id/CADwEdoqirzK3H8bB=xyJ192EZCNwGfcCa_WJ5GHVM7Sv8oenuA@mail.gmail.com
On Wed, 22 Jul 2020 at 18:17, k.jamison@fujitsu.com
<k.jamison@fujitsu.com> wrote:
> Even though I read the documentation [1][2] on parallel query, I might not have
> understood it clearly yet. So thank you very much for explaining simpler how the
> relation size, GUCs, and reloption affect the query planner's behavior
> So in this test case, I shouldn't force the workers to have same values for workers
> planned and workers launched, is it correct? To just let the optimizer do its own decision.

What you want to do is force the planner's hand with each test as to
how many parallel workers it uses by setting the reloption
parallel_workers to the number of workers you want to test.  Just make
sure the executor has enough workers to launch by setting
max_parallel_workers and max_worker_processes to something high enough
to conduct the tests without the executor failing to launch any
workers.

> Maybe the relation size is also small as you mentioned, that the query optimizer decided
> to only use 6 workers in my previous test. So let me see first if the results would vary
> again with the above configuration and testing different values for parallel_workers.

The parallel_worker reloption will overwrite the planner's choice of
how many parallel workers to use. Just make sure the executor has
enough to use. You'll be able to determine that from the Workers
Planned matching Workers Launched.

David
Hi David,

Apologies for the delay, I had missed these emails.

On Tue, Jul 14, 2020 at 8:52 PM David Rowley <dgrowleyml@gmail.com> wrote:

> It would be good to know if the
> regression is repeatable or if it was affected by some other process.


These are the latest results on the same setup as [1].
(TL;DR: the FreeBSD VM with Google Persistent Disk is too unstable -
there is too much variability in performance to conclude that there is a
regression)


With 100000000 rows:

master (606c384598):

max_parallel_workers_per_gather    Time(seconds)
                              0           20.09s
                              1            9.77s
                              2            9.92s
                              6            9.55s


v2 patch (applied on 606c384598):

max_parallel_workers_per_gather    Time(seconds)
                              0           18.34s
                              1            9.68s
                              2            9.15s
                              6            9.11s


The above results were averaged across 3 runs with little or no
deviation between runs. The absolute values are very different from the
results reported in [1].

So, I tried to repro the regression as I had reported in [1] with
150000000 rows:

master (449e14a561)

max_parallel_workers_per_gather    Time(seconds)
                              0         42s, 42s
                              1       395s, 393s
                              2       404s, 403s
                              6       403s, 403s

Thomas' patch (applied on 449e14a561):

max_parallel_workers_per_gather    Time(seconds)
                              0          43s,43s
                              1        203s, 42s
                              2         42s, 42s
                              6         44s, 43s


v2 patch (applied on 449e14a561):

max_parallel_workers_per_gather    Time(seconds)
                              0       274s, 403s
                              1       419s, 419s
                              2       448s, 448s
                              6       137s, 419s


As you can see, I got wildly different results with 150000000 rows (even
between runs of the same experiment)
I don't think that the environment is stable enough to tell if there is
any regression.

What I can say is that there are no processes apart from Postgres
running on the system. Also, the environment is pretty constrained -
just 1G of free hard drive space before the start of every run, when I
have 150000000 rows, apart from the mere 32M of shared buffers and only
4G of RAM.

I don't know much about Google Persistent Disk to be very honest.
Basically, I just provisioned one when I provisioned a GCP VM for testing on
FreeBSD, as Thomas had mentioned that FreeBSD UFS is a bad case for
parallel seq scan.

> It would be good to see EXPLAIN (ANALYZE, BUFFERS) with SET
> track_io_timing = on; for each value of max_parallel_workers.

As for running EXPLAIN ANALYZE, running that on this system incurs a
non-trivial amount of overhead. The overhead is simply staggering. This
is the result of pg_test_timing in the FreeBSD GCP VM:

$ /usr/local/pgsql/bin/pg_test_timing -d 50
Testing timing overhead for 50 seconds.
Per loop time including overhead: 4329.80 ns
Histogram of timing durations:
  < us   % of total      count
     1      0.00000          0
     2      0.00000          0
     4      3.08896     356710
     8     95.97096   11082616
    16      0.37748      43591
    32      0.55502      64093
    64      0.00638        737
   128      0.00118        136
   256      0.00002          2

As a point of comparison, on my local Ubuntu workstation:

$ /usr/local/pgsql/bin/pg_test_timing -d 50
Testing timing overhead for 50 seconds.
Per loop time including overhead: 22.65 ns
Histogram of timing durations:
  < us   % of total      count
     1     97.73691 2157634382
     2      2.26246   49945854
     4      0.00039       8711
     8      0.00016       3492
    16      0.00008       1689
    32      0.00000         63
    64      0.00000          1

This is why I opted to simply use \timing on.

Regards,

Soumyadeep (VMware)

[1] https://www.postgresql.org/message-id/CADwEdoqirzK3H8bB=xyJ192EZCNwGfcCa_WJ5GHVM7Sv8oenuA@mail.gmail.com
On Tue, Jul 21, 2020 at 9:33 PM Thomas Munro <thomas.munro@gmail.com> wrote:
>
> On Wed, Jul 22, 2020 at 3:57 PM Amit Kapila <amit.kapila16@gmail.com> wrote:
> > Yeah, that is true but every time before the test the same amount of
> > data should be present in shared buffers (or OS cache) if any which
> > will help in getting consistent results.  However, it is fine to
> > reboot the machine as well if that is a convenient way.
>
> We really should have an extension (pg_prewarm?) that knows how to
> kick stuff out PostgreSQL's shared buffers and the page cache
> (POSIX_FADV_DONTNEED).
>
>
+1. Clearing the OS page cache on FreeBSD is non-trivial during testing.
You can't do this on FreeBSD:
sync; echo 3 > /proc/sys/vm/drop_caches

Also, it would be nice to evict only those pages from the OS page cache
that are Postgres pages instead of having to drop everything.

Regards,
Soumyadeep (VMware)
On Wed, Jul 22, 2020 at 10:03 AM Thomas Munro <thomas.munro@gmail.com> wrote:
>
> On Wed, Jul 22, 2020 at 3:57 PM Amit Kapila <amit.kapila16@gmail.com> wrote:
> > Yeah, that is true but every time before the test the same amount of
> > data should be present in shared buffers (or OS cache) if any which
> > will help in getting consistent results.  However, it is fine to
> > reboot the machine as well if that is a convenient way.
>
> We really should have an extension (pg_prewarm?) that knows how to
> kick stuff out PostgreSQL's shared buffers and the page cache
> (POSIX_FADV_DONTNEED).
>

+1.  Such an extension would be quite helpful for performance benchmarks.

--
With Regards,
Amit Kapila.
EnterpriseDB: http://www.enterprisedb.com
Hi Soumyadeep,

Thanks for re-running the tests.

On Thu, 23 Jul 2020 at 06:01, Soumyadeep Chakraborty
<soumyadeep2007@gmail.com> wrote:
> On Tue, Jul 14, 2020 at 8:52 PM David Rowley <dgrowleyml@gmail.com> wrote:
> > It would be good to see EXPLAIN (ANALYZE, BUFFERS) with SET
> > track_io_timing = on; for each value of max_parallel_workers.
>
> As for running EXPLAIN ANALYZE, running that on this system incurs a
> non-trivial amount of overhead. The overhead is simply staggering.

I didn't really intend for that to be used to get an accurate overall
timing for the query. It was more to get an indication of the reads
are actually hitting the disk or not.

I mentioned to Kirk in [1] that his read speed might be a bit higher
than what his disk can actually cope with.  I'm not too sure on the
HDD he mentions, but if it's a single HDD then reading at an average
speed of 3457 MB/sec seems quite a bit too fast. It seems more likely,
in his cases, that those reads are mostly coming from the kernel's
cache.

David

[1] https://www.postgresql.org/message-id/CAApHDvoDzAzXEp+Ay2CfT3U=ZcD5NLD7K9_Y936bnHjzs5jkHw@mail.gmail.com
On Wed, 15 Jul 2020 at 12:24, David Rowley <dgrowleyml@gmail.com> wrote:
> If we've not seen any performance regressions within 1 week, then I
> propose that we (pending final review) push this to allow wider
> testing. It seems we're early enough in the PG14 cycle that there's a
> large window of time for us to do something about any reported
> performance regressions that come in.

I did that final review which ended up in quite a few cosmetic changes.

Functionality-wise, it's basically that of the v2 patch with the
PARALLEL_SEQSCAN_MAX_CHUNK_SIZE set to 8192.

I mentioned that we might want to revisit giving users some influence
on the chunk size, but we'll only do so once we see some conclusive
evidence that it's worthwhile.

David