Обсуждение: Should we update the random_page_cost default value?
Hi,

I wonder if it's time to consider updating the random_page_cost default
value. There are multiple reasons to maybe do that.

The GUC (and the 4.0 default) was introduced in ~2000 [1], so ~25 years
ago. During that time the world went from rotational drives through
multiple generations of flash / network-attached storage. I find it hard
to believe those changes wouldn't affect random_page_cost.

And indeed, it's common to advice to reduce the GUC closer to 1.0 on
SSDs. I myself recommended doing that in the past, but over time I got
somewhat skeptical about it. The advice is based on the "obvious" wisdom
that SSDs are much better in handling random I/O than rotational disks.

But this has two flaws. First, it assumes the current 4.0 default makes
sense - maybe it doesn't and then it's useless as a "starting point".
Second, it's not obvious how much better SSDs are without concurrent IOs
(which is needed to fully leverage the SSDs). Which we don't do for
index scans (yet), and even if we did, the cost model has no concept for
such concurrency.

Recently, I've been doing some experiments evaluating how often we pick
an optimal scan for simple select queries, assuming accurate estimates.
Turns out we pick the wrong plan fairly often, even with almost perfect
estimates. I somewhat expected that, with the default random_page_cost
value. What did surprise me was that to improve the plans, I had to
*increase* the value, even on really new/fast SSDs ...

I started looking at how we calculated the 4.0 default back in 2000.
Unfortunately, there's a lot of info, as Tom pointed out in 2024 [2].
But he outlined how the experiment worked:

- generate large table (much bigger than RAM)
- measure runtime of seq scan
- measure runtime of full-table index scan
- calculate how much more expensive a random page access is

So I decided to try doing this on a couple different devices, and see
what random_page_cost values that gives me. Attached is a script doing
such benchmark:

(1) initializes a new cluster, with a couple parameters adjusted

(2) creates a random table (with uniform distribution)

(3) runs a sequential scan

    SELECT * FROM (SELECT * FROM test_table) OFFSET $nrows;

(4) runs an index scan

    SELECT * FROM (SELECT * FROM test_table ORDER BY id) OFFSET $nrows;

The script does a couple things to force the query plan, and it reports
timings of the two queries at the end.

I've been running this on machines with 64GB of RAM, so I chose the
table to have 500M rows. With fillfactor=20 that means a ~182GB table
(23809524 pages).

Lets say that

   T(seq) = timing of the seqscan query
   T(idx) = timing of the index scan
   IOS(seq) = number of sequential page reads
   IOS(idx) = number of random page reads
   P = number of pages
   N = number of rows

then time to read a sequential page (because IOS(seq) == P)

   PT(seq) = T(seq) / IOS(seq) = T(seq) / P

and time to read a random page (assuming the table is perfectly random,
with no cache hits):

   PT(idx) = T(idx) / IOS(idx) = T(idx) / N

which gives us the "idea" random page cost (as a value relative to
reading a page sequentially)

   random_page_cost = PT(idx) / PT(seq)

                        T(idx) * P
                    = --------------
                        T(seq) * N

The "no cache hits" is not quite correct, with 182GB there's about 30%
of a page being in memory. I didn't think of using debug_io_direct at
the time, but it doesn't affect the conclusion very much (in fact, it
would *increase* the random_page_cost value, which makes it worse).

I did this on the three SSDs I use for testing - 4x NVMe RAID0, 4x SATA
RAID0, and a single NVMe drive. Here's the results:

                seqscan (s)      index scan (s)  random_page_cost
 -----------------------------------------------------------------
  NVMe                   98               42232             20.4
  NVMe/RAID0             24               25462             49.3
  SATA/RAID0            109               48141             21.0

These are reasonably good SSDs, and yet the "correct" random_page cost
comes out about 5-10x of our default.

FWIW I double checked the test is actually I/O bound. The CPU usage
never goes over ~50% (not even in the the seqscan case).

These calculated values also align with the "optimal" plan choice, i.e.
the plans flip much closer to the actual crossing point (compared to
where it'd flip with 4.0).

It obviously contradicts the advice to set the value closer to 1.0. But
why is that? SSDs are certainly better with random I/0, even if the I/O
is not concurrent and the SSD is not fully utilized. So the 4.0 seems
off, the value should be higher than what we got for SSDs ...

I don't have any rotational devices in my test machines anymore, but I
got an azure VM with local "SCSI" disk, and with "standard HDD" volume.
And I got this (this is with 10M rows, ~3.7GB, with direct I/O):

                seqscan (s)      index scan (s)  random_page_cost
 -----------------------------------------------------------------
  SCSI                  2.1                1292             28.5
  standard HDD        209.8               27586             62.6

I suspect the SCSI disk is not actually rotational (or which model), it
seems more like an SSD with SCSI interface or what model is that. The
"standard HDD" seems much closer to rotational, with ~370 IOPS (it'd
take ages to do the index scan on more than 10M rows).

Unless I did some silly mistakes, these results suggest the current 4.0
value is a bit too low, and something like ~20 would be better even on
SSDs. This is not the first time it was suggested a higher default might
be better - see this 2008 post [3]. Of course, that's from before SSDs
became a thing, it's about evolution in hard disks and our code.

However, it also says this:

    Yeah, it seems like raising random_page_cost is not something we
    ever recommend in practice.  I suspect what we'd really need here to
    make any progress is a more detailed cost model, not just fooling
    with the parameters of the existing one.

I don't quite follow the reasoning. If increasing the cost model would
require making the cost model mode detailed, why wouldn't the same thing
apply for lowering it? I don't see a reason for asymmetry.

Also, I intentionally used a table with "perfectly random" data, because
that's about the simplest thing to estimate, and it indeed makes all the
estimates almost perfect (including the internal ones in cost_index). If
we can't cost such simple cases correctly, what's the point of costing?

From a robustness point of view, wouldn't it be better to actually err
on the side of using a higher random_page_cost value? That'd mean we
flip to "more-sequential" scans sooner, with much "flatter" behavior.
That doesn't need to be a seqscan (which is about as flat as it gets),
but e.g. a bitmap scan - which probably silently "fixes" many cases
where the index scan gets costed too low.

It also says this:

    And the value of 4 seems to work well in practice.

I wonder how do we know that? Most users don't experiment with different
values very much. They just run with the default, or maybe even lower
it, based on some recommendation. But they don't run the same query with
different values, so they can't spot differences unless they hit a
particularly bad plan.

Of course, it's also true most workloads tend to access well cached
data, which makes errors much cheaper. Or maybe just queries with the
"problematic selectivities" are not that common. Still, even if it
doesn't change the scan choice, it seems important to keep the cost
somewhat closer to reality because of the plan nodes above ...


It seems to me the current default is a bit too low, but changing a GUC
this important is not trivial. So what should we do about it?


regards


[1] https://www.postgresql.org/message-id/flat/14601.949786166@sss.pgh.pa.us

[2] https://www.postgresql.org/message-id/3866858.1728961439%40sss.pgh.pa.us

[3] https://www.postgresql.org/message-id/23625.1223642230%40sss.pgh.pa.us

--
Tomas Vondra
Вложения
Hi Tomas
I really can't agree more. Many default values are just too conservative, and the documentation doesn't provide best practices.,i think reduce to 1.x,Or add a tip in the document, providing a recommended value for different SSDs.
On Mon, 6 Oct 2025 at 08:59, Tomas Vondra <tomas@vondra.me> wrote:
Hi,
I wonder if it's time to consider updating the random_page_cost default
value. There are multiple reasons to maybe do that.
The GUC (and the 4.0 default) was introduced in ~2000 [1], so ~25 years
ago. During that time the world went from rotational drives through
multiple generations of flash / network-attached storage. I find it hard
to believe those changes wouldn't affect random_page_cost.
And indeed, it's common to advice to reduce the GUC closer to 1.0 on
SSDs. I myself recommended doing that in the past, but over time I got
somewhat skeptical about it. The advice is based on the "obvious" wisdom
that SSDs are much better in handling random I/O than rotational disks.
But this has two flaws. First, it assumes the current 4.0 default makes
sense - maybe it doesn't and then it's useless as a "starting point".
Second, it's not obvious how much better SSDs are without concurrent IOs
(which is needed to fully leverage the SSDs). Which we don't do for
index scans (yet), and even if we did, the cost model has no concept for
such concurrency.
Recently, I've been doing some experiments evaluating how often we pick
an optimal scan for simple select queries, assuming accurate estimates.
Turns out we pick the wrong plan fairly often, even with almost perfect
estimates. I somewhat expected that, with the default random_page_cost
value. What did surprise me was that to improve the plans, I had to
*increase* the value, even on really new/fast SSDs ...
I started looking at how we calculated the 4.0 default back in 2000.
Unfortunately, there's a lot of info, as Tom pointed out in 2024 [2].
But he outlined how the experiment worked:
- generate large table (much bigger than RAM)
- measure runtime of seq scan
- measure runtime of full-table index scan
- calculate how much more expensive a random page access is
So I decided to try doing this on a couple different devices, and see
what random_page_cost values that gives me. Attached is a script doing
such benchmark:
(1) initializes a new cluster, with a couple parameters adjusted
(2) creates a random table (with uniform distribution)
(3) runs a sequential scan
SELECT * FROM (SELECT * FROM test_table) OFFSET $nrows;
(4) runs an index scan
SELECT * FROM (SELECT * FROM test_table ORDER BY id) OFFSET $nrows;
The script does a couple things to force the query plan, and it reports
timings of the two queries at the end.
I've been running this on machines with 64GB of RAM, so I chose the
table to have 500M rows. With fillfactor=20 that means a ~182GB table
(23809524 pages).
Lets say that
T(seq) = timing of the seqscan query
T(idx) = timing of the index scan
IOS(seq) = number of sequential page reads
IOS(idx) = number of random page reads
P = number of pages
N = number of rows
then time to read a sequential page (because IOS(seq) == P)
PT(seq) = T(seq) / IOS(seq) = T(seq) / P
and time to read a random page (assuming the table is perfectly random,
with no cache hits):
PT(idx) = T(idx) / IOS(idx) = T(idx) / N
which gives us the "idea" random page cost (as a value relative to
reading a page sequentially)
random_page_cost = PT(idx) / PT(seq)
T(idx) * P
= --------------
T(seq) * N
The "no cache hits" is not quite correct, with 182GB there's about 30%
of a page being in memory. I didn't think of using debug_io_direct at
the time, but it doesn't affect the conclusion very much (in fact, it
would *increase* the random_page_cost value, which makes it worse).
I did this on the three SSDs I use for testing - 4x NVMe RAID0, 4x SATA
RAID0, and a single NVMe drive. Here's the results:
seqscan (s) index scan (s) random_page_cost
-----------------------------------------------------------------
NVMe 98 42232 20.4
NVMe/RAID0 24 25462 49.3
SATA/RAID0 109 48141 21.0
These are reasonably good SSDs, and yet the "correct" random_page cost
comes out about 5-10x of our default.
FWIW I double checked the test is actually I/O bound. The CPU usage
never goes over ~50% (not even in the the seqscan case).
These calculated values also align with the "optimal" plan choice, i.e.
the plans flip much closer to the actual crossing point (compared to
where it'd flip with 4.0).
It obviously contradicts the advice to set the value closer to 1.0. But
why is that? SSDs are certainly better with random I/0, even if the I/O
is not concurrent and the SSD is not fully utilized. So the 4.0 seems
off, the value should be higher than what we got for SSDs ...
I don't have any rotational devices in my test machines anymore, but I
got an azure VM with local "SCSI" disk, and with "standard HDD" volume.
And I got this (this is with 10M rows, ~3.7GB, with direct I/O):
seqscan (s) index scan (s) random_page_cost
-----------------------------------------------------------------
SCSI 2.1 1292 28.5
standard HDD 209.8 27586 62.6
I suspect the SCSI disk is not actually rotational (or which model), it
seems more like an SSD with SCSI interface or what model is that. The
"standard HDD" seems much closer to rotational, with ~370 IOPS (it'd
take ages to do the index scan on more than 10M rows).
Unless I did some silly mistakes, these results suggest the current 4.0
value is a bit too low, and something like ~20 would be better even on
SSDs. This is not the first time it was suggested a higher default might
be better - see this 2008 post [3]. Of course, that's from before SSDs
became a thing, it's about evolution in hard disks and our code.
However, it also says this:
Yeah, it seems like raising random_page_cost is not something we
ever recommend in practice. I suspect what we'd really need here to
make any progress is a more detailed cost model, not just fooling
with the parameters of the existing one.
I don't quite follow the reasoning. If increasing the cost model would
require making the cost model mode detailed, why wouldn't the same thing
apply for lowering it? I don't see a reason for asymmetry.
Also, I intentionally used a table with "perfectly random" data, because
that's about the simplest thing to estimate, and it indeed makes all the
estimates almost perfect (including the internal ones in cost_index). If
we can't cost such simple cases correctly, what's the point of costing?
From a robustness point of view, wouldn't it be better to actually err
on the side of using a higher random_page_cost value? That'd mean we
flip to "more-sequential" scans sooner, with much "flatter" behavior.
That doesn't need to be a seqscan (which is about as flat as it gets),
but e.g. a bitmap scan - which probably silently "fixes" many cases
where the index scan gets costed too low.
It also says this:
And the value of 4 seems to work well in practice.
I wonder how do we know that? Most users don't experiment with different
values very much. They just run with the default, or maybe even lower
it, based on some recommendation. But they don't run the same query with
different values, so they can't spot differences unless they hit a
particularly bad plan.
Of course, it's also true most workloads tend to access well cached
data, which makes errors much cheaper. Or maybe just queries with the
"problematic selectivities" are not that common. Still, even if it
doesn't change the scan choice, it seems important to keep the cost
somewhat closer to reality because of the plan nodes above ...
It seems to me the current default is a bit too low, but changing a GUC
this important is not trivial. So what should we do about it?
regards
[1] https://www.postgresql.org/message-id/flat/14601.949786166@sss.pgh.pa.us
[2] https://www.postgresql.org/message-id/3866858.1728961439%40sss.pgh.pa.us
[3] https://www.postgresql.org/message-id/23625.1223642230%40sss.pgh.pa.us
--
Tomas Vondra
On Mon, 6 Oct 2025 at 17:19, wenhui qiu <qiuwenhuifx@gmail.com> wrote:
> I really can't agree more. Many default values are just too conservative, and the documentation doesn't provide best
practices.,ithink reduce to 1.x,Or add a tip in the document, providing a recommended value for different SSDs.

Did you read Tomas's email or just the subject line?  I think if
you're going to propose to move it in the opposite direction as to
what Tomas found to be the more useful direction, then that at least
warrants providing some evidence to the contrary of what Tomas has
shown or stating that you think his methodology for his calculation is
flawed because...

I suspect all you've done here is propagate the typical advice people
give out around here.  It appears to me that Tomas went to great
lengths to not do that.

David
po 6. 10. 2025 v 6:46 odesílatel David Rowley <dgrowleyml@gmail.com> napsal:
On Mon, 6 Oct 2025 at 17:19, wenhui qiu <qiuwenhuifx@gmail.com> wrote:
> I really can't agree more. Many default values are just too conservative, and the documentation doesn't provide best practices.,i think reduce to 1.x,Or add a tip in the document, providing a recommended value for different SSDs.
Did you read Tomas's email or just the subject line? I think if
you're going to propose to move it in the opposite direction as to
what Tomas found to be the more useful direction, then that at least
warrants providing some evidence to the contrary of what Tomas has
shown or stating that you think his methodology for his calculation is
flawed because...
I suspect all you've done here is propagate the typical advice people
give out around here. It appears to me that Tomas went to great
lengths to not do that.
+1
The problem will be in estimation of the effect of cache. It can be pretty wide range.
I have a access to not too small eshop in Czech Republic (but it is not extra big) - It uses today classic stack - Java (ORM), Elastic, Postgres. The database size is cca 1.9T, shared buffers are 32GB (it handles about 10-20K logged users at one time).
The buffer cache hit ratio is 98.42%. The code is well optimized. This ratio is not calculated with file system cache.
I believe so for different applications (OLAP) or less well optimized the cache hit ratio can be much much worse.
Last year I had an experience with customers that had Postgres in clouds, and common (not extra expensive) discs are not great parameters today. It is a question if one ratio like random page cost / seq page cost can well describe dynamic throttling (or dynamic behavior of current clouds io) where customers frequently touch limits.
Regards
Pavel
David
On Mon, 6 Oct 2025 at 13:59, Tomas Vondra <tomas@vondra.me> wrote:
> Unless I did some silly mistakes, these results suggest the current 4.0
> value is a bit too low, and something like ~20 would be better even on
> SSDs. This is not the first time it was suggested a higher default might
> be better - see this 2008 post [3]. Of course, that's from before SSDs
> became a thing, it's about evolution in hard disks and our code.

Thanks for going to all that effort to calculate that. It was an
interesting read and also very interesting that you found the opposite
to the typical advice that people typically provide.

I don't have any HDDs around to run the script to check the results. I
do have a machine with 2 SSDs, one PCIe3 and one PCIe4. I'll see if I
can get you some results from that.

It would be interesting to see how your calculated values fare when
given a more realistic workload. Say TPC-H or Join Order Benchmark.  I
recall that TPCH has both a power and a throughput result, one to test
concurrency and one for single query throughput. I wonder if the same
random_page_cost setting would be preferred in both scenarios. I can
imagine that it might be more useful to have more index pages in
shared buffers when there's strong contention for buffers. It would be
interesting to run some pg_buffercache queries with GROUP BY relkind
to see how much of an effect changing random_page_cost has on the
number of buffers per relkind after each query.

I wonder if the OtterTune people collected any "phone-home"
information feeding back about what the software picked for GUCs. It
would be interesting to know if there was some trend to show what the
best random_page_cost setting was or if the best setting varied based
on the server and workload.

David
Tomas Vondra <tomas@vondra.me> writes:
> I wonder if it's time to consider updating the random_page_cost default
> value. There are multiple reasons to maybe do that.

Re-reading the old links you provided, I was reminded that the 4.0
value came in with some fairly fundamental changes to the cost model,
such as accounting for WHERE-clause evaluation explicitly instead of
assuming that it was down in the noise.  I can't help wondering if
it's time for another rethink of what the cost model is, rather than
just messing with its coefficients.  I don't have any concrete ideas
about what that should look like, though.

Another angle is that I expect that the ongoing AIO work will largely
destroy the existing model altogether, at least if you think in terms
of the model as trying to predict query execution time.  But if what
we're trying to model is net resource demands, with an eye to
minimizing the total system load not execution time of any one query,
maybe we can continue to work with something close to what we've
traditionally done.

No answers here, just more questions ...

            regards, tom lane
On Mon, 2025-10-06 at 02:59 +0200, Tomas Vondra wrote:
> I wonder if it's time to consider updating the random_page_cost default
> value. There are multiple reasons to maybe do that.
>
> [experiments]
>
> Unless I did some silly mistakes, these results suggest the current 4.0
> value is a bit too low, and something like ~20 would be better even on
> SSDs.
>
> [...]
>
> It seems to me the current default is a bit too low, but changing a GUC
> this important is not trivial. So what should we do about it?

I have no reason to doubt your experiments and your reasoning.

However, my practical experience is that PostgreSQL tends to favor
sequential scans too much.  Often, that happens together with a parallel
plan, and I find PostgreSQL with the default configuration prefer a plan
with two parallel workers performing a sequential scan with a ridiculously
selective (correctly estimated!) filter condition like 500 rows out of a
million over an index scan that is demonstrably faster.

I have no artificial reproducer for that, and I admit that I didn't hunt
down the reason why the planner might prefer such a plan.  I just tell
people to lower random_page_cost, and the problem goes away.  So I am
clearly fighting symptoms.  Often, an alternative solution is to set
max_parallel_workers_per_gather to 0, which seems to suggest that perhaps
the suggestion from [1] is more interesting than I thought.

Anyway, I cannot remember ever having been in a situation where PostgreSQL
prefers a slow index scan, and I had to raise random_page_cost to get a
faster sequential scan.  Perhaps that is because slow index scans are often
not drastically slower, perhaps I deal too little with purely analytical
queries.

Again, this doesn't invalidate any of what you said.  I just wanted to
share my experiences.

Yours,
Laurenz Albe


 [1]: https://postgr.es/m/a5916f83-de79-4a40-933a-fb0d9ba2f5a0%40app.fastmail.com
On Mon, 2025-10-06 at 01:29 -0400, Tom Lane wrote:
> But if what
> we're trying to model is net resource demands, with an eye to
> minimizing the total system load not execution time of any one query,
> maybe we can continue to work with something close to what we've
> traditionally done.

Did anybody propose that?
I was under the impression that PostgreSQL's cost model tries to
estimate and optimize execution time, not resource consumption.
Changing that would be pretty radical.  For example, it would be
quite obvious that we'd have to disable parallel query by default.

But perhaps I misunderstood, or perhaps I am just too conservative.

Yours,
Laurenz Albe
Laurenz Albe <laurenz.albe@cybertec.at> writes:
> On Mon, 2025-10-06 at 01:29 -0400, Tom Lane wrote:
>> But if what
>> we're trying to model is net resource demands, with an eye to
>> minimizing the total system load not execution time of any one query,
>> maybe we can continue to work with something close to what we've
>> traditionally done.

> Did anybody propose that?

I just did ;-).  If we don't adopt a mindset along that line,
then AIO is going to require some *radical* changes in the
planner's I/O cost models.

> I was under the impression that PostgreSQL's cost model tries to
> estimate and optimize execution time, not resource consumption.

Yup, that's our traditional view of it.  But I wonder how we
will make such estimates in a parallel-I/O world, especially
if we don't try to account for concurrent query activity.
(Which is a place I don't want to go, because it would render
planning results utterly irreproducible.)

> But perhaps I misunderstood, or perhaps I am just too conservative.

I'm normally pretty conservative also about changing planner
behavior.  But in this context I think we need to be wary of
thinking too small.  The fact that people keep coming out with
different ideas of what random_page_cost needs to be suggests
that there's something fundamentally wrong with the concept.

            regards, tom lane
On 10/6/25 07:25, Pavel Stehule wrote:
>
>
> po 6. 10. 2025 v 6:46 odesílatel David Rowley <dgrowleyml@gmail.com
> <mailto:dgrowleyml@gmail.com>> napsal:
>
>     On Mon, 6 Oct 2025 at 17:19, wenhui qiu <qiuwenhuifx@gmail.com
>     <mailto:qiuwenhuifx@gmail.com>> wrote:
>     > I really can't agree more. Many default values are just too
>     conservative, and the documentation doesn't provide best
>     practices.,i think reduce to 1.x,Or add a tip in the document,
>     providing a recommended value for different SSDs.
>
>     Did you read Tomas's email or just the subject line?  I think if
>     you're going to propose to move it in the opposite direction as to
>     what Tomas found to be the more useful direction, then that at least
>     warrants providing some evidence to the contrary of what Tomas has
>     shown or stating that you think his methodology for his calculation is
>     flawed because...
>
>     I suspect all you've done here is propagate the typical advice people
>     give out around here.  It appears to me that Tomas went to great
>     lengths to not do that.
>
>
> +1
>
> The problem will be in estimation of the effect of cache. It can be
> pretty wide range.
>
> I have a access to not too small eshop in Czech Republic (but it is not
> extra big) - It uses today classic stack - Java (ORM), Elastic,
> Postgres. The database size is cca 1.9T, shared buffers are 32GB (it
> handles about 10-20K logged users at one time).
>
> The buffer cache hit ratio is 98.42%. The code is well optimized. This
> ratio is not calculated with file system cache.
>
> I believe so for different applications  (OLAP) or less well optimized
> the cache hit ratio can be much much worse.
>
> Last year I had an experience with customers that had Postgres in
> clouds, and common (not extra expensive) discs are not great parameters
> today. It is a question if one ratio like random page cost / seq page
> cost can well describe dynamic throttling (or dynamic behavior of
> current clouds io) where customers frequently touch limits.
>

Perhaps. Estimating cache effects is hard, no argument about that.

The estimation works by assuming no cache, and then adjusting it based
on some rough approximation of cache effects. If we can't get the first
step sufficiently close to reality, there's no chance of getting good
final estimate.

The test queries were intentionally constructed (data size, randomness)
to make caching mostly irrelevant - both for estimation and execution.


regards

--
Tomas Vondra
On 10/6/25 07:26, David Rowley wrote:
> On Mon, 6 Oct 2025 at 13:59, Tomas Vondra <tomas@vondra.me> wrote:
>> Unless I did some silly mistakes, these results suggest the current 4.0
>> value is a bit too low, and something like ~20 would be better even on
>> SSDs. This is not the first time it was suggested a higher default might
>> be better - see this 2008 post [3]. Of course, that's from before SSDs
>> became a thing, it's about evolution in hard disks and our code.
>
> Thanks for going to all that effort to calculate that. It was an
> interesting read and also very interesting that you found the opposite
> to the typical advice that people typically provide.
>
> I don't have any HDDs around to run the script to check the results. I
> do have a machine with 2 SSDs, one PCIe3 and one PCIe4. I'll see if I
> can get you some results from that.
>

Yeah, that'd be interesting. I don't think it'll be massively different
from the data I collected, but more data is good.

FWIW I suggest modifying the script to use "debug_io_direct = data" and
smaller shared_buffers. That allows using much smaller data sets (and
thus faster runs).

> It would be interesting to see how your calculated values fare when
> given a more realistic workload. Say TPC-H or Join Order Benchmark.  I
> recall that TPCH has both a power and a throughput result, one to test
> concurrency and one for single query throughput. I wonder if the same
> random_page_cost setting would be preferred in both scenarios. I can
> imagine that it might be more useful to have more index pages in
> shared buffers when there's strong contention for buffers. It would be
> interesting to run some pg_buffercache queries with GROUP BY relkind
> to see how much of an effect changing random_page_cost has on the
> number of buffers per relkind after each query.
>

Good idea, I'll give TPC-H a try soon. My concern is that for complex
queries it's much harder to pinpoint the problem, and an estimation
error may sometime compensate (or amplify) an earlier one. Worth a try.

As for the concurrency, I don't have a great answer. But perhaps it's
related to Tom's point about AIO. I mean, AIO also turns serial IOs to
concurrent ones, so maybe it's similar to multiple concurrent queries?

> I wonder if the OtterTune people collected any "phone-home"
> information feeding back about what the software picked for GUCs. It
> would be interesting to know if there was some trend to show what the
> best random_page_cost setting was or if the best setting varied based
> on the server and workload.
>

No idea, and given OT is gone I doubt we'd get any data.


regards

--
Tomas Vondra
On Mon, 2025-10-06 at 01:53 -0400, Tom Lane wrote:
> Laurenz Albe <laurenz.albe@cybertec.at> writes:
> > On Mon, 2025-10-06 at 01:29 -0400, Tom Lane wrote:
> > > But if what
> > > we're trying to model is net resource demands, with an eye to
> > > minimizing the total system load not execution time of any one query,
> > > maybe we can continue to work with something close to what we've
> > > traditionally done.
>
> > Did anybody propose that?
>
> I just did ;-).  If we don't adopt a mindset along that line,
> then AIO is going to require some *radical* changes in the
> planner's I/O cost models.

I see your point, and actually the idea of the planner targeting
the lowest resource usage ist quite attractive.  That is, in a
situation where you want to optimize throughput.  I regularly
find myself advising users that if their CPU load is approaching
100%, they had better disable parallel query.

But I am afraid that that would pessimize plans for analytical
queries, where your sole goal is a low response time.

This is far from a serious proposal, but perhaps there could be
a parameter "optimizer_goal" with values "throughput", "response_time"
and "mixed" that determines the default value for other parameters...

Yours,
Laurenz Albe
On 10/6/25 07:34, Laurenz Albe wrote:
> On Mon, 2025-10-06 at 02:59 +0200, Tomas Vondra wrote:
>> I wonder if it's time to consider updating the random_page_cost default
>> value. There are multiple reasons to maybe do that.
>>
>> [experiments]
>>
>> Unless I did some silly mistakes, these results suggest the current 4.0
>> value is a bit too low, and something like ~20 would be better even on
>> SSDs.
>>
>> [...]
>>
>> It seems to me the current default is a bit too low, but changing a GUC
>> this important is not trivial. So what should we do about it?
>
> I have no reason to doubt your experiments and your reasoning.
>
> However, my practical experience is that PostgreSQL tends to favor
> sequential scans too much.  Often, that happens together with a parallel
> plan, and I find PostgreSQL with the default configuration prefer a plan
> with two parallel workers performing a sequential scan with a ridiculously
> selective (correctly estimated!) filter condition like 500 rows out of a
> million over an index scan that is demonstrably faster.
>
> I have no artificial reproducer for that, and I admit that I didn't hunt
> down the reason why the planner might prefer such a plan.  I just tell
> people to lower random_page_cost, and the problem goes away.  So I am
> clearly fighting symptoms.  Often, an alternative solution is to set
> max_parallel_workers_per_gather to 0, which seems to suggest that perhaps
> the suggestion from [1] is more interesting than I thought.
>

I don't doubt your experience, but to draw any conclusions from this
report we'd need to understand why it happens. I suspect there's some
estimation issue (likely unrelated to random_page_cost), or some effect
our cost model does not / can't consider. And lowering random_page_cost
simply compensates for the earlier error.

> Anyway, I cannot remember ever having been in a situation where PostgreSQL
> prefers a slow index scan, and I had to raise random_page_cost to get a
> faster sequential scan.  Perhaps that is because slow index scans are often
> not drastically slower, perhaps I deal too little with purely analytical
> queries.
>

I mentioned a couple factors mitigating the worst effects at the end of
my initial message.

The "range" where we cost seqscan and indexscan in the wrong way is not
that wide. In the NVMe RAID0 case we should flip at 0.1%, but we flip
(based on cost) at ~1.5%. At which point index scan is 10x more
expensive than seq scan.

Maybe people don't do queries in this range too often? On the 500M table
it's ~5M rows, which for OLTP seems like a lot and for OLAP it's
probably too little. Real data is likely more correlated (and thus
benefit from caching).

And of course, we don't flip between seqscan/indexscan, we also have
bitmapscan, and that behaves much more reasonably.


regards

--
Tomas Vondra
Hi,

On Mon, Oct 06, 2025 at 02:59:16AM +0200, Tomas Vondra wrote:
> I started looking at how we calculated the 4.0 default back in 2000.
> Unfortunately, there's a lot of info, as Tom pointed out in 2024 [2].
> But he outlined how the experiment worked:
>
> - generate large table (much bigger than RAM)
> - measure runtime of seq scan
> - measure runtime of full-table index scan
> - calculate how much more expensive a random page access is

Ok, but I also read somewhere (I think it might have been Bruce in a
recent (last few years) discussion of random_page_cost) that on top of
that, we assumed 90% (or was it 95%?) of the queries were cached in
shared_buffers (probably preferably the indexes), so that while random
access is massively slower than sequential access (surely not 4x by
2000) is offset by that. I only quickly read your mail, but I didn't see
any discussion of caching on first glance, or do you think it does not
matter much?


Michael
On 10/6/25 11:02, Michael Banck wrote:
> Hi,
>
> On Mon, Oct 06, 2025 at 02:59:16AM +0200, Tomas Vondra wrote:
>> I started looking at how we calculated the 4.0 default back in 2000.
>> Unfortunately, there's a lot of info, as Tom pointed out in 2024 [2].
>> But he outlined how the experiment worked:
>>
>> - generate large table (much bigger than RAM)
>> - measure runtime of seq scan
>> - measure runtime of full-table index scan
>> - calculate how much more expensive a random page access is
>
> Ok, but I also read somewhere (I think it might have been Bruce in a
> recent (last few years) discussion of random_page_cost) that on top of
> that, we assumed 90% (or was it 95%?) of the queries were cached in
> shared_buffers (probably preferably the indexes), so that while random
> access is massively slower than sequential access (surely not 4x by
> 2000) is offset by that. I only quickly read your mail, but I didn't see
> any discussion of caching on first glance, or do you think it does not
> matter much?
>

I think you're referring to this:

https://www.postgresql.org/message-id/1156772.1730397196%40sss.pgh.pa.us

As Tom points out, that's not really how we calculated the 4.0 default.
We should probably remove that from the docs.


regards

--
Tomas Vondra
On 10/6/25 07:29, Tom Lane wrote:
> Tomas Vondra <tomas@vondra.me> writes:
>> I wonder if it's time to consider updating the random_page_cost default
>> value. There are multiple reasons to maybe do that.
>
> Re-reading the old links you provided, I was reminded that the 4.0
> value came in with some fairly fundamental changes to the cost model,
> such as accounting for WHERE-clause evaluation explicitly instead of
> assuming that it was down in the noise.  I can't help wondering if
> it's time for another rethink of what the cost model is, rather than
> just messing with its coefficients.  I don't have any concrete ideas
> about what that should look like, though.
>

True, maybe it's time for a larger revision. Do you have any thoughts on
how it should be changed? (I don't, but I didn't have the ambition.)

> Another angle is that I expect that the ongoing AIO work will largely
> destroy the existing model altogether, at least if you think in terms
> of the model as trying to predict query execution time.  But if what
> we're trying to model is net resource demands, with an eye to
> minimizing the total system load not execution time of any one query,
> maybe we can continue to work with something close to what we've
> traditionally done.
>
> No answers here, just more questions ...
>

I had the same thought, when working on the (index) prefetching. Which
of course now relies on AIO. Without concurrency, there wasn't much
difference between optimizing for resources and time, but AIO changes
that. In fact, parallel query has a similar effect, because it also
spreads the work to multiple concurrent processes.

Parallel query simply divides the cost between workers, as if each use a
fraction of resources. And the cost of the parallel plan is lower than
summing up the per-worker costs. Maybe AIO should do something similar?
That is, estimate the I/O concurrency and lower the cost a bit?


regards

--
Tomas Vondra
On Mon, Oct 6, 2025 at 11:24 AM Tomas Vondra <tomas@vondra.me> wrote:
>
> On 10/6/25 07:29, Tom Lane wrote:
> > Tomas Vondra <tomas@vondra.me> writes:
[..]
>
> > Another angle is that I expect that the ongoing AIO work will largely
> > destroy the existing model altogether, at least if you think in terms
> > of the model as trying to predict query execution time.
[..]
> That is, estimate the I/O concurrency and lower the cost a bit?

Side question, out of curiosity: didn't the ship already sail with
introduction of streaming read API back in a while ago? After all, the
io_combine_limit with vectored preadv() has the ability to greatly
accelerate seq scans (that would mean batching up to 16 syscalls while
the kernel is doing its own magic in the background anyway - with
merging/splitting/readaheads). To me it looks like you are
experiencing heavy concurrency benefits at least on that `NVMe/RAID0`
testcase, so one question would be: does the default random_page_cost
be also that inaccurate earlier, on e.g. PG16?

-J.
Hi,

On 2025-10-06 02:59:16 +0200, Tomas Vondra wrote:
> So I decided to try doing this on a couple different devices, and see
> what random_page_cost values that gives me. Attached is a script doing
> such benchmark:
>
> (1) initializes a new cluster, with a couple parameters adjusted
>
> (2) creates a random table (with uniform distribution)
>
> (3) runs a sequential scan
>
>     SELECT * FROM (SELECT * FROM test_table) OFFSET $nrows;
>
> (4) runs an index scan
>
>     SELECT * FROM (SELECT * FROM test_table ORDER BY id) OFFSET $nrows;

Why compare an unordered with an ordered scan? ISTM that if you want to
actually compare the cost of two different approaches to the same query, you'd
not want to actually change what the query does?  Yes, you say that CPU time
never gets above 50%, but 50% isn't nothing.

It also seems that due to the ordering inside the table (the order by
random()) during the table creation, you're going to see vastly different
number of page accesses.  While that's obviously something worth taking into
account for planning purposes, I don't think it'd be properly done by the
random_page_cost itself.


I think doing this kind of measurement via normal SQL query processing is
almost always going to have too much other influences. I'd measure using fio
or such instead.  It'd be interesting to see fio numbers for your disks...

fio --directory /srv/fio --size=8GiB --name test --invalidate=0 --bs=$((8*1024)) --rw read --buffered 0 --time_based=1
--runtime=5--ioengine pvsync  --iodepth 1

vs --rw randread

gives me 51k/11k for sequential/rand on one SSD and 92k/8.7k for another.


> It obviously contradicts the advice to set the value closer to 1.0. But
> why is that? SSDs are certainly better with random I/0, even if the I/O
> is not concurrent and the SSD is not fully utilized. So the 4.0 seems
> off, the value should be higher than what we got for SSDs ...

I'd guess that the *vast* majority of PG workloads these days run on networked
block storage. For those typically the actual latency at the storage level is
a rather small fraction of the overall IO latency, which is instead dominated
by network and other related cost (like the indirection to which storage
system to go to and crossing VM/host boundaries).  Because the majority of the
IO latency is not affected by the storage latency, but by network lotency, the
random IO/non-random IO difference will play less of a role.


> From a robustness point of view, wouldn't it be better to actually err
> on the side of using a higher random_page_cost value? That'd mean we
> flip to "more-sequential" scans sooner, with much "flatter" behavior.
> That doesn't need to be a seqscan (which is about as flat as it gets),
> but e.g. a bitmap scan - which probably silently "fixes" many cases
> where the index scan gets costed too low.

I think it's often the exact opposite - folks use a lower random page cost to
*prevent* the planner from going to sequential (or bitmap heap) scans. In many
real-world queries our selectivity estimates aren't great and the performance
penalties of switching from an index scan to a sequential scan are really
severe. As you note, this is heavily exascerbated by the hot data often being
cached, but cold data not. Obviously the seqscan will process the cold data
too.

Greetings,

Andres Freund
Hi,

On 2025-10-06 01:53:05 -0400, Tom Lane wrote:
> Laurenz Albe <laurenz.albe@cybertec.at> writes:
> > On Mon, 2025-10-06 at 01:29 -0400, Tom Lane wrote:
> >> But if what
> >> we're trying to model is net resource demands, with an eye to
> >> minimizing the total system load not execution time of any one query,
> >> maybe we can continue to work with something close to what we've
> >> traditionally done.
>
> > Did anybody propose that?
>
> I just did ;-).  If we don't adopt a mindset along that line,
> then AIO is going to require some *radical* changes in the
> planner's I/O cost models.

FWIW, I think some vaguely-AIO related cost concept already ought to long have
been taken into account, but weren't. I'm not trying to say that we don't need
to do work, but that asynchronizity related issues are bigger than explicit
asynchronuous IO.


E.g., despite there often being a >10x performance difference between a
forward and backward index scan in case the index and table order are well
correlated, we didn't cost them any differently. The reason for that being
that the OS will do readahead for forward scans, but not backward scans.

Here's an example explain analyse on a disk with an artification 1ms latency
(to simulate networked storage):


echo 3 |sudo tee /proc/sys/vm/drop_caches && psql -Xq -f ~/tmp/evict.sql && \
/usr/bin/time -f '%e' psql -Xq -c 'explain analyze SELECT * FROM aiobench ORDER BY serial_val ASC LIMIT 1 OFFSET
100000;'

                                                                             QUERY PLAN
                                       >


-------------------------------------------------------------------------------------------------------------------------------------------------------------->
   Limit  (cost=4455.58..4455.62 rows=1 width=120) (actual time=49.820..49.821 rows=1.00 loops=1)
     Buffers: shared hit=553 read=2145
     I/O Timings: shared read=36.096
     ->  Index Scan using aiobench_serial_val_idx on aiobench  (cost=0.57..8908138.12 rows=199957824 width=120) (actual
time=2.971..47.261rows=100001.00 loops=>

           Index Searches: 1
           Buffers: shared hit=553 read=2145
           I/O Timings: shared read=36.096
   Planning:
     Buffers: shared hit=113 read=23
     I/O Timings: shared read=10.618
   Planning Time: 10.981 ms
   Execution Time: 49.838 ms
  (12 rows)


echo 3 |sudo tee /proc/sys/vm/drop_caches && psql -Xq -f ~/tmp/evict.sql && \
  /usr/bin/time -f '%e' psql -Xq -c 'explain analyze SELECT * FROM aiobench ORDER BY serial_val DESC LIMIT 1 OFFSET
100000;'
                                                                                   QUERY PLAN
                                       >


-------------------------------------------------------------------------------------------------------------------------------------------------------------->
   Limit  (cost=4455.58..4455.62 rows=1 width=120) (actual time=2138.047..2138.049 rows=1.00 loops=1)
     Buffers: shared hit=739 read=2138
     I/O Timings: shared read=2123.844
     ->  Index Scan Backward using aiobench_serial_val_idx on aiobench  (cost=0.57..8908138.12 rows=199957824
width=120)(actual time=4.912..2135.519 rows=10000>

           Index Searches: 1
           Buffers: shared hit=739 read=2138
           I/O Timings: shared read=2123.844
   Planning:
     Buffers: shared hit=112 read=23
     I/O Timings: shared read=10.446
   Planning Time: 10.816 ms
   Execution Time: 2138.067 ms
  (12 rows)


36ms vs 2123ms in IO time, with the same cost.

Of course these queries *do* something different, but we often choose ordered
index scans as a way of implementing a query (e.g. as part of fast start
plans), where there are other alternatives of implementing the same query.


Another example of costing around this being bad is that we do not take
effective_io_concurrency into account when planning bitmap heap scans, despite
that often making a *massive* difference in whether a bitmap heap scan is a
good choice or a bad choice. E.g. on the system with the simulated 1ms IO
latency, the difference between 1 and 32 is vast.


eic=1:
                                                                         QUERY PLAN

--------------------------------------------------------------------------------------------------------------------------------------------------------
   Aggregate  (cost=606243.51..606243.52 rows=1 width=8) (actual time=184218.775..184218.776 rows=1.00 loops=1)
     Buffers: shared hit=2 read=194846
     I/O Timings: shared read=183913.048
     ->  Bitmap Heap Scan on aiobench  (cost=3900.18..605784.10 rows=183767 width=8) (actual time=79.811..184202.181
rows=199465.00loops=1)

           Recheck Cond: ((random_val >= '0.001'::double precision) AND (random_val <= '0.002'::double precision))
           Heap Blocks: exact=194299
           Buffers: shared hit=2 read=194846
           I/O Timings: shared read=183913.048
           ->  Bitmap Index Scan on aiobench_random_val_idx  (cost=0.00..3854.24 rows=183767 width=0) (actual
time=37.287..37.288rows=199465.00 loops=1)

                 Index Cond: ((random_val >= '0.001'::double precision) AND (random_val <= '0.002'::double precision))
                 Index Searches: 1
                 Buffers: shared hit=2 read=547
                 I/O Timings: shared read=4.972
   Planning:
     Buffers: shared hit=76 read=24
     I/O Timings: shared read=11.571
   Planning Time: 12.953 ms
   Execution Time: 184218.986 ms


eic=64:
                                                                         QUERY PLAN

--------------------------------------------------------------------------------------------------------------------------------------------------------
   Aggregate  (cost=606243.51..606243.52 rows=1 width=8) (actual time=2962.965..2962.966 rows=1.00 loops=1)
     Buffers: shared hit=2 read=194846
     I/O Timings: shared read=2316.070
     ->  Bitmap Heap Scan on aiobench  (cost=3900.18..605784.10 rows=183767 width=8) (actual time=82.871..2947.892
rows=199465.00loops=1)

           Recheck Cond: ((random_val >= '0.001'::double precision) AND (random_val <= '0.002'::double precision))
           Heap Blocks: exact=194299
           Buffers: shared hit=2 read=194846
           I/O Timings: shared read=2316.070
           ->  Bitmap Index Scan on aiobench_random_val_idx  (cost=0.00..3854.24 rows=183767 width=0) (actual
time=38.526..38.526rows=199465.00 loops=1)

                 Index Cond: ((random_val >= '0.001'::double precision) AND (random_val <= '0.002'::double precision))
                 Index Searches: 1
                 Buffers: shared hit=2 read=547
                 I/O Timings: shared read=5.021
   Planning:
     Buffers: shared hit=76 read=24
     I/O Timings: shared read=11.485
   Planning Time: 12.890 ms
   Execution Time: 2963.154 ms
  (18 rows)


A ~60x query execution difference that's not at all represented in the cost
model. The former makes a bitmap heap scan a terrible choice, the latter a
good one...


> > I was under the impression that PostgreSQL's cost model tries to
> > estimate and optimize execution time, not resource consumption.
>
> Yup, that's our traditional view of it.  But I wonder how we
> will make such estimates in a parallel-I/O world, especially
> if we don't try to account for concurrent query activity.
> (Which is a place I don't want to go, because it would render
> planning results utterly irreproducible.)

Another complicated aspect around this is that we don't take caching into
account in any real-world reflecting way.  In common workloads the hotly
accessed data is all in shared_buffers, but the cold portion of the data is
not. In such scenarios switching e.g. from an index scan to a sequential scan
will be way worse, since it'll likely eat up a good portion of the IO
bandwidth and possibly pollute the buffer pool, than in a scenario where all
the data is cold.

At the same time, leaving the difficulty of estimating that aside, making
plans depend on the current state of the buffer pool has some fairly obvious,
and massive, downsides. Like unstable plans and never actually ending up in
the "high performance" situation after a restart, due choosing plans that just
work for an empty buffer pool.

I do not have the *slightest* idea for how to improve the situation around
this, even though I think it's fairly important.


> > But perhaps I misunderstood, or perhaps I am just too conservative.
>
> I'm normally pretty conservative also about changing planner
> behavior.  But in this context I think we need to be wary of
> thinking too small.  The fact that people keep coming out with
> different ideas of what random_page_cost needs to be suggests
> that there's something fundamentally wrong with the concept.

I think one of the big issues with random_page_cost is that it combines two
largely independent things:

1) the increased cost of doing a random IO over sequential IO
2) that random IOs very often are synchronuous and hard to predict / unpredictable

But we had support for doing readahead for some random IO for a long time (the
posix_fadvise() calls within bitmap heap scans), just without taking that into
account from a costing POV.


I suspect that we'll continue to need to somehow distinguish between
random/non-random IO, the differences are simply too large at the storage
level to ignore.

But that we need to add accounting for whether IO is synchronuous and when
not. If you have a bunch of random IOs, but you cheaply know them ahead of
time (say in bitmap heap scan), there should be a different cost for the query
than if there a bunch of random IOs that we cannot realistically predict (say
the IO for inner index pages in an ordered index scan or all accesses as part
of an index nested loop where the inner side is unique).


Unfortunately that will probably make it more problematic that we aren't
modeling resource consumption - costing a query that does 10x as many, but
prefetchable, IOs than a ever so slightly more expensive query is probably not
a tradeoff that most want to pay.

Greetings,

Andres Freund
Hi,

On 2025-10-06 07:34:53 +0200, Laurenz Albe wrote:
> However, my practical experience is that PostgreSQL tends to favor
> sequential scans too much.  Often, that happens together with a parallel
> plan, and I find PostgreSQL with the default configuration prefer a plan
> with two parallel workers performing a sequential scan with a ridiculously
> selective (correctly estimated!) filter condition like 500 rows out of a
> million over an index scan that is demonstrably faster.
>
> I have no artificial reproducer for that, and I admit that I didn't hunt
> down the reason why the planner might prefer such a plan.  I just tell
> people to lower random_page_cost, and the problem goes away.  So I am
> clearly fighting symptoms.  Often, an alternative solution is to set
> max_parallel_workers_per_gather to 0, which seems to suggest that perhaps
> the suggestion from [1] is more interesting than I thought.

I've seen this quite often too. IIRC in the cases I've actually analyzed in
any depth it came down to a few root causes:

1) Fast start plans (where the planner though that a sequential scan will find
   a matching tuple quickly, but doesn't, leading to scanning most of the
   table). I frankly think we should just disable these, they're a very low
   confidence bet with high costs in the case of a loss.

2) Not taking the likelihood of data already being cached into account leads
   to preferring sequential scans due to seq_page_cost, even though the index
   scan would not have required any IO

3) Our costing for the cost of predicate evaluation is extremely poor. Among
   the reasons are

   - There is no difference in cost between common operators, despite
     significant real evaluation cost. E.g. int and text operators are not
     close in evaluation cost.

   - IIRC we disregard the cost of potentially needing to detoast completely,
     despite that very easily becoming the determining factor

   - Tuple deforming cost. It's a lot more CPU intensive to deform column 105
     than column 5, often the index might avoid needing to do the more
     epensive deforming, but we don't take that into account.

   This often leads to under-estimating the CPU cost of seqscans.

Greetings,

Andres Freund
On Mon, Oct  6, 2025 at 11:12:00AM +0200, Tomas Vondra wrote:
> On 10/6/25 11:02, Michael Banck wrote:
> > Hi,
> >
> > On Mon, Oct 06, 2025 at 02:59:16AM +0200, Tomas Vondra wrote:
> >> I started looking at how we calculated the 4.0 default back in 2000.
> >> Unfortunately, there's a lot of info, as Tom pointed out in 2024 [2].
> >> But he outlined how the experiment worked:
> >>
> >> - generate large table (much bigger than RAM)
> >> - measure runtime of seq scan
> >> - measure runtime of full-table index scan
> >> - calculate how much more expensive a random page access is
> >
> > Ok, but I also read somewhere (I think it might have been Bruce in a
> > recent (last few years) discussion of random_page_cost) that on top of
> > that, we assumed 90% (or was it 95%?) of the queries were cached in
> > shared_buffers (probably preferably the indexes), so that while random
> > access is massively slower than sequential access (surely not 4x by
> > 2000) is offset by that. I only quickly read your mail, but I didn't see
> > any discussion of caching on first glance, or do you think it does not
> > matter much?
> >
>
> I think you're referring to this:
>
> https://www.postgresql.org/message-id/1156772.1730397196%40sss.pgh.pa.us
>
> As Tom points out, that's not really how we calculated the 4.0 default.
> We should probably remove that from the docs.

Uh, that might not be how we tested to find the default value, but I
thought it was the logic of why we _thought_ it was such a low value
compared to the speed difference of magnetic random vs sequential I/O.

--
  Bruce Momjian  <bruce@momjian.us>        https://momjian.us
  EDB                                      https://enterprisedb.com

  Do not let urgent matters crowd out time for investment in the future.
On Mon, Oct  6, 2025 at 11:14:13AM -0400, Andres Freund wrote:
> > It obviously contradicts the advice to set the value closer to 1.0. But
> > why is that? SSDs are certainly better with random I/0, even if the I/O
> > is not concurrent and the SSD is not fully utilized. So the 4.0 seems
> > off, the value should be higher than what we got for SSDs ...
>
> I'd guess that the *vast* majority of PG workloads these days run on networked
> block storage. For those typically the actual latency at the storage level is
> a rather small fraction of the overall IO latency, which is instead dominated
> by network and other related cost (like the indirection to which storage
> system to go to and crossing VM/host boundaries).  Because the majority of the
> IO latency is not affected by the storage latency, but by network lotency, the
> random IO/non-random IO difference will play less of a role.

Yes, the last time we discussed changing the default random page cost,
September 2024, the argument was that while SSDs should be < 4, cloud
storage might be > 4, so 4 was still a good value:

    https://www.postgresql.org/message-id/flat/877caxaxt6.fsf%40wibble.ilmari.org#8a10b7b8cf05410291d076f8def58c29

Add in cache effects for all of these storage devices as outlined in our
docs.

--
  Bruce Momjian  <bruce@momjian.us>        https://momjian.us
  EDB                                      https://enterprisedb.com

  Do not let urgent matters crowd out time for investment in the future.
Hi,

On 2025-10-06 12:57:20 -0400, Bruce Momjian wrote:
> On Mon, Oct  6, 2025 at 11:14:13AM -0400, Andres Freund wrote:
> > > It obviously contradicts the advice to set the value closer to 1.0. But
> > > why is that? SSDs are certainly better with random I/0, even if the I/O
> > > is not concurrent and the SSD is not fully utilized. So the 4.0 seems
> > > off, the value should be higher than what we got for SSDs ...
> >
> > I'd guess that the *vast* majority of PG workloads these days run on networked
> > block storage. For those typically the actual latency at the storage level is
> > a rather small fraction of the overall IO latency, which is instead dominated
> > by network and other related cost (like the indirection to which storage
> > system to go to and crossing VM/host boundaries).  Because the majority of the
> > IO latency is not affected by the storage latency, but by network lotency, the
> > random IO/non-random IO difference will play less of a role.
>
> Yes, the last time we discussed changing the default random page cost,
> September 2024, the argument was that while SSDs should be < 4, cloud
> storage might be > 4, so 4 was still a good value:
>
>     https://www.postgresql.org/message-id/flat/877caxaxt6.fsf%40wibble.ilmari.org#8a10b7b8cf05410291d076f8def58c29

I think it's exactly the other way round. The difference between random and
sequential IO is *smaller* on cloud storage than on local storage, due to
network IO being the biggest component of IO latency on cloud storage - and
network latency is the same for random and sequential IO.


> Add in cache effects for all of these storage devices as outlined in our
> docs.

As discussed in [1], the cache effect related comments in the docs seem pretty
bogus. We'd be much better off just removing them, they really don't make much
sense.

Greetings,

Andres Freund


[1] https://www.postgresql.org/message-id/1156772.1730397196%40sss.pgh.pa.us
On Mon, Oct  6, 2025 at 01:06:21PM -0400, Andres Freund wrote:
> Hi,
>
> On 2025-10-06 12:57:20 -0400, Bruce Momjian wrote:
> > On Mon, Oct  6, 2025 at 11:14:13AM -0400, Andres Freund wrote:
> > > > It obviously contradicts the advice to set the value closer to 1.0. But
> > > > why is that? SSDs are certainly better with random I/0, even if the I/O
> > > > is not concurrent and the SSD is not fully utilized. So the 4.0 seems
> > > > off, the value should be higher than what we got for SSDs ...
> > >
> > > I'd guess that the *vast* majority of PG workloads these days run on networked
> > > block storage. For those typically the actual latency at the storage level is
> > > a rather small fraction of the overall IO latency, which is instead dominated
> > > by network and other related cost (like the indirection to which storage
> > > system to go to and crossing VM/host boundaries).  Because the majority of the
> > > IO latency is not affected by the storage latency, but by network lotency, the
> > > random IO/non-random IO difference will play less of a role.
> >
> > Yes, the last time we discussed changing the default random page cost,
> > September 2024, the argument was that while SSDs should be < 4, cloud
> > storage might be > 4, so 4 was still a good value:
> >
> >     https://www.postgresql.org/message-id/flat/877caxaxt6.fsf%40wibble.ilmari.org#8a10b7b8cf05410291d076f8def58c29
>
> I think it's exactly the other way round. The difference between random and
> sequential IO is *smaller* on cloud storage than on local storage, due to
> network IO being the biggest component of IO latency on cloud storage - and
> network latency is the same for random and sequential IO.
>
> > Add in cache effects for all of these storage devices as outlined in our
> > docs.
>
> As discussed in [1], the cache effect related comments in the docs seem pretty
> bogus. We'd be much better off just removing them, they really don't make much
> sense.

Fine, but without the doc comments, we have _no_ logic for why the value
is so small.

--
  Bruce Momjian  <bruce@momjian.us>        https://momjian.us
  EDB                                      https://enterprisedb.com

  Do not let urgent matters crowd out time for investment in the future.
Hi,

On 2025-10-06 13:22:59 -0400, Bruce Momjian wrote:
> On Mon, Oct  6, 2025 at 01:06:21PM -0400, Andres Freund wrote:
> > On 2025-10-06 12:57:20 -0400, Bruce Momjian wrote:
> > > Add in cache effects for all of these storage devices as outlined in our
> > > docs.
> >
> > As discussed in [1], the cache effect related comments in the docs seem pretty
> > bogus. We'd be much better off just removing them, they really don't make much
> > sense.
>
> Fine, but without the doc comments, we have _no_ logic for why the value
> is so small.

That seems better than having a comment that is basically ahistorical and
conflates different things. We certainly shouldn't mention spinning disks,
they have not mattered as the storage for live database storage for at least a
decade.

*If* we do want to add some explanation, I think we'd be better off adding a
paragraph mentioning a few things:

- the default value of random_page_cost is a compromise between the latency of
  random IO on local storage and cloud storage, where the latter has a smaller
  difference between sequential and random IO

- some workloads are IOPS rather than latency or bandwidth bound, in which
  case it can be better to use sequential IO

- it can be advisable to favor indexed accesses over sequential access, even
  if sequential access is faster in some cases, as indexed accesses "degrade"
  somewhat gradually in performance with decreased selectivity, but the switch
  to sequential scan will have completely different performance
  characteristics.

Greetings,

Andres Freund
On 10/6/25 17:14, Andres Freund wrote:
> Hi,
>
> On 2025-10-06 02:59:16 +0200, Tomas Vondra wrote:
>> So I decided to try doing this on a couple different devices, and see
>> what random_page_cost values that gives me. Attached is a script doing
>> such benchmark:
>>
>> (1) initializes a new cluster, with a couple parameters adjusted
>>
>> (2) creates a random table (with uniform distribution)
>>
>> (3) runs a sequential scan
>>
>>     SELECT * FROM (SELECT * FROM test_table) OFFSET $nrows;
>>
>> (4) runs an index scan
>>
>>     SELECT * FROM (SELECT * FROM test_table ORDER BY id) OFFSET $nrows;
>
> Why compare an unordered with an ordered scan? ISTM that if you want to
> actually compare the cost of two different approaches to the same query, you'd
> not want to actually change what the query does?  Yes, you say that CPU time
> never gets above 50%, but 50% isn't nothing.
>

Because I need the second query to do an index scan, and without the
ORDER BY it refuses to do that (even with disabled seqscans), because we
don't even build the index path. The ordering does not add any overhead,
it merely forces reading data through the index.

OTOH I don't want ordering for the first query, because that'd add an
explicit Sort.

> It also seems that due to the ordering inside the table (the order by
> random()) during the table creation, you're going to see vastly different
> number of page accesses.  While that's obviously something worth taking into
> account for planning purposes, I don't think it'd be properly done by the
> random_page_cost itself.
>

I don't understand your argument. Yes, the index scan does way more page
accesses. Essentially, each index tuple reads a new page - and without a
cache hit it's an I/O. With fillfactor=20 we have ~21 tuples per heap
page, which means we have to read it ~21x. In other words, it reads as
many pages as there are tuples.

This is why my formulas divide the seqscan timing by number of pages,
but indexscan is divided by number of tuples. And AFAIK the costing does
exactly that too. So the random_page_cost doesn't need to do anything
special, we estimate the number of page reads. (And at least in the case
of random table it's pretty accurate.)

>
> I think doing this kind of measurement via normal SQL query processing is
> almost always going to have too much other influences. I'd measure using fio
> or such instead.  It'd be interesting to see fio numbers for your disks...
>
> fio --directory /srv/fio --size=8GiB --name test --invalidate=0 --bs=$((8*1024)) --rw read --buffered 0
--time_based=1--runtime=5 --ioengine pvsync  --iodepth 1

> vs --rw randread
>
> gives me 51k/11k for sequential/rand on one SSD and 92k/8.7k for another.
>

I can give it a try. But do we really want to strip "our" overhead with
reading data?

>
>> It obviously contradicts the advice to set the value closer to 1.0. But
>> why is that? SSDs are certainly better with random I/0, even if the I/O
>> is not concurrent and the SSD is not fully utilized. So the 4.0 seems
>> off, the value should be higher than what we got for SSDs ...
>
> I'd guess that the *vast* majority of PG workloads these days run on networked
> block storage. For those typically the actual latency at the storage level is
> a rather small fraction of the overall IO latency, which is instead dominated
> by network and other related cost (like the indirection to which storage
> system to go to and crossing VM/host boundaries).  Because the majority of the
> IO latency is not affected by the storage latency, but by network lotency, the
> random IO/non-random IO difference will play less of a role.
>

True. I haven't tested that.

>
>
>> From a robustness point of view, wouldn't it be better to actually err
>> on the side of using a higher random_page_cost value? That'd mean we
>> flip to "more-sequential" scans sooner, with much "flatter" behavior.
>> That doesn't need to be a seqscan (which is about as flat as it gets),
>> but e.g. a bitmap scan - which probably silently "fixes" many cases
>> where the index scan gets costed too low.
>
> I think it's often the exact opposite - folks use a lower random page cost to
> *prevent* the planner from going to sequential (or bitmap heap) scans. In many
> real-world queries our selectivity estimates aren't great and the performance
> penalties of switching from an index scan to a sequential scan are really
> severe. As you note, this is heavily exascerbated by the hot data often being
> cached, but cold data not. Obviously the seqscan will process the cold data
> too.
>

I understand your point, but I'm not convinced random_page_cost is the
right tool to fix incorrect estimates.


regards

--
Tomas Vondra
Hi,

On 2025-10-06 20:20:15 +0200, Tomas Vondra wrote:
> On 10/6/25 17:14, Andres Freund wrote:
> > It also seems that due to the ordering inside the table (the order by
> > random()) during the table creation, you're going to see vastly different
> > number of page accesses.  While that's obviously something worth taking into
> > account for planning purposes, I don't think it'd be properly done by the
> > random_page_cost itself.
> >
>
> I don't understand your argument. Yes, the index scan does way more page
> accesses. Essentially, each index tuple reads a new page - and without a
> cache hit it's an I/O. With fillfactor=20 we have ~21 tuples per heap
> page, which means we have to read it ~21x. In other words, it reads as
> many pages as there are tuples.
>
> This is why my formulas divide the seqscan timing by number of pages,
> but indexscan is divided by number of tuples. And AFAIK the costing does
> exactly that too. So the random_page_cost doesn't need to do anything
> special, we estimate the number of page reads. (And at least in the case
> of random table it's pretty accurate.)

The thing is that your queries have vastly different timings *regardless* of
IO. Here's an example, fully cached:

postgres[2718803][1]=# EXPLAIN ANALYZE SELECT * FROM (SELECT * FROM test_table) OFFSET 100000000;

┌─────────────────────────────────────────────────────────────────────────────────────────────────────────────────────────────────┐
│                                                           QUERY PLAN
         │


├─────────────────────────────────────────────────────────────────────────────────────────────────────────────────────────────────┤
│ Limit  (cost=288096.16..288096.16 rows=1 width=41) (actual time=392.066..392.067 rows=0.00 loops=1)
         │

│   Buffers: shared hit=238096
         │

│   ->  Seq Scan on test_table  (cost=0.00..288096.16 rows=5000016 width=41) (actual time=0.032..269.031
rows=5000000.00loops=1) │

│         Buffers: shared hit=238096
         │

│ Planning Time: 0.087 ms
         │

│ Execution Time: 392.082 ms
         │


└─────────────────────────────────────────────────────────────────────────────────────────────────────────────────────────────────┘
(6 rows)

postgres[2759534][1]=# EXPLAIN (ANALYZE, BUFFERS) SELECT * FROM (SELECT ctid,* FROM test_table ORDER BY id) offset
100000000;

┌─────────────────────────────────────────────────────────────────────────────────────────────────────────────────────────────────────────────────────────────┐
│                                                                         QUERY PLAN
                                     │


├─────────────────────────────────────────────────────────────────────────────────────────────────────────────────────────────────────────────────────────────┤
│ Limit  (cost=1082201.28..1082201.28 rows=1 width=47) (actual time=3025.902..3025.903 rows=0.00 loops=1)
                                     │

│   Buffers: shared hit=5013643
                                     │

│   ->  Index Scan using test_table_id_idx on test_table  (cost=0.43..1082201.28 rows=5000016 width=47) (actual
time=0.035..2907.699rows=5000000.00 loops=1) │

│         Index Searches: 1
                                     │

│         Buffers: shared hit=5013643
                                     │

│ Planning Time: 0.131 ms
                                     │

│ Execution Time: 3025.930 ms
                                     │


└─────────────────────────────────────────────────────────────────────────────────────────────────────────────────────────────────────────────────────────────┘
(7 rows)

You have a ~8x difference in time, even without a single IO. A lot of that is
probably just the 20x difference in buffer accesses, but also the index path
just being a lot less predictable for the CPU.

I don't think random/seq_page_cost should account for difference in processing
costs that aren't actually related to it being a sequential or a random IO.


> > I think doing this kind of measurement via normal SQL query processing is
> > almost always going to have too much other influences. I'd measure using fio
> > or such instead.  It'd be interesting to see fio numbers for your disks...
> >
> > fio --directory /srv/fio --size=8GiB --name test --invalidate=0 --bs=$((8*1024)) --rw read --buffered 0
--time_based=1--runtime=5 --ioengine pvsync  --iodepth 1

> > vs --rw randread
> >
> > gives me 51k/11k for sequential/rand on one SSD and 92k/8.7k for another.
> >
>
> I can give it a try. But do we really want to strip "our" overhead with
> reading data?

I think the relevant differences in efficiency here don't come from something
inherent in postgres, it's that you're comparing completely different code
paths that have different IO independent costs.  You could totally measure it
in postgres, just not easily via "normal" SQL queries on tables/indexes.

Maybe we should have a function that measures some basic IO "factors" for each
tablespace and for pg_wal.


You can do a decent approximation of this via postgres too, by utilizing
pg_prewarm and/or pageinspect. E.g. something like

random IO:
SELECT count(*) FROM (SELECT pg_prewarm('test_table', first_block=>blkno, last_block=>blkno) FROM (SELECT
generate_series(0,(pg_relation_size('test_table') - 1) / 8192) AS blkno) ORDER BY random(), blkno);

and for sequential IO
SELECT count(*) FROM (SELECT pg_prewarm('test_table', first_block=>blkno, last_block=>blkno) FROM (SELECT
generate_series(0,(pg_relation_size('test_table') - 1) / 8192) AS blkno) ORDER BY blkno, random());

Time for sequential IO: 8066.720 ms
Time for random IO: 31623.122 ms

That's, almost eerily, close to 4x :)


FWIW, when cached, the difference in runtime between the two variants is
neglegible.


I guess it'd actually be better to use mode=>'read' (to avoid the constant
cost of the memcpy into the buffer pool from reducing the impact of sequential
vs random IO), in which case the difference in IO time increases to a more
substantial 9x for the uncached case.


> >> From a robustness point of view, wouldn't it be better to actually err
> >> on the side of using a higher random_page_cost value? That'd mean we
> >> flip to "more-sequential" scans sooner, with much "flatter" behavior.
> >> That doesn't need to be a seqscan (which is about as flat as it gets),
> >> but e.g. a bitmap scan - which probably silently "fixes" many cases
> >> where the index scan gets costed too low.
> >
> > I think it's often the exact opposite - folks use a lower random page cost to
> > *prevent* the planner from going to sequential (or bitmap heap) scans. In many
> > real-world queries our selectivity estimates aren't great and the performance
> > penalties of switching from an index scan to a sequential scan are really
> > severe. As you note, this is heavily exascerbated by the hot data often being
> > cached, but cold data not. Obviously the seqscan will process the cold data
> > too.
> >
>
> I understand your point, but I'm not convinced random_page_cost is the
> right tool to fix incorrect estimates.

I don't think it is - but I do think that if we just increased
random_page_cost substantially, without other accompanying changes, we'll
cause a lot of problems for folks, due to the above issue.

Greetings,

Andres Freund
On 10/6/25 23:27, Andres Freund wrote:
> Hi,
>
> On 2025-10-06 20:20:15 +0200, Tomas Vondra wrote:
>> On 10/6/25 17:14, Andres Freund wrote:
>>> It also seems that due to the ordering inside the table (the order by
>>> random()) during the table creation, you're going to see vastly different
>>> number of page accesses.  While that's obviously something worth taking into
>>> account for planning purposes, I don't think it'd be properly done by the
>>> random_page_cost itself.
>>>
>>
>> I don't understand your argument. Yes, the index scan does way more page
>> accesses. Essentially, each index tuple reads a new page - and without a
>> cache hit it's an I/O. With fillfactor=20 we have ~21 tuples per heap
>> page, which means we have to read it ~21x. In other words, it reads as
>> many pages as there are tuples.
>>
>> This is why my formulas divide the seqscan timing by number of pages,
>> but indexscan is divided by number of tuples. And AFAIK the costing does
>> exactly that too. So the random_page_cost doesn't need to do anything
>> special, we estimate the number of page reads. (And at least in the case
>> of random table it's pretty accurate.)
>
> The thing is that your queries have vastly different timings *regardless* of
> IO. Here's an example, fully cached:
>
> postgres[2718803][1]=# EXPLAIN ANALYZE SELECT * FROM (SELECT * FROM test_table) OFFSET 100000000;
>
┌─────────────────────────────────────────────────────────────────────────────────────────────────────────────────────────────────┐
> │                                                           QUERY PLAN
           │

>
├─────────────────────────────────────────────────────────────────────────────────────────────────────────────────────────────────┤
> │ Limit  (cost=288096.16..288096.16 rows=1 width=41) (actual time=392.066..392.067 rows=0.00 loops=1)
           │

> │   Buffers: shared hit=238096
           │

> │   ->  Seq Scan on test_table  (cost=0.00..288096.16 rows=5000016 width=41) (actual time=0.032..269.031
rows=5000000.00loops=1) │

> │         Buffers: shared hit=238096
           │

> │ Planning Time: 0.087 ms
           │

> │ Execution Time: 392.082 ms
           │

>
└─────────────────────────────────────────────────────────────────────────────────────────────────────────────────────────────────┘
> (6 rows)
>
> postgres[2759534][1]=# EXPLAIN (ANALYZE, BUFFERS) SELECT * FROM (SELECT ctid,* FROM test_table ORDER BY id) offset
100000000;
>
┌─────────────────────────────────────────────────────────────────────────────────────────────────────────────────────────────────────────────────────────────┐
> │                                                                         QUERY PLAN
                                       │

>
├─────────────────────────────────────────────────────────────────────────────────────────────────────────────────────────────────────────────────────────────┤
> │ Limit  (cost=1082201.28..1082201.28 rows=1 width=47) (actual time=3025.902..3025.903 rows=0.00 loops=1)
                                       │

> │   Buffers: shared hit=5013643
                                       │

> │   ->  Index Scan using test_table_id_idx on test_table  (cost=0.43..1082201.28 rows=5000016 width=47) (actual
time=0.035..2907.699rows=5000000.00 loops=1) │

> │         Index Searches: 1
                                       │

> │         Buffers: shared hit=5013643
                                       │

> │ Planning Time: 0.131 ms
                                       │

> │ Execution Time: 3025.930 ms
                                       │

>
└─────────────────────────────────────────────────────────────────────────────────────────────────────────────────────────────────────────────────────────────┘
> (7 rows)
>
> You have a ~8x difference in time, even without a single IO. A lot of that is
> probably just the 20x difference in buffer accesses, but also the index path
> just being a lot less predictable for the CPU.
>

Right. And that's why the timing is divided by *pages* for sequential
scans, and by *rows* for index scan. Which for the timings you show ends
up doing this:

     seqscan = 392 / 238096 = 0.0016
  indexescan = 3025 / 5M = 0.0006

So the per-page overhead with index scans is 1/3 of seqscans. AFAICS
this directly contradicts your argument that random_page_cost ends up
too high due to indexscans paying more per page.

I'd bet these costs to be pretty negligible compared to the cost of
actual I/O. So I don't see how would this explain the timing difference
with cold data.

> I don't think random/seq_page_cost should account for difference in processing
> costs that aren't actually related to it being a sequential or a random IO.
>

Perhaps. If it's not directly related to randomness of I/O, then maybe
random_page_cost is not the right cost parameter.

But it needs to be included *somewhere*, right? And it's per-page cost,
and per the experiments there's very clear difference between sequential
and random access. So why wouldn't random_page_cost be a good fit?

>
>>> I think doing this kind of measurement via normal SQL query processing is
>>> almost always going to have too much other influences. I'd measure using fio
>>> or such instead.  It'd be interesting to see fio numbers for your disks...
>>>
>>> fio --directory /srv/fio --size=8GiB --name test --invalidate=0 --bs=$((8*1024)) --rw read --buffered 0
--time_based=1--runtime=5 --ioengine pvsync  --iodepth 1
>>> vs --rw randread
>>>
>>> gives me 51k/11k for sequential/rand on one SSD and 92k/8.7k for another.
>>>
>>
>> I can give it a try. But do we really want to strip "our" overhead with
>> reading data?
>
> I think the relevant differences in efficiency here don't come from something
> inherent in postgres, it's that you're comparing completely different code
> paths that have different IO independent costs.  You could totally measure it
> in postgres, just not easily via "normal" SQL queries on tables/indexes.
>

If the two paths for seq/index access have so vastly different
overheads, why shouldn't that be reflected in the seq_page_cost and
random_page_cost?

But as shown above, the per-page timings IMHO contradict this.


> Maybe we should have a function that measures some basic IO "factors" for each
> tablespace and for pg_wal.
>

I'm not opposed to having functions like this.

>
> You can do a decent approximation of this via postgres too, by utilizing
> pg_prewarm and/or pageinspect. E.g. something like
>
> random IO:
> SELECT count(*) FROM (SELECT pg_prewarm('test_table', first_block=>blkno, last_block=>blkno) FROM (SELECT
generate_series(0,(pg_relation_size('test_table') - 1) / 8192) AS blkno) ORDER BY random(), blkno);

> and for sequential IO
> SELECT count(*) FROM (SELECT pg_prewarm('test_table', first_block=>blkno, last_block=>blkno) FROM (SELECT
generate_series(0,(pg_relation_size('test_table') - 1) / 8192) AS blkno) ORDER BY blkno, random());

>
> Time for sequential IO: 8066.720 ms
> Time for random IO: 31623.122 ms
>
> That's, almost eerily, close to 4x :)
>
>
> FWIW, when cached, the difference in runtime between the two variants is
> neglegible.
>

The problem is the sequential query forces the I/O blocks to be 8kB
each, instead of issuing larger requests (like a regular seqscan). On my
laptops that makes the seqscan 10x slower, so for regular seqscan the
ratio is way higher than 4x.

Maybe this the kind of overhead you claim should not be considered when
setting random_page_cost, but I'm not convinced of that.

>
> I guess it'd actually be better to use mode=>'read' (to avoid the constant
> cost of the memcpy into the buffer pool from reducing the impact of sequential
> vs random IO), in which case the difference in IO time increases to a more
> substantial 9x for the uncached case.
>
>
>>>> From a robustness point of view, wouldn't it be better to actually err
>>>> on the side of using a higher random_page_cost value? That'd mean we
>>>> flip to "more-sequential" scans sooner, with much "flatter" behavior.
>>>> That doesn't need to be a seqscan (which is about as flat as it gets),
>>>> but e.g. a bitmap scan - which probably silently "fixes" many cases
>>>> where the index scan gets costed too low.
>>>
>>> I think it's often the exact opposite - folks use a lower random page cost to
>>> *prevent* the planner from going to sequential (or bitmap heap) scans. In many
>>> real-world queries our selectivity estimates aren't great and the performance
>>> penalties of switching from an index scan to a sequential scan are really
>>> severe. As you note, this is heavily exascerbated by the hot data often being
>>> cached, but cold data not. Obviously the seqscan will process the cold data
>>> too.
>>>
>>
>> I understand your point, but I'm not convinced random_page_cost is the
>> right tool to fix incorrect estimates.
>
> I don't think it is - but I do think that if we just increased
> random_page_cost substantially, without other accompanying changes, we'll
> cause a lot of problems for folks, due to the above issue.
>

OK.


--
Tomas Vondra
Hi,

On 2025-10-07 00:52:26 +0200, Tomas Vondra wrote:
> On 10/6/25 23:27, Andres Freund wrote:
> > On 2025-10-06 20:20:15 +0200, Tomas Vondra wrote:
> >> On 10/6/25 17:14, Andres Freund wrote:
> >>> It also seems that due to the ordering inside the table (the order by
> >>> random()) during the table creation, you're going to see vastly different
> >>> number of page accesses.  While that's obviously something worth taking into
> >>> account for planning purposes, I don't think it'd be properly done by the
> >>> random_page_cost itself.
> >>>
> >>
> >> I don't understand your argument. Yes, the index scan does way more page
> >> accesses. Essentially, each index tuple reads a new page - and without a
> >> cache hit it's an I/O. With fillfactor=20 we have ~21 tuples per heap
> >> page, which means we have to read it ~21x. In other words, it reads as
> >> many pages as there are tuples.
> >>
> >> This is why my formulas divide the seqscan timing by number of pages,
> >> but indexscan is divided by number of tuples. And AFAIK the costing does
> >> exactly that too. So the random_page_cost doesn't need to do anything
> >> special, we estimate the number of page reads. (And at least in the case
> >> of random table it's pretty accurate.)
> >
> > The thing is that your queries have vastly different timings *regardless* of
> > IO. Here's an example, fully cached:
> >
> > postgres[2718803][1]=# EXPLAIN ANALYZE SELECT * FROM (SELECT * FROM test_table) OFFSET 100000000;
> >
┌─────────────────────────────────────────────────────────────────────────────────────────────────────────────────────────────────┐
> > │                                                           QUERY PLAN
             │

> >
├─────────────────────────────────────────────────────────────────────────────────────────────────────────────────────────────────┤
> > │ Limit  (cost=288096.16..288096.16 rows=1 width=41) (actual time=392.066..392.067 rows=0.00 loops=1)
             │

> > │   Buffers: shared hit=238096
             │

> > │   ->  Seq Scan on test_table  (cost=0.00..288096.16 rows=5000016 width=41) (actual time=0.032..269.031
rows=5000000.00loops=1) │

> > │         Buffers: shared hit=238096
             │

> > │ Planning Time: 0.087 ms
             │

> > │ Execution Time: 392.082 ms
             │

> >
└─────────────────────────────────────────────────────────────────────────────────────────────────────────────────────────────────┘
> > (6 rows)
> >
> > postgres[2759534][1]=# EXPLAIN (ANALYZE, BUFFERS) SELECT * FROM (SELECT ctid,* FROM test_table ORDER BY id) offset
100000000;
> >
┌─────────────────────────────────────────────────────────────────────────────────────────────────────────────────────────────────────────────────────────────┐
> > │                                                                         QUERY PLAN
                                         │

> >
├─────────────────────────────────────────────────────────────────────────────────────────────────────────────────────────────────────────────────────────────┤
> > │ Limit  (cost=1082201.28..1082201.28 rows=1 width=47) (actual time=3025.902..3025.903 rows=0.00 loops=1)
                                         │

> > │   Buffers: shared hit=5013643
                                         │

> > │   ->  Index Scan using test_table_id_idx on test_table  (cost=0.43..1082201.28 rows=5000016 width=47) (actual
time=0.035..2907.699rows=5000000.00 loops=1) │

> > │         Index Searches: 1
                                         │

> > │         Buffers: shared hit=5013643
                                         │

> > │ Planning Time: 0.131 ms
                                         │

> > │ Execution Time: 3025.930 ms
                                         │

> >
└─────────────────────────────────────────────────────────────────────────────────────────────────────────────────────────────────────────────────────────────┘
> > (7 rows)
> >
> > You have a ~8x difference in time, even without a single IO. A lot of that is
> > probably just the 20x difference in buffer accesses, but also the index path
> > just being a lot less predictable for the CPU.
> >
>
> Right. And that's why the timing is divided by *pages* for sequential
> scans, and by *rows* for index scan. Which for the timings you show ends
> up doing this:
>
>      seqscan = 392 / 238096 = 0.0016
>   indexescan = 3025 / 5M = 0.0006
>
> So the per-page overhead with index scans is 1/3 of seqscans. AFAICS
> this directly contradicts your argument that random_page_cost ends up
> too high due to indexscans paying more per page.

I don't think that's contradicting it. The seqscan is doing ~21 tuples per
page, the indexscan ~1. There is more work happening for each sequentially
scanned page.  And of course the number of pages pinned isn't the only factor.

Just look at a profile of the index query in the cached case:

-   99.98%     0.00%  postgres  postgres           [.] standard_ExecutorRun
     standard_ExecutorRun
   - ExecProcNodeInstr
      - 99.85% ExecLimit
         - 99.26% ExecProcNodeInstr
            - 98.06% ExecScan
               - 92.13% IndexNext
                  - 91.07% index_getnext_slot
                     - 85.55% heapam_index_fetch_tuple
                        - 47.69% ReleaseAndReadBuffer
                           + 42.17% StartReadBuffer
                             1.78% hash_bytes
                             1.63% UnpinBufferNoOwner
                          15.94% heap_hot_search_buffer
                          13.22% heap_page_prune_opt
                        + 3.70% ExecStoreBufferHeapTuple
                          2.15% LWLockAcquire
                          1.33% LWLockRelease
                     - 3.96% index_getnext_tid
                        + 3.44% btgettuple
               + 4.50% ExecInterpExpr

and compare that with the seqscan:

-   99.93%     0.00%  postgres  postgres           [.] standard_ExecutorRun
     standard_ExecutorRun
   - ExecProcNodeInstr
      - 98.64% ExecLimit
         - 93.10% ExecProcNodeInstr
            - 81.23% ExecSeqScan
               - 70.30% heap_getnextslot
                  - 56.28% heapgettup_pagemode
                     - 30.99% read_stream_next_buffer
                        + 29.16% StartReadBuffer
                     - 10.99% heap_prepare_pagescan
                          7.13% heap_page_prune_opt
                          1.08% LWLockAcquire
                       1.42% LWLockRelease
                       1.13% ReleaseBuffer
                  - 8.28% ExecStoreBufferHeapTuple
                       2.00% UnpinBufferNoOwner
                 2.26% MemoryContextReset
                 1.31% heapgettup_pagemode
                 1.27% ExecStoreBufferHeapTuple
              3.16% InstrStopNode
              2.82% InstrStartNode
              1.37% heap_getnextslot
           1.00% InstrStartNode
        1.30% ExecProcNodeInstr


> I'd bet these costs to be pretty negligible compared to the cost of
> actual I/O. So I don't see how would this explain the timing difference
> with cold data.

Of course there's an increased cost of random IO, I never doubted that! I'm
just saying that your method of measurement seems to over-estimate it.


> > I don't think random/seq_page_cost should account for difference in processing
> > costs that aren't actually related to it being a sequential or a random IO.
> >
>
> Perhaps. If it's not directly related to randomness of I/O, then maybe
> random_page_cost is not the right cost parameter.
>
> But it needs to be included *somewhere*, right? And it's per-page cost,
> and per the experiments there's very clear difference between sequential
> and random access. So why wouldn't random_page_cost be a good fit?

We are already accounting for the increased CPU cost for index scans etc to
some degree, via cpu_* costs. If we under-estimate the CPU cost of index scans
we should fix that, regardless of random_page_cost, as a well correlated index
scan *still* is a lot more expensive than a sequential scan.


> >>> I think doing this kind of measurement via normal SQL query processing is
> >>> almost always going to have too much other influences. I'd measure using fio
> >>> or such instead.  It'd be interesting to see fio numbers for your disks...
> >>>
> >>> fio --directory /srv/fio --size=8GiB --name test --invalidate=0 --bs=$((8*1024)) --rw read --buffered 0
--time_based=1--runtime=5 --ioengine pvsync  --iodepth 1

> >>> vs --rw randread
> >>>
> >>> gives me 51k/11k for sequential/rand on one SSD and 92k/8.7k for another.
> >>>
> >>
> >> I can give it a try. But do we really want to strip "our" overhead with
> >> reading data?
> >
> > I think the relevant differences in efficiency here don't come from something
> > inherent in postgres, it's that you're comparing completely different code
> > paths that have different IO independent costs.  You could totally measure it
> > in postgres, just not easily via "normal" SQL queries on tables/indexes.
> >
>
> If the two paths for seq/index access have so vastly different
> overheads, why shouldn't that be reflected in the seq_page_cost and
> random_page_cost?

No, because a) random_page_cost is applied to other things than index access
b) some index scans are not dominated by random accesses.


> > You can do a decent approximation of this via postgres too, by utilizing
> > pg_prewarm and/or pageinspect. E.g. something like
> >
> > random IO:
> > SELECT count(*) FROM (SELECT pg_prewarm('test_table', first_block=>blkno, last_block=>blkno) FROM (SELECT
generate_series(0,(pg_relation_size('test_table') - 1) / 8192) AS blkno) ORDER BY random(), blkno);

> > and for sequential IO
> > SELECT count(*) FROM (SELECT pg_prewarm('test_table', first_block=>blkno, last_block=>blkno) FROM (SELECT
generate_series(0,(pg_relation_size('test_table') - 1) / 8192) AS blkno) ORDER BY blkno, random());

> >
> > Time for sequential IO: 8066.720 ms
> > Time for random IO: 31623.122 ms
> >
> > That's, almost eerily, close to 4x :)
> >
> >
> > FWIW, when cached, the difference in runtime between the two variants is
> > neglegible.
> >
>
> The problem is the sequential query forces the I/O blocks to be 8kB
> each, instead of issuing larger requests (like a regular seqscan). On my
> laptops that makes the seqscan 10x slower, so for regular seqscan the
> ratio is way higher than 4x.
>
> Maybe this the kind of overhead you claim should not be considered when
> setting random_page_cost, but I'm not convinced of that.

A correlated index scan today will not do IO combining, despite being
accounted as seq_page_cost. So just doing individual 8kB IOs actually seems to
be the appropriate comparison.  Even with table fetches in index scans doing
IO combining as part by your work, the reads of the index data itself won't be
combined. And I'm sure other things won't be either.


I'd be on-board with trying to improve the cost accounting to take IO
combining into account in some form. I don't quite know how, off-the-cuff: The
advantage of combining seems to quickly drop off after a few pages, but by how
much and where exactly seems to very heavily depend on the specific
hardware. Just dividing the number of sequential accesses by io_combine_limit
seems like it'd be over-estimating the effect substantially.


I do wonder if we ought to split off the CPU cost associated with both
sequential and random_page_cost into a cpu_page_cost or such. Right now we
IIRC largely disregard the cost of accessing some pages repeatedly, just
because we estimate that to not incur IO costs. But of course a plan that has
fewer pages accesses while otherwise doing the same amount of work will be
faster, the profiles further up clearly show that we spend a fair amount of
time in buffer handling even when fully cached.

Greetings,

Andres Freund
On 10/7/25 01:56, Andres Freund wrote:
> Hi,
>
> On 2025-10-07 00:52:26 +0200, Tomas Vondra wrote:
>> On 10/6/25 23:27, Andres Freund wrote:
>>> On 2025-10-06 20:20:15 +0200, Tomas Vondra wrote:
>>>> On 10/6/25 17:14, Andres Freund wrote:
>>>>> It also seems that due to the ordering inside the table (the order by
>>>>> random()) during the table creation, you're going to see vastly different
>>>>> number of page accesses.  While that's obviously something worth taking into
>>>>> account for planning purposes, I don't think it'd be properly done by the
>>>>> random_page_cost itself.
>>>>>
>>>>
>>>> I don't understand your argument. Yes, the index scan does way more page
>>>> accesses. Essentially, each index tuple reads a new page - and without a
>>>> cache hit it's an I/O. With fillfactor=20 we have ~21 tuples per heap
>>>> page, which means we have to read it ~21x. In other words, it reads as
>>>> many pages as there are tuples.
>>>>
>>>> This is why my formulas divide the seqscan timing by number of pages,
>>>> but indexscan is divided by number of tuples. And AFAIK the costing does
>>>> exactly that too. So the random_page_cost doesn't need to do anything
>>>> special, we estimate the number of page reads. (And at least in the case
>>>> of random table it's pretty accurate.)
>>>
>>> The thing is that your queries have vastly different timings *regardless* of
>>> IO. Here's an example, fully cached:
>>>
>>> postgres[2718803][1]=# EXPLAIN ANALYZE SELECT * FROM (SELECT * FROM test_table) OFFSET 100000000;
>>>
┌─────────────────────────────────────────────────────────────────────────────────────────────────────────────────────────────────┐
>>> │                                                           QUERY PLAN
             │

>>>
├─────────────────────────────────────────────────────────────────────────────────────────────────────────────────────────────────┤
>>> │ Limit  (cost=288096.16..288096.16 rows=1 width=41) (actual time=392.066..392.067 rows=0.00 loops=1)
             │

>>> │   Buffers: shared hit=238096
             │

>>> │   ->  Seq Scan on test_table  (cost=0.00..288096.16 rows=5000016 width=41) (actual time=0.032..269.031
rows=5000000.00loops=1) │

>>> │         Buffers: shared hit=238096
             │

>>> │ Planning Time: 0.087 ms
             │

>>> │ Execution Time: 392.082 ms
             │

>>>
└─────────────────────────────────────────────────────────────────────────────────────────────────────────────────────────────────┘
>>> (6 rows)
>>>
>>> postgres[2759534][1]=# EXPLAIN (ANALYZE, BUFFERS) SELECT * FROM (SELECT ctid,* FROM test_table ORDER BY id) offset
100000000;
>>>
┌─────────────────────────────────────────────────────────────────────────────────────────────────────────────────────────────────────────────────────────────┐
>>> │                                                                         QUERY PLAN
                                         │

>>>
├─────────────────────────────────────────────────────────────────────────────────────────────────────────────────────────────────────────────────────────────┤
>>> │ Limit  (cost=1082201.28..1082201.28 rows=1 width=47) (actual time=3025.902..3025.903 rows=0.00 loops=1)
                                         │

>>> │   Buffers: shared hit=5013643
                                         │

>>> │   ->  Index Scan using test_table_id_idx on test_table  (cost=0.43..1082201.28 rows=5000016 width=47) (actual
time=0.035..2907.699rows=5000000.00 loops=1) │

>>> │         Index Searches: 1
                                         │

>>> │         Buffers: shared hit=5013643
                                         │

>>> │ Planning Time: 0.131 ms
                                         │

>>> │ Execution Time: 3025.930 ms
                                         │

>>>
└─────────────────────────────────────────────────────────────────────────────────────────────────────────────────────────────────────────────────────────────┘
>>> (7 rows)
>>>
>>> You have a ~8x difference in time, even without a single IO. A lot of that is
>>> probably just the 20x difference in buffer accesses, but also the index path
>>> just being a lot less predictable for the CPU.
>>>
>>
>> Right. And that's why the timing is divided by *pages* for sequential
>> scans, and by *rows* for index scan. Which for the timings you show ends
>> up doing this:
>>
>>      seqscan = 392 / 238096 = 0.0016
>>   indexescan = 3025 / 5M = 0.0006
>>
>> So the per-page overhead with index scans is 1/3 of seqscans. AFAICS
>> this directly contradicts your argument that random_page_cost ends up
>> too high due to indexscans paying more per page.
>
> I don't think that's contradicting it. The seqscan is doing ~21 tuples per
> page, the indexscan ~1. There is more work happening for each sequentially
> scanned page.  And of course the number of pages pinned isn't the only factor.
>
> Just look at a profile of the index query in the cached case:
>
> -   99.98%     0.00%  postgres  postgres           [.] standard_ExecutorRun
>      standard_ExecutorRun
>    - ExecProcNodeInstr
>       - 99.85% ExecLimit
>          - 99.26% ExecProcNodeInstr
>             - 98.06% ExecScan
>                - 92.13% IndexNext
>                   - 91.07% index_getnext_slot
>                      - 85.55% heapam_index_fetch_tuple
>                         - 47.69% ReleaseAndReadBuffer
>                            + 42.17% StartReadBuffer
>                              1.78% hash_bytes
>                              1.63% UnpinBufferNoOwner
>                           15.94% heap_hot_search_buffer
>                           13.22% heap_page_prune_opt
>                         + 3.70% ExecStoreBufferHeapTuple
>                           2.15% LWLockAcquire
>                           1.33% LWLockRelease
>                      - 3.96% index_getnext_tid
>                         + 3.44% btgettuple
>                + 4.50% ExecInterpExpr
>
> and compare that with the seqscan:
>
> -   99.93%     0.00%  postgres  postgres           [.] standard_ExecutorRun
>      standard_ExecutorRun
>    - ExecProcNodeInstr
>       - 98.64% ExecLimit
>          - 93.10% ExecProcNodeInstr
>             - 81.23% ExecSeqScan
>                - 70.30% heap_getnextslot
>                   - 56.28% heapgettup_pagemode
>                      - 30.99% read_stream_next_buffer
>                         + 29.16% StartReadBuffer
>                      - 10.99% heap_prepare_pagescan
>                           7.13% heap_page_prune_opt
>                           1.08% LWLockAcquire
>                        1.42% LWLockRelease
>                        1.13% ReleaseBuffer
>                   - 8.28% ExecStoreBufferHeapTuple
>                        2.00% UnpinBufferNoOwner
>                  2.26% MemoryContextReset
>                  1.31% heapgettup_pagemode
>                  1.27% ExecStoreBufferHeapTuple
>               3.16% InstrStopNode
>               2.82% InstrStartNode
>               1.37% heap_getnextslot
>            1.00% InstrStartNode
>         1.30% ExecProcNodeInstr
>
>

That's exactly my point. The index scan is doing *less* work per page.
It's accessing more pages (21x in total), but the per-page cost is
significantly lower.

>
>> I'd bet these costs to be pretty negligible compared to the cost of
>> actual I/O. So I don't see how would this explain the timing difference
>> with cold data.
>
> Of course there's an increased cost of random IO, I never doubted that! I'm
> just saying that your method of measurement seems to over-estimate it.
>

If the per-page overhead is lower for random I/O (0.0006 vs. 0.0016),
why would it lead to over-estimation? AFAIK it leads exactly to the
opposite thing.

Let's try to eliminate this overhead from the calculations. I measured
sequential and index scan on a 10M table, with everything cached (in
shared buffers). I got 260ms for sequential, 5,200ms for index. The 50M
table would need ~13,000ms and 260,000ms. Let's assume all of this is
the "unfair" overhead, and let's subtract that from the timings, leaving
just the "clean" I/O costs. That gives us this (for the NVMe RAID0):

                seqscan (s)      index scan (s)  random_page_cost
 -----------------------------------------------------------------
  NVMe/RAID0             11               25202             103.4

Which is about twice of what it used to be:

                seqscan (s)      index scan (s)  random_page_cost
 -----------------------------------------------------------------
  NVMe/RAID0             24               25462             49.3

So, what am I missing?

>
>>> I don't think random/seq_page_cost should account for difference in processing
>>> costs that aren't actually related to it being a sequential or a random IO.
>>>
>>
>> Perhaps. If it's not directly related to randomness of I/O, then maybe
>> random_page_cost is not the right cost parameter.
>>
>> But it needs to be included *somewhere*, right? And it's per-page cost,
>> and per the experiments there's very clear difference between sequential
>> and random access. So why wouldn't random_page_cost be a good fit?
>
> We are already accounting for the increased CPU cost for index scans etc to
> some degree, via cpu_* costs. If we under-estimate the CPU cost of index scans
> we should fix that, regardless of random_page_cost, as a well correlated index
> scan *still* is a lot more expensive than a sequential scan.
>

Yeah, that makes sense. If this really is a CPU cost, then it should be
reflected in some cpu_ parameter. But which one? I don't think we have a
per-page CPU cost?

>
>>>>> I think doing this kind of measurement via normal SQL query processing is
>>>>> almost always going to have too much other influences. I'd measure using fio
>>>>> or such instead.  It'd be interesting to see fio numbers for your disks...
>>>>>
>>>>> fio --directory /srv/fio --size=8GiB --name test --invalidate=0 --bs=$((8*1024)) --rw read --buffered 0
--time_based=1--runtime=5 --ioengine pvsync  --iodepth 1

>>>>> vs --rw randread
>>>>>
>>>>> gives me 51k/11k for sequential/rand on one SSD and 92k/8.7k for another.
>>>>>
>>>>
>>>> I can give it a try. But do we really want to strip "our" overhead with
>>>> reading data?

I got this on the two RAID devices (NVMe and SATA):

NVMe: 83.5k / 15.8k
SATA: 28.6k /  8.5k

So the same ballpark / ratio as your test. Not surprising, really.

>>>
>>> I think the relevant differences in efficiency here don't come from something
>>> inherent in postgres, it's that you're comparing completely different code
>>> paths that have different IO independent costs.  You could totally measure it
>>> in postgres, just not easily via "normal" SQL queries on tables/indexes.
>>>
>>
>> If the two paths for seq/index access have so vastly different
>> overheads, why shouldn't that be reflected in the seq_page_cost and
>> random_page_cost?
>
> No, because a) random_page_cost is applied to other things than index access
> b) some index scans are not dominated by random accesses.
>
>
>
>>> You can do a decent approximation of this via postgres too, by utilizing
>>> pg_prewarm and/or pageinspect. E.g. something like
>>>
>>> random IO:
>>> SELECT count(*) FROM (SELECT pg_prewarm('test_table', first_block=>blkno, last_block=>blkno) FROM (SELECT
generate_series(0,(pg_relation_size('test_table') - 1) / 8192) AS blkno) ORDER BY random(), blkno);

>>> and for sequential IO
>>> SELECT count(*) FROM (SELECT pg_prewarm('test_table', first_block=>blkno, last_block=>blkno) FROM (SELECT
generate_series(0,(pg_relation_size('test_table') - 1) / 8192) AS blkno) ORDER BY blkno, random());

>>>
>>> Time for sequential IO: 8066.720 ms
>>> Time for random IO: 31623.122 ms
>>>
>>> That's, almost eerily, close to 4x :)
>>>
>>>
>>> FWIW, when cached, the difference in runtime between the two variants is
>>> neglegible.
>>>
>>
>> The problem is the sequential query forces the I/O blocks to be 8kB
>> each, instead of issuing larger requests (like a regular seqscan). On my
>> laptops that makes the seqscan 10x slower, so for regular seqscan the
>> ratio is way higher than 4x.
>>
>> Maybe this the kind of overhead you claim should not be considered when
>> setting random_page_cost, but I'm not convinced of that.
>
> A correlated index scan today will not do IO combining, despite being
> accounted as seq_page_cost. So just doing individual 8kB IOs actually seems to
> be the appropriate comparison.  Even with table fetches in index scans doing
> IO combining as part by your work, the reads of the index data itself won't be
> combined. And I'm sure other things won't be either.
>

But that's the point. If the sequential reads do I/O combining and index
scans don't (and I don't think that will change anytime soon), then that
makes sequential I/O much more efficient / cheaper. And we better
reflect that in the cost somehow. Maybe increasing the random_page_cost
is not the right/best solution? That's possible.

>
> I'd be on-board with trying to improve the cost accounting to take IO
> combining into account in some form. I don't quite know how, off-the-cuff: The
> advantage of combining seems to quickly drop off after a few pages, but by how
> much and where exactly seems to very heavily depend on the specific
> hardware. Just dividing the number of sequential accesses by io_combine_limit
> seems like it'd be over-estimating the effect substantially.
>
>
> I do wonder if we ought to split off the CPU cost associated with both
> sequential and random_page_cost into a cpu_page_cost or such. Right now we
> IIRC largely disregard the cost of accessing some pages repeatedly, just
> because we estimate that to not incur IO costs. But of course a plan that has
> fewer pages accesses while otherwise doing the same amount of work will be
> faster, the profiles further up clearly show that we spend a fair amount of
> time in buffer handling even when fully cached.
>

Seems reasonable.


regards

--
Tomas Vondra
On 10/7/25 14:08, Tomas Vondra wrote:
> ...
>>>>>> I think doing this kind of measurement via normal SQL query processing is
>>>>>> almost always going to have too much other influences. I'd measure using fio
>>>>>> or such instead.  It'd be interesting to see fio numbers for your disks...
>>>>>>
>>>>>> fio --directory /srv/fio --size=8GiB --name test --invalidate=0 --bs=$((8*1024)) --rw read --buffered 0
--time_based=1--runtime=5 --ioengine pvsync  --iodepth 1

>>>>>> vs --rw randread
>>>>>>
>>>>>> gives me 51k/11k for sequential/rand on one SSD and 92k/8.7k for another.
>>>>>>
>>>>>
>>>>> I can give it a try. But do we really want to strip "our" overhead with
>>>>> reading data?
>
> I got this on the two RAID devices (NVMe and SATA):
>
> NVMe: 83.5k / 15.8k
> SATA: 28.6k /  8.5k
>
> So the same ballpark / ratio as your test. Not surprising, really.
>

FWIW I do see about this number in iostat. There's a 500M test running
right now, and iostat reports this:

  Device      r/s     rkB/s  ...  rareq-sz  ...  %util
  md1    15273.10 143512.80  ...      9.40  ...  93.64

So it's not like we're issuing far fewer I/Os than the SSD can handle.


regards

--
Tomas Vondra
Hi,

On 2025-10-07 14:08:27 +0200, Tomas Vondra wrote:
> On 10/7/25 01:56, Andres Freund wrote:
> > A correlated index scan today will not do IO combining, despite being
> > accounted as seq_page_cost. So just doing individual 8kB IOs actually seems to
> > be the appropriate comparison.  Even with table fetches in index scans doing
> > IO combining as part by your work, the reads of the index data itself won't be
> > combined. And I'm sure other things won't be either.
> >
>
> But that's the point. If the sequential reads do I/O combining and index
> scans don't (and I don't think that will change anytime soon), then that
> makes sequential I/O much more efficient / cheaper. And we better
> reflect that in the cost somehow. Maybe increasing the random_page_cost
> is not the right/best solution? That's possible.

The table fetch portion of an index scan uses seq_page_cost too, with the
degree of it being used determined by the correlation (c.f. cost_index()).
Given that we use random page cost and sequential page cost both for index
scan and non-index scan related costs, I just don't see how it can make sense
to include index related overheads in random_page_cost but not seq_page_cost.

Greetings,

Andres Freund
On 10/6/25 07:26, David Rowley wrote:
> On Mon, 6 Oct 2025 at 13:59, Tomas Vondra <tomas@vondra.me> wrote:
>> Unless I did some silly mistakes, these results suggest the current 4.0
>> value is a bit too low, and something like ~20 would be better even on
>> SSDs. This is not the first time it was suggested a higher default might
>> be better - see this 2008 post [3]. Of course, that's from before SSDs
>> became a thing, it's about evolution in hard disks and our code.
>
> Thanks for going to all that effort to calculate that. It was an
> interesting read and also very interesting that you found the opposite
> to the typical advice that people typically provide.
>
> I don't have any HDDs around to run the script to check the results. I
> do have a machine with 2 SSDs, one PCIe3 and one PCIe4. I'll see if I
> can get you some results from that.
>
> It would be interesting to see how your calculated values fare when
> given a more realistic workload. Say TPC-H or Join Order Benchmark.  I
> recall that TPCH has both a power and a throughput result, one to test
> concurrency and one for single query throughput. I wonder if the same
> random_page_cost setting would be preferred in both scenarios. I can
> imagine that it might be more useful to have more index pages in
> shared buffers when there's strong contention for buffers. It would be
> interesting to run some pg_buffercache queries with GROUP BY relkind
> to see how much of an effect changing random_page_cost has on the
> number of buffers per relkind after each query.
>

Here's a couple results from TPC-H on scales 50 and 200 (from two
different systems).

I ran the test with/without parallel query, with buffered and direct
I/O. And I ran each query with random_page_cost set to 4.0, 1.5 and 20,
to get some comparison. Each query was executed twice - once from cold
state (nothing in RAM), then from warmed state (from the first execution).

Attached are PDFs with more complete results, and charts for "cold" runs
without parallel query, with buffered I/O. The charts are comparing the
timing to random_page_cost = 4.0, used as a baseline.

Note: The scale 200 results are incomplete - I only have 19 queries for
buffered/serial setup now.

In all the runs, setting random_page_cost = 1.5 causes significant
regressions for a number of queries. This is more visible on scale 50,
with ~5 clear regressions (and maybe one improvement for Q21). On scale
200 there are only 2 regressions of similar scale.

The random_page_cost = 20 doesn't have such regressions, and a couple
queries get much faster (Q8 or Q19 or scale 50, and Q9 on scale 200).

There are some regressions, either with parallel query enabled (not sure
why), or when the warm run doesn't get faster (while the other rpc
values seem to benefit from caching more).

I don't have time for thorough analysis of the plans, but I did check a
couple queries with significant changes in timing, and the estimates
seem very accurate. So it doesn't seem to be a matter of luck, with bad
estimates and "bogus" rpc value compensating for that.


regards

--
Tomas Vondra
Вложения
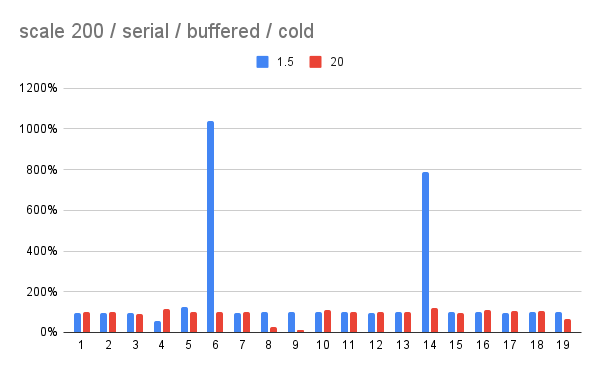
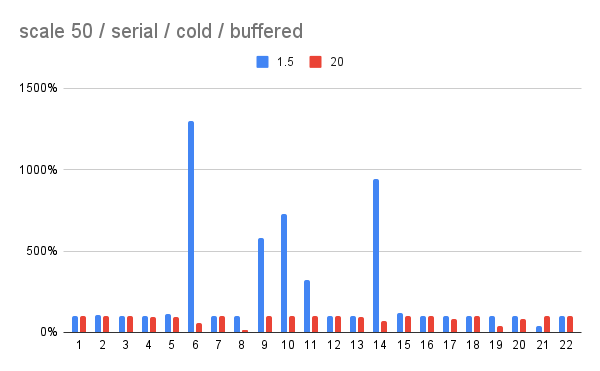
Hi,

On 2025-10-07 16:23:36 +0200, Tomas Vondra wrote:
> On 10/7/25 14:08, Tomas Vondra wrote:
> > ...
> >>>>>> I think doing this kind of measurement via normal SQL query processing is
> >>>>>> almost always going to have too much other influences. I'd measure using fio
> >>>>>> or such instead.  It'd be interesting to see fio numbers for your disks...
> >>>>>>
> >>>>>> fio --directory /srv/fio --size=8GiB --name test --invalidate=0 --bs=$((8*1024)) --rw read --buffered 0
--time_based=1--runtime=5 --ioengine pvsync  --iodepth 1

> >>>>>> vs --rw randread
> >>>>>>
> >>>>>> gives me 51k/11k for sequential/rand on one SSD and 92k/8.7k for another.
> >>>>>>
> >>>>>
> >>>>> I can give it a try. But do we really want to strip "our" overhead with
> >>>>> reading data?
> >
> > I got this on the two RAID devices (NVMe and SATA):
> >
> > NVMe: 83.5k / 15.8k
> > SATA: 28.6k /  8.5k
> >
> > So the same ballpark / ratio as your test. Not surprising, really.
> >
>
> FWIW I do see about this number in iostat. There's a 500M test running
> right now, and iostat reports this:
>
>   Device      r/s     rkB/s  ...  rareq-sz  ...  %util
>   md1    15273.10 143512.80  ...      9.40  ...  93.64
>
> So it's not like we're issuing far fewer I/Os than the SSD can handle.

Not really related to this thread:

IME iostat's utilization is pretty much useless for anything other than "is
something happening at all", and even that is not reliable. I don't know the
full reason for it, but I long learned to just discount it.

I ran
fio --directory /srv/fio --size=8GiB --name test --invalidate=0 --bs=$((8*1024)) --rw read --buffered 0 --time_based=1
--runtime=100--ioengine pvsync  --iodepth 1 --rate_iops=40000


a few times in a row, while watching iostat. Sometimes utilization is 100%,
sometimes it's 0.2%.  Whereas if I run without rate limiting, utilization
never goes above 71%, despite doing more iops.


And then gets completely useless if you use a deeper iodepth, because there's
just not a good way to compute something like a utilization number once
you take parallel IO processing into account.

fio --directory /srv/fio --size=8GiB --name test --invalidate=0 --bs=$((8*1024)) --rw read --buffered 0 --time_based=1
--runtime=100--ioengine io_uring  --iodepth 1 --rw randread

iodepth        util    iops
1               94%     9.3k
2               99.6%   18.4k
4               100%    35.9k
8               100%    68.0k
16              100%    123k

Greetings,

Andres Freund
On Mon, Oct 6, 2025 at 1:06 PM Andres Freund <andres@anarazel.de> wrote:
>
> Hi,
>
> On 2025-10-06 12:57:20 -0400, Bruce Momjian wrote:
> > On Mon, Oct  6, 2025 at 11:14:13AM -0400, Andres Freund wrote:
> > > > It obviously contradicts the advice to set the value closer to 1.0. But
> > > > why is that? SSDs are certainly better with random I/0, even if the I/O
> > > > is not concurrent and the SSD is not fully utilized. So the 4.0 seems
> > > > off, the value should be higher than what we got for SSDs ...
> > >
> > > I'd guess that the *vast* majority of PG workloads these days run on networked
> > > block storage. For those typically the actual latency at the storage level is
> > > a rather small fraction of the overall IO latency, which is instead dominated
> > > by network and other related cost (like the indirection to which storage
> > > system to go to and crossing VM/host boundaries).  Because the majority of the
> > > IO latency is not affected by the storage latency, but by network lotency, the
> > > random IO/non-random IO difference will play less of a role.
> >
> > Yes, the last time we discussed changing the default random page cost,
> > September 2024, the argument was that while SSDs should be < 4, cloud
> > storage might be > 4, so 4 was still a good value:
> >
> >
https://www.postgresql.org/message-id/flat/877caxaxt6.fsf%40wibble.ilmari.org#8a10b7b8cf05410291d076f8def58c29
>
> I think it's exactly the other way round. The difference between random and
> sequential IO is *smaller* on cloud storage than on local storage, due to
> network IO being the biggest component of IO latency on cloud storage - and
> network latency is the same for random and sequential IO.
>

One of the interesting things about Tomas' work, if you look at the
problem from the other end, is that this exposes a thought-line that I
suspect is almost completely untested "in the field", specifically the
idea of *raising* random_page_cost as a means to improve performance.
Given we have literal decades of anecdata that says lowering it to
something closer to 1 is the right answer, one could make the argument
that perhaps the right default is actually 1, and the recommended
tuning advice would simply become to raise it depending on specifics
of your workload (with some help in explaining how larger numbers are
likely to affect planning). As a default, we "know" (based on
anecdata) that this would improve performance for some large number of
workloads out of the box, and to the degree that others are not
helped, everyone would now be tuning in the same direction. I'll grant
you that this is a rather counterintuitive suggestion.


Robert Treat
https://xzilla.net
On 10/7/25 17:32, Andres Freund wrote:
> Hi,
>
> On 2025-10-07 16:23:36 +0200, Tomas Vondra wrote:
>> On 10/7/25 14:08, Tomas Vondra wrote:
>>> ...
>>>>>>>> I think doing this kind of measurement via normal SQL query processing is
>>>>>>>> almost always going to have too much other influences. I'd measure using fio
>>>>>>>> or such instead.  It'd be interesting to see fio numbers for your disks...
>>>>>>>>
>>>>>>>> fio --directory /srv/fio --size=8GiB --name test --invalidate=0 --bs=$((8*1024)) --rw read --buffered 0
--time_based=1--runtime=5 --ioengine pvsync  --iodepth 1

>>>>>>>> vs --rw randread
>>>>>>>>
>>>>>>>> gives me 51k/11k for sequential/rand on one SSD and 92k/8.7k for another.
>>>>>>>>
>>>>>>>
>>>>>>> I can give it a try. But do we really want to strip "our" overhead with
>>>>>>> reading data?
>>>
>>> I got this on the two RAID devices (NVMe and SATA):
>>>
>>> NVMe: 83.5k / 15.8k
>>> SATA: 28.6k /  8.5k
>>>
>>> So the same ballpark / ratio as your test. Not surprising, really.
>>>
>>
>> FWIW I do see about this number in iostat. There's a 500M test running
>> right now, and iostat reports this:
>>
>>   Device      r/s     rkB/s  ...  rareq-sz  ...  %util
>>   md1    15273.10 143512.80  ...      9.40  ...  93.64
>>
>> So it's not like we're issuing far fewer I/Os than the SSD can handle.
>
> Not really related to this thread:
>
> IME iostat's utilization is pretty much useless for anything other than "is
> something happening at all", and even that is not reliable. I don't know the
> full reason for it, but I long learned to just discount it.
>
> I ran
> fio --directory /srv/fio --size=8GiB --name test --invalidate=0 --bs=$((8*1024)) --rw read --buffered 0
--time_based=1--runtime=100 --ioengine pvsync  --iodepth 1 --rate_iops=40000

>
> a few times in a row, while watching iostat. Sometimes utilization is 100%,
> sometimes it's 0.2%.  Whereas if I run without rate limiting, utilization
> never goes above 71%, despite doing more iops.
>
>
> And then gets completely useless if you use a deeper iodepth, because there's
> just not a good way to compute something like a utilization number once
> you take parallel IO processing into account.
>
> fio --directory /srv/fio --size=8GiB --name test --invalidate=0 --bs=$((8*1024)) --rw read --buffered 0
--time_based=1--runtime=100 --ioengine io_uring  --iodepth 1 --rw randread

> iodepth        util    iops
> 1               94%     9.3k
> 2               99.6%   18.4k
> 4               100%    35.9k
> 8               100%    68.0k
> 16              100%    123k
>

Yeah. Interpreting %util is hard, the value on it's own is borderline
useless. I only included it because it's the last thing on the line.

AFAIK the reason why it doesn't say much is that it says "device is
doing something", nothing about the bandwidth/throughput. It's very
obvious on RAID storage, where you can see 100% util on the md device,
but the members are used only at 25%. SSDs are similar internally,
except that the members are not visible.


regards

--
Tomas Vondra
On 10/7/25 16:35, Andres Freund wrote:
> Hi,
>
> On 2025-10-07 14:08:27 +0200, Tomas Vondra wrote:
>> On 10/7/25 01:56, Andres Freund wrote:
>>> A correlated index scan today will not do IO combining, despite being
>>> accounted as seq_page_cost. So just doing individual 8kB IOs actually seems to
>>> be the appropriate comparison.  Even with table fetches in index scans doing
>>> IO combining as part by your work, the reads of the index data itself won't be
>>> combined. And I'm sure other things won't be either.
>>>
>>
>> But that's the point. If the sequential reads do I/O combining and index
>> scans don't (and I don't think that will change anytime soon), then that
>> makes sequential I/O much more efficient / cheaper. And we better
>> reflect that in the cost somehow. Maybe increasing the random_page_cost
>> is not the right/best solution? That's possible.
>
> The table fetch portion of an index scan uses seq_page_cost too, with the
> degree of it being used determined by the correlation (c.f. cost_index()).
> Given that we use random page cost and sequential page cost both for index
> scan and non-index scan related costs, I just don't see how it can make sense
> to include index related overheads in random_page_cost but not seq_page_cost.
>

I'm not against separating the cost into some (new?) GUC cost parameter,
not into random_page_cost. At this point that's all we have, so that's
what my testing relies on. But you're probably right we may need more
nuance in the costing.


regards

--
Tomas Vondra
Fascinating thread. As the author of the previous thread Bruce mentioned advocating a lower default rpc, I'm obviously highly invested in this.
On Tue, Oct 7, 2025 at 11:38 AM Robert Treat <rob@xzilla.net> wrote:
One of the interesting things about Tomas' work, if you look at the problem from the other end, is that this exposes a thought-line that I
suspect is almost completely untested "in the field", specifically the idea of *raising* random_page_cost as a means to improve performance.
I've been doing this sort of thing for clients a long time, and I always test both directions when I come across a query that should be faster. For real-world queries, 99% of them have no change or improve with a lowered rpc, and 99% get worse via a raised rpc. So color me unconvinced. Obviously finding some way to emulate these real-world queries would be ideal, but alas, real client data and schemas tends to be well protected. One of the take-away lessons from this thread for me is that the TPC-* benchmarks are far removed from real world queries. (Maybe if we ask an LLM to use an ORM to implement TPC-H? Ha ha ha!)
Cheers,
Greg
--
Crunchy Data - https://www.crunchydata.com
Enterprise Postgres Software Products & Tech Support
On Tue, Oct 7, 2025 at 3:15 PM Greg Sabino Mullane <htamfids@gmail.com> wrote:
One of the take-away lessons from this thread for me is that the TPC-* benchmarks are far removed from real world queries. (Maybe if we ask an LLM to use an ORM to implement TPC-H? Ha ha ha!)
To be clear, I'm saying that TPC queries are written by sane adults that know what they are doing, but perhaps lowering rpc tends to help more when the queries are not well-written SQL (which many consultants would argue is the majority of production queries).
Cheers,
Greg
--
Crunchy Data - https://www.crunchydata.com
Enterprise Postgres Software Products & Tech Support
Hi,

On 2025-10-07 15:20:37 -0400, Greg Sabino Mullane wrote:
> On Tue, Oct 7, 2025 at 3:15 PM Greg Sabino Mullane <htamfids@gmail.com>
> wrote:
>
> > One of the take-away lessons from this thread for me is that the TPC-*
> >> benchmarks are far removed from real world queries. (Maybe if we ask an LLM
> >> to use an ORM to implement TPC-H? Ha ha ha!)
> >
> >
> To be clear, I'm saying that TPC queries are written by sane adults that
> know what they are doing, but perhaps lowering rpc tends to help more when
> the queries are not well-written SQL (which many consultants would argue is
> the majority of production queries).

I think this discrepancy is largely due to the fact that Tomas' is testing
with a cold cache (he has numbers for both), whereas most production workloads
have very high cache hit ratios.  Also most production postgres workloads are
not heavily on the analytics side, in semi-transactional workloads switching
to a sequential scan "too early" is *way way* worse than staying with a index
scan for a bit longer than makes sense. The switch to a seqscan will often
make the query dramatically more expensive, whereas staying with the index
scan increases costs incrementally.  Add to that the bane of fast-start plans
that really can't be disabled other than making seq scans relatively more
expensive...

I rather doubt we'll find a particularly satisfying answer to this without a
better answer to take into account how many blocks will already be cached at
the start of query execution - we only really model keeping blocks cached
across repeated accesses within one query execution.  Just lowering
seq_page_cost & random_page_cost to account for IO being cheap (due to being
cached) is a pretty bad answer, as it doesn't really allow for accurate
costing of some queries having high hit ratio and others a poor one.

Greetings,

Andres Freund
On Tue, Oct 7, 2025 at 3:46 PM Andres Freund <andres@anarazel.de> wrote:
> I think this discrepancy is largely due to the fact that Tomas' is testing
> with a cold cache (he has numbers for both), whereas most production workloads
> have very high cache hit ratios.

Any test case that fails to ensure that all relevant indexes at least
have all of their internal B-Tree pages in shared_buffers is extremely
unrealistic. That only requires that we cache only a fraction of 1% of
all index pages, which is something that production workloads manage
to do approximately all the time.

I wonder how much the "cold" numbers would change if Tomas made just
that one tweak (prewarming only the internal index pages). I don't
think that there's a convenient way of running that experiment right
now -- but it would be relatively easy to invent one.

I'm not claiming that this extra step would make the "cold" numbers
generally representative. Just that it might be enough on its own to
get wildly better results, which would put the existing "cold" numbers
in context.

--
Peter Geoghegan
On 10/7/25 23:08, Peter Geoghegan wrote:
> On Tue, Oct 7, 2025 at 3:46 PM Andres Freund <andres@anarazel.de> wrote:
>> I think this discrepancy is largely due to the fact that Tomas' is testing
>> with a cold cache (he has numbers for both), whereas most production workloads
>> have very high cache hit ratios.
>
> Any test case that fails to ensure that all relevant indexes at least
> have all of their internal B-Tree pages in shared_buffers is extremely
> unrealistic. That only requires that we cache only a fraction of 1% of
> all index pages, which is something that production workloads manage
> to do approximately all the time.
>
> I wonder how much the "cold" numbers would change if Tomas made just
> that one tweak (prewarming only the internal index pages). I don't
> think that there's a convenient way of running that experiment right
> now -- but it would be relatively easy to invent one.
>
> I'm not claiming that this extra step would make the "cold" numbers
> generally representative. Just that it might be enough on its own to
> get wildly better results, which would put the existing "cold" numbers
> in context.
>

Why would you expect that?

The index size is about 5% of the table size, so why would the internal
index pages make any meaningful difference beyond that?

Also, it's true the test starts from "cold" cache, but is still uses
shared buffers - and I'd expect the internal pages to be very hot,
compared to the heap. Heap pages are read ~21x, but very far apart. So
the internal index pages are likely cached even in the cold runs.

I can do some runs after prewarming the (whole) index, just to see if it
makes any difference.


regards

--
Tomas Vondra
On Wed, 8 Oct 2025 at 08:15, Greg Sabino Mullane <htamfids@gmail.com> wrote:
> I've been doing this sort of thing for clients a long time, and I always test both directions when I come across a
querythat should be faster. For real-world queries, 99% of them have no change or improve with a lowered rpc, and 99%
getworse via a raised rpc. So color me unconvinced.

I wonder how much past experience for this on versions before v18
count in now that we have AIO. The bar should have moved quite
significantly with v18 in terms of how often Seq Scans spend waiting
for IO vs Index Scans. So maybe Tomas's results shouldn't be too
surprising. Maybe the graph would look quite different with io_method
= 'sync'.. ?

David
On 10/8/25 06:02, David Rowley wrote:
> On Wed, 8 Oct 2025 at 08:15, Greg Sabino Mullane <htamfids@gmail.com> wrote:
>> I've been doing this sort of thing for clients a long time, and I always test both directions when I come across a
querythat should be faster. For real-world queries, 99% of them have no change or improve with a lowered rpc, and 99%
getworse via a raised rpc. So color me unconvinced.

>
> I wonder how much past experience for this on versions before v18
> count in now that we have AIO. The bar should have moved quite
> significantly with v18 in terms of how often Seq Scans spend waiting
> for IO vs Index Scans. So maybe Tomas's results shouldn't be too
> surprising. Maybe the graph would look quite different with io_method
> = 'sync'.. ?
>

Interesting idea, and I'll try to run this on 17 and/or on 18/sync. I
should have some results tomorrow.

But based on the testing I've done on 18beta1 (in the thread about what
should be the default for io_method), I doubt it'll change the outcome
very much. It showed no change for indexscans, and seqscans got about 2x
as fast. So the random_page_cost will be about 1/2 of what the earlier
results said - that's a change, but it's still more than 2x of the
current value.

Let's see if the results agree with my guess ...


regards

--
Tomas Vondra
On 10/8/25 02:04, Tomas Vondra wrote:
>
>
> On 10/7/25 23:08, Peter Geoghegan wrote:
>> On Tue, Oct 7, 2025 at 3:46 PM Andres Freund <andres@anarazel.de> wrote:
>>> I think this discrepancy is largely due to the fact that Tomas' is testing
>>> with a cold cache (he has numbers for both), whereas most production workloads
>>> have very high cache hit ratios.
>>
>> Any test case that fails to ensure that all relevant indexes at least
>> have all of their internal B-Tree pages in shared_buffers is extremely
>> unrealistic. That only requires that we cache only a fraction of 1% of
>> all index pages, which is something that production workloads manage
>> to do approximately all the time.
>>
>> I wonder how much the "cold" numbers would change if Tomas made just
>> that one tweak (prewarming only the internal index pages). I don't
>> think that there's a convenient way of running that experiment right
>> now -- but it would be relatively easy to invent one.
>>
>> I'm not claiming that this extra step would make the "cold" numbers
>> generally representative. Just that it might be enough on its own to
>> get wildly better results, which would put the existing "cold" numbers
>> in context.
>>
>
> Why would you expect that?
>
> The index size is about 5% of the table size, so why would the internal
> index pages make any meaningful difference beyond that?
>
> Also, it's true the test starts from "cold" cache, but is still uses
> shared buffers - and I'd expect the internal pages to be very hot,
> compared to the heap. Heap pages are read ~21x, but very far apart. So
> the internal index pages are likely cached even in the cold runs.
>
> I can do some runs after prewarming the (whole) index, just to see if it
> makes any difference.
>

I tried measuring this. I pre-warmed the internal index pages using
pageinspect and pg_prewarm like this:

1) use bt_multi_page_stats to select non-leaf pages
2) use pg_prewarm to load these pages

The query looks like this:

  SELECT 'SELECT pg_prewarm(''idx'', ''buffer'', ''main'', ' || blkno ||
', ' || blkno || ');' AS sql
  FROM (
    -- list of non-leaf index pages
    SELECT blkno FROM bt_multi_page_stats('idx', 1, (select relpages - 1
from pg_class where relname = 'idx')) where type != 'l'
  )

The generated SQL is written to a SQL script, and then executed after
restarting the instance / dropping caches.

As I expected, it made absolutely no difference. These are the results
for the NVMe RAID0:

                 seqscan (s)      index scan (s)  random_page_cost
 -----------------------------------------------------------------
  prewarming: no         24               25462             49.3
  prewarming: yes        24               25690             49.7

No surprise here. It's a little bit slower, but that's well within a
run-to-run variability.

There's only ~5000 non-leaf index pages, It'd be very surprising if it
made any difference on a table with 23809524 pages (and when the
indexscan does 500M page accesses).


regards

--
Tomas Vondra
On Mon, 6 Oct 2025 at 12:24, Tomas Vondra <tomas@vondra.me> wrote:
> On 10/6/25 07:29, Tom Lane wrote:
> > Another angle is that I expect that the ongoing AIO work will largely
> > destroy the existing model altogether, at least if you think in terms
> > of the model as trying to predict query execution time.  But if what
> > we're trying to model is net resource demands, with an eye to
> > minimizing the total system load not execution time of any one query,
> > maybe we can continue to work with something close to what we've
> > traditionally done.
> >
> > No answers here, just more questions ...
> >
>
> I had the same thought, when working on the (index) prefetching. Which
> of course now relies on AIO. Without concurrency, there wasn't much
> difference between optimizing for resources and time, but AIO changes
> that. In fact, parallel query has a similar effect, because it also
> spreads the work to multiple concurrent processes.
>
> Parallel query simply divides the cost between workers, as if each use a
> fraction of resources. And the cost of the parallel plan is lower than
> summing up the per-worker costs. Maybe AIO should do something similar?
> That is, estimate the I/O concurrency and lower the cost a bit?

OS and/or disk read-ahead is muddying the water here. Most modern
storage can saturate their bandwidth capability with enough concurrent
or large enough requests. The read-ahead is effectively increasing
request concurrency behind PostgreSQLs back while random is running
with concurrency 1. It would be very interesting to see what
debug_io_direct does, and also fio numbers for direct io.

It seems to me too that the increased capability to utilize I/O
concurrency from AIO significantly changes how this needs to be
modeled. In addition to random/sequential distinction there is now
also prefetchable/non-predictable distinction. And it would be good to
incorporate some cost to "wasting" resources. If we would apply
effective_io_concurrency blindly, then scanning 1600 predictable pages
would be cheaper than 100 unpredictable. And it would be correct that
it is faster, but maybe not by enough to justify the extra resource
usage.

I think Laurenz was on the right track with introducing a tunable that
allows to slide between time and resource use optimization. It doesn't
have to be all or nothing, like for 2x faster execution, one could
allow 10% or 2x or any amount of extra resources to be used.

But for that to have a chance of working reasonably the cost model
needs to be better. Right now the per page costs effectively encode
expected cache hit ratios, io cost vs page access cpu cost in a very
coarse and unintuitive way. I don't think the actual buffers read
number is anywhere close to how many times the planner accounts
page_cost for anything but a sequential scan of a huge table.

Regards,
Ants Aasma
On Tue, Oct 7, 2025 at 3:15 PM Greg Sabino Mullane <htamfids@gmail.com> wrote:
> I've been doing this sort of thing for clients a long time, and I always test both directions when I come across a
querythat should be faster. For real-world queries, 99% of them have no change or improve with a lowered rpc, and 99%
getworse via a raised rpc. So color me unconvinced.

Color me equally unconvinced. Tomas seems quite convinced that we
ought to be raising random_page_cost rather than lowering it, and that
absolutely does not correspond to my experience in any way. It's not
that I've actually tested raising the random page cost on very many
systems, mind you. It's that my experience with real-world systems is
that we tend to pick sequential scans when we should use an index, not
the other way around. And obviously that problem will never be fixed
by raising random_page_cost, since that will tend to favor sequential
scans even more.

Tomas's test involves scanning big tables that don't fit in RAM, and I
agree that if that's most of what you do, you might benefit from a
higher random_page_cost. However, even users who have some tables that
are a lot bigger than RAM also tend to have frequently-accessed tables
that are much smaller. For example, if you join a fact table to a
bunch of dimension tables, the fact table may not fit in RAM, but the
dimension tables probably do, and we're using the same
random_page_cost for all of those tables. Moreover, we're least likely
to make a wrong decision about what to do about the big table. It will
often be the case that the query will be phrased such that a
sequential scan on the big table is unavoidable, and if it is possible
to avoid a sequential scan, we're going to want to do so almost
regardless of random_page_cost because the number of pages accesses we
can save will tend to be large. On a smaller table, it's more likely
that both a full table scan and an index-based approach will be
competitive, so there the value of random_page_cost will matter more
to the final outcome. So, in this scenario, it's more important that
the random_page_cost is close to accurate for the smaller tables
rather than for the larger ones, and those are the ones that are most
likely to benefit from caching.

One of the planner changes that I think would be worth exploring is to
have the system try to estimate the percentage of a given table that
is likely to be in cache, and that could be configured via a reloption
or estimated based on the size of the table (or maybe even the
frequency of access, though that is fraught, since it can change
precipitously on short time scales and is thus not great to use for
planning). If we estimated that small tables are likely to be cached
and bigger ones are likely to be less-cached or, if very big,
completely uncached, then it would probably be right to raise
random_page_cost as well. But without that kind of a change, the
correct value of random_page_cost is the one that takes into account
both the possibility of caching and the possibility of nothing being
cached, and this test is rotated all the way toward one end of that
spectrum.

--
Robert Haas
EDB: http://www.enterprisedb.com
On 10/8/25 17:14, Ants Aasma wrote:
> On Mon, 6 Oct 2025 at 12:24, Tomas Vondra <tomas@vondra.me> wrote:
>> On 10/6/25 07:29, Tom Lane wrote:
>>> Another angle is that I expect that the ongoing AIO work will largely
>>> destroy the existing model altogether, at least if you think in terms
>>> of the model as trying to predict query execution time.  But if what
>>> we're trying to model is net resource demands, with an eye to
>>> minimizing the total system load not execution time of any one query,
>>> maybe we can continue to work with something close to what we've
>>> traditionally done.
>>>
>>> No answers here, just more questions ...
>>>
>>
>> I had the same thought, when working on the (index) prefetching. Which
>> of course now relies on AIO. Without concurrency, there wasn't much
>> difference between optimizing for resources and time, but AIO changes
>> that. In fact, parallel query has a similar effect, because it also
>> spreads the work to multiple concurrent processes.
>>
>> Parallel query simply divides the cost between workers, as if each use a
>> fraction of resources. And the cost of the parallel plan is lower than
>> summing up the per-worker costs. Maybe AIO should do something similar?
>> That is, estimate the I/O concurrency and lower the cost a bit?
>
> OS and/or disk read-ahead is muddying the water here. Most modern
> storage can saturate their bandwidth capability with enough concurrent
> or large enough requests. The read-ahead is effectively increasing
> request concurrency behind PostgreSQLs back while random is running
> with concurrency 1. It would be very interesting to see what
> debug_io_direct does, and also fio numbers for direct io.
>

I think I've done some of the runs with direct I/O (e.g. the Azure runs
were doing that), and the conclusions were mostly the same. I did a
couple runs on the other machines, but I don't have results that I could
present. I'll try to get some, maybe it'll be different.

But even if this was due to read-ahead, why shouldn't that be reflected
in the costs? Surely that can be considered as I/O cost.

FWIW this is not just about read-ahead done by the kernel. The devices
have this kind of heuristics too [1], in which case it's going to affect
direct I/O too.

[1] https://vondra.me/posts/fun-and-weirdness-with-ssds/

> It seems to me too that the increased capability to utilize I/O
> concurrency from AIO significantly changes how this needs to be
> modeled. In addition to random/sequential distinction there is now
> also prefetchable/non-predictable distinction. And it would be good to
> incorporate some cost to "wasting" resources. If we would apply
> effective_io_concurrency blindly, then scanning 1600 predictable pages
> would be cheaper than 100 unpredictable. And it would be correct that
> it is faster, but maybe not by enough to justify the extra resource
> usage.
>
> I think Laurenz was on the right track with introducing a tunable that
> allows to slide between time and resource use optimization. It doesn't
> have to be all or nothing, like for 2x faster execution, one could
> allow 10% or 2x or any amount of extra resources to be used.
>
> But for that to have a chance of working reasonably the cost model
> needs to be better. Right now the per page costs effectively encode
> expected cache hit ratios, io cost vs page access cpu cost in a very
> coarse and unintuitive way. I don't think the actual buffers read
> number is anywhere close to how many times the planner accounts
> page_cost for anything but a sequential scan of a huge table.
>

True. The challenge to improve this without making the whole cost model
so complex it's effectively impossible to get right.


regards

--
Tomas Vondra
On 10/8/25 17:20, Robert Haas wrote:
> On Tue, Oct 7, 2025 at 3:15 PM Greg Sabino Mullane <htamfids@gmail.com> wrote:
>> I've been doing this sort of thing for clients a long time, and I always test both directions when I come across a
querythat should be faster. For real-world queries, 99% of them have no change or improve with a lowered rpc, and 99%
getworse via a raised rpc. So color me unconvinced.

>
> Color me equally unconvinced. Tomas seems quite convinced that we
> ought to be raising random_page_cost rather than lowering it, and that
> absolutely does not correspond to my experience in any way. It's not
> that I've actually tested raising the random page cost on very many
> systems, mind you. It's that my experience with real-world systems is
> that we tend to pick sequential scans when we should use an index, not
> the other way around. And obviously that problem will never be fixed
> by raising random_page_cost, since that will tend to favor sequential
> scans even more.
>
> Tomas's test involves scanning big tables that don't fit in RAM, and I
> agree that if that's most of what you do, you might benefit from a
> higher random_page_cost. However, even users who have some tables that
> are a lot bigger than RAM also tend to have frequently-accessed tables
> that are much smaller. For example, if you join a fact table to a
> bunch of dimension tables, the fact table may not fit in RAM, but the
> dimension tables probably do, and we're using the same
> random_page_cost for all of those tables. Moreover, we're least likely
> to make a wrong decision about what to do about the big table. It will
> often be the case that the query will be phrased such that a
> sequential scan on the big table is unavoidable, and if it is possible
> to avoid a sequential scan, we're going to want to do so almost
> regardless of random_page_cost because the number of pages accesses we
> can save will tend to be large. On a smaller table, it's more likely
> that both a full table scan and an index-based approach will be
> competitive, so there the value of random_page_cost will matter more
> to the final outcome. So, in this scenario, it's more important that
> the random_page_cost is close to accurate for the smaller tables
> rather than for the larger ones, and those are the ones that are most
> likely to benefit from caching.
>

I don't think there's all that much disagreement, actually. This is a
pretty good illustration that we're using random_page_cost to account
for things other than "I/O cost" (like the expected cache hit ratios),
because we simply don't have a better knob for that.

> One of the planner changes that I think would be worth exploring is to
> have the system try to estimate the percentage of a given table that
> is likely to be in cache, and that could be configured via a reloption
> or estimated based on the size of the table (or maybe even the
> frequency of access, though that is fraught, since it can change
> precipitously on short time scales and is thus not great to use for
> planning). If we estimated that small tables are likely to be cached
> and bigger ones are likely to be less-cached or, if very big,
> completely uncached, then it would probably be right to raise
> random_page_cost as well. But without that kind of a change, the
> correct value of random_page_cost is the one that takes into account
> both the possibility of caching and the possibility of nothing being
> cached, and this test is rotated all the way toward one end of that
> spectrum.
>

Isn't this somewhat what effective_cache_size was meant to do? That
obviously does not know about what fraction of individual tables is
cached, but it does impose size limit.

I think in the past we mostly assumed we can't track cache size per
table, because we have no visibility into page cache. But maybe direct
I/O would change this?


regards

--
Tomas Vondra
On Wed, Oct 8, 2025 at 12:24 PM Tomas Vondra <tomas@vondra.me> wrote:
> I don't think there's all that much disagreement, actually. This is a
> pretty good illustration that we're using random_page_cost to account
> for things other than "I/O cost" (like the expected cache hit ratios),
> because we simply don't have a better knob for that.

I agree with that conclusion.

> Isn't this somewhat what effective_cache_size was meant to do? That
> obviously does not know about what fraction of individual tables is
> cached, but it does impose size limit.

Not really, because effective_cache_size only models the fact that
when you iterate the same index scan within the execution of a single
query, it will probably hit some pages more than once. It doesn't have
any idea that anything other than an index scan might hit the same
pages more than once, and it doesn't have any idea that a query might
find data in cache as a result of previous queries. Also, when it
thinks the same page is accessed more than once, the cost of
subsequent accesses is 0.

I could be wrong, but I kind of doubt that there is any future in
trying to generalize effective_cache_size. It's an extremely
special-purpose mechanism, and what we need here is more of a general
approach that can cut across the whole planner -- or alternatively we
can decide that things are fine and that having rpc/spc implicitly
model caching behavior is good enough.

> I think in the past we mostly assumed we can't track cache size per
> table, because we have no visibility into page cache. But maybe direct
> I/O would change this?

I think it's probably going to work out really poorly to try to use
cache contents for planning. The plan may easily last much longer than
the cache contents.

--
Robert Haas
EDB: http://www.enterprisedb.com
Hi,

On 2025-10-08 13:23:33 -0400, Robert Haas wrote:
> On Wed, Oct 8, 2025 at 12:24 PM Tomas Vondra <tomas@vondra.me> wrote:
> > Isn't this somewhat what effective_cache_size was meant to do? That
> > obviously does not know about what fraction of individual tables is
> > cached, but it does impose size limit.
>
> Not really, because effective_cache_size only models the fact that
> when you iterate the same index scan within the execution of a single
> query, it will probably hit some pages more than once.

That's indeed today's use, but I wonder whether we ought to expand that. One
of the annoying things about *_page_cost effectively needing to be set "too
low" to handle caching effects is that that completely breaks down for larger
relations. Which has unwelcome effects like making a > memory sequential scan
seem like a reasonable plan.

It's a generally reasonable assumption that a scan processing a smaller amount
of data than effective_cache_size is more likely to cached than a scan that is
processing much more data than effective_cache_size. In the latter case,
assuming an accurate effective_cache_size, we *know* that a good portion of
the data cannot be cached.

Which leads me to wonder if we ought to interpolate between a "cheaper" access
cost for data << effective_cache_size and the "more real" access costs the
closer the amount of data gets to effective_cache_size.

Greetings,

Andres Freund
On 10/8/25 12:01, Tomas Vondra wrote:
> On 10/8/25 06:02, David Rowley wrote:
>> On Wed, 8 Oct 2025 at 08:15, Greg Sabino Mullane <htamfids@gmail.com> wrote:
>>> I've been doing this sort of thing for clients a long time, and I always test both directions when I come across a
querythat should be faster. For real-world queries, 99% of them have no change or improve with a lowered rpc, and 99%
getworse via a raised rpc. So color me unconvinced.

>>
>> I wonder how much past experience for this on versions before v18
>> count in now that we have AIO. The bar should have moved quite
>> significantly with v18 in terms of how often Seq Scans spend waiting
>> for IO vs Index Scans. So maybe Tomas's results shouldn't be too
>> surprising. Maybe the graph would look quite different with io_method
>> = 'sync'.. ?
>>
>
> Interesting idea, and I'll try to run this on 17 and/or on 18/sync. I
> should have some results tomorrow.
>
> But based on the testing I've done on 18beta1 (in the thread about what
> should be the default for io_method), I doubt it'll change the outcome
> very much. It showed no change for indexscans, and seqscans got about 2x
> as fast. So the random_page_cost will be about 1/2 of what the earlier
> results said - that's a change, but it's still more than 2x of the
> current value.
>
> Let's see if the results agree with my guess ...
>

I did a run on PG17 (on the NVMe RAID), and it's not all that different
from PG18:

                seqscan (s)      index scan (s)  random_page_cost
 -----------------------------------------------------------------
  PG18 NVMe/RAID0        24               25462             49.3
  PG17 NVMe/RAID0        32               25533             38.2

Yes, there's a difference, mostly due to seqscans being slower on PG17
(which matches the measurements in the io_method thread). It'd be a bit
slower with checksums enabled on PG17 (by ~10-20%).

It's just a single run, from a single hw configuration. But the results
are mostly as I expected.


regards

--
Tomas Vondra
Hi,

On 2025-10-08 21:12:37 +0200, Tomas Vondra wrote:
> I did a run on PG17 (on the NVMe RAID), and it's not all that different
> from PG18:
>
>                 seqscan (s)      index scan (s)  random_page_cost
>  -----------------------------------------------------------------
>   PG18 NVMe/RAID0        24               25462             49.3
>   PG17 NVMe/RAID0        32               25533             38.2
>
> Yes, there's a difference, mostly due to seqscans being slower on PG17
> (which matches the measurements in the io_method thread). It'd be a bit
> slower with checksums enabled on PG17 (by ~10-20%).
>
> It's just a single run, from a single hw configuration. But the results
> are mostly as I expected.

I also didn't expect anything major here. The query execution relevant uses of
AIO in 18 just don't change the picture that much:

Seqscans already had readahead from the OS level and bitmap heap scans had
readahead via posix_fadvise. The AIO use for e.g. VACUUM can have vastly
bigger impact, but we don't use cost based planning for that.

That's not to say we don't need to improve this for 18-as-is. E.g.:

- we already did not properly cost bitmap heap scan taking
  effective_io_concurrency into account.  It's very easy to see 1-2 orders of
  magnitude difference for bitmap heap scans for different
  effective_io_concurrency values, that is clearly big enough that it ought to
  be reflected in the cost.

- we already did not account for the fact that backward index scans are
  *vastly* slower than forward index scans.


Once we use AIO for plain index scans, costing probably ought to account for
AIO effects - it's again pretty easy to to see 1-2 orders of magnitude in
execution time difference on real-world hardware. That should move the needle
towards preferring index scans over seqscans in plenty of situations.

Greetings,

Andres Freund
On 10/8/25 19:23, Robert Haas wrote:
> On Wed, Oct 8, 2025 at 12:24 PM Tomas Vondra <tomas@vondra.me> wrote:
>> I don't think there's all that much disagreement, actually. This is a
>> pretty good illustration that we're using random_page_cost to account
>> for things other than "I/O cost" (like the expected cache hit ratios),
>> because we simply don't have a better knob for that.
>
> I agree with that conclusion.
>
>> Isn't this somewhat what effective_cache_size was meant to do? That
>> obviously does not know about what fraction of individual tables is
>> cached, but it does impose size limit.
>
> Not really, because effective_cache_size only models the fact that
> when you iterate the same index scan within the execution of a single
> query, it will probably hit some pages more than once. It doesn't have
> any idea that anything other than an index scan might hit the same
> pages more than once, and it doesn't have any idea that a query might
> find data in cache as a result of previous queries. Also, when it
> thinks the same page is accessed more than once, the cost of
> subsequent accesses is 0.
>
> I could be wrong, but I kind of doubt that there is any future in
> trying to generalize effective_cache_size. It's an extremely
> special-purpose mechanism, and what we need here is more of a general
> approach that can cut across the whole planner -- or alternatively we
> can decide that things are fine and that having rpc/spc implicitly
> model caching behavior is good enough.
>
>> I think in the past we mostly assumed we can't track cache size per
>> table, because we have no visibility into page cache. But maybe direct
>> I/O would change this?
>
> I think it's probably going to work out really poorly to try to use
> cache contents for planning. The plan may easily last much longer than
> the cache contents.
>

Why wouldn't that trigger invalidations / replanning just like other
types of stats? I imagine we'd regularly collect stats about what's
cached, etc. and we'd invalidate stale plans just like after ANALYZE.

Just a random idea, though. We'd need some sort of summary anyway, it's
not plausible each backend would collect this info on it's own.


regards

--
Tomas Vondra
Hi,

On 2025-10-08 21:25:53 +0200, Tomas Vondra wrote:
> On 10/8/25 19:23, Robert Haas wrote:
> >> I think in the past we mostly assumed we can't track cache size per
> >> table, because we have no visibility into page cache. But maybe direct
> >> I/O would change this?
> >
> > I think it's probably going to work out really poorly to try to use
> > cache contents for planning. The plan may easily last much longer than
> > the cache contents.
> >
>
> Why wouldn't that trigger invalidations / replanning just like other
> types of stats? I imagine we'd regularly collect stats about what's
> cached, etc. and we'd invalidate stale plans just like after ANALYZE.

You can't just handle it like other such stats - the contents of
shared_buffers can differ between primary and standby and other stats that
trigger replanning are all in system tables that can't differ between primary
and hot standby instances.

We IIRC don't currently use shared memory stats for planning and thus have no
way to trigger invalidation for relevant changes. While it seems plausible to
drive this via shared memory stats, the current cumulative counters aren't
really suitable, we'd either need something that removes the influence of
olders hits/misses or a new field tracking the current number of buffers for a
relation [fork].

Greetings,

Andres Freund
On 10/8/25 21:37, Andres Freund wrote:
> Hi,
>
> On 2025-10-08 21:25:53 +0200, Tomas Vondra wrote:
>> On 10/8/25 19:23, Robert Haas wrote:
>>>> I think in the past we mostly assumed we can't track cache size per
>>>> table, because we have no visibility into page cache. But maybe direct
>>>> I/O would change this?
>>>
>>> I think it's probably going to work out really poorly to try to use
>>> cache contents for planning. The plan may easily last much longer than
>>> the cache contents.
>>>
>>
>> Why wouldn't that trigger invalidations / replanning just like other
>> types of stats? I imagine we'd regularly collect stats about what's
>> cached, etc. and we'd invalidate stale plans just like after ANALYZE.
>
> You can't just handle it like other such stats - the contents of
> shared_buffers can differ between primary and standby and other stats that
> trigger replanning are all in system tables that can't differ between primary
> and hot standby instances.
>
> We IIRC don't currently use shared memory stats for planning and thus have no
> way to trigger invalidation for relevant changes. While it seems plausible to
> drive this via shared memory stats, the current cumulative counters aren't
> really suitable, we'd either need something that removes the influence of
> olders hits/misses or a new field tracking the current number of buffers for a
> relation [fork].
>

I don't think I mentioned pgstat (i.e. the shmem stats) anywhere, and I
mentioned ANALYZE which has nothing to do with pgstats either. So I'm a
bit confused why you argue we can't use pgstat.

What I imagined is more like a process that regularly walks shared
buffers, counts buffers per relation (or relfilenode), stores the
aggregated info into some shared memory (so that standby can have it's
own concept of cache contents). And then invalidates plans the same way
ANALYZE does.

regards

--
Tomas Vondra
Hi,

On 2025-10-08 22:20:31 +0200, Tomas Vondra wrote:
> On 10/8/25 21:37, Andres Freund wrote:
> > On 2025-10-08 21:25:53 +0200, Tomas Vondra wrote:
> >> On 10/8/25 19:23, Robert Haas wrote:
> >>>> I think in the past we mostly assumed we can't track cache size per
> >>>> table, because we have no visibility into page cache. But maybe direct
> >>>> I/O would change this?
> >>>
> >>> I think it's probably going to work out really poorly to try to use
> >>> cache contents for planning. The plan may easily last much longer than
> >>> the cache contents.
> >>>
> >>
> >> Why wouldn't that trigger invalidations / replanning just like other
> >> types of stats? I imagine we'd regularly collect stats about what's
> >> cached, etc. and we'd invalidate stale plans just like after ANALYZE.
> >
> > You can't just handle it like other such stats - the contents of
> > shared_buffers can differ between primary and standby and other stats that
> > trigger replanning are all in system tables that can't differ between primary
> > and hot standby instances.
> >
> > We IIRC don't currently use shared memory stats for planning and thus have no
> > way to trigger invalidation for relevant changes. While it seems plausible to
> > drive this via shared memory stats, the current cumulative counters aren't
> > really suitable, we'd either need something that removes the influence of
> > olders hits/misses or a new field tracking the current number of buffers for a
> > relation [fork].
> >
>
> I don't think I mentioned pgstat (i.e. the shmem stats) anywhere, and I
> mentioned ANALYZE which has nothing to do with pgstats either. So I'm a
> bit confused why you argue we can't use pgstat.

I'm mentioning pgstats because we can't store stats like ANALYZE otherwise
does, due to that being in catalog tables. Given that, why wouldn't we store
the cache hit ratio in pgstats?

It'd be pretty weird to overload this into ANALYZE imo, given that this would
be the only stat that we'd populate on standbys in ANALYZE. We'd also need to
start running AV on standbys for it.


> What I imagined is more like a process that regularly walks shared
> buffers, counts buffers per relation (or relfilenode), stores the
> aggregated info into some shared memory (so that standby can have it's
> own concept of cache contents).

That shared memory datastructure basically describes pgstats, no?


> And then invalidates plans the same way ANALYZE does.

I'm not sure the invalidation machinery actually fully works in HS (due to
doing things like incrementing the command counter). It would probably be
doable to change that though.

Greetings,

Andres Freund
On 10/8/25 22:52, Andres Freund wrote:
> Hi,
>
> On 2025-10-08 22:20:31 +0200, Tomas Vondra wrote:
>> On 10/8/25 21:37, Andres Freund wrote:
>>> On 2025-10-08 21:25:53 +0200, Tomas Vondra wrote:
>>>> On 10/8/25 19:23, Robert Haas wrote:
>>>>>> I think in the past we mostly assumed we can't track cache size per
>>>>>> table, because we have no visibility into page cache. But maybe direct
>>>>>> I/O would change this?
>>>>>
>>>>> I think it's probably going to work out really poorly to try to use
>>>>> cache contents for planning. The plan may easily last much longer than
>>>>> the cache contents.
>>>>>
>>>>
>>>> Why wouldn't that trigger invalidations / replanning just like other
>>>> types of stats? I imagine we'd regularly collect stats about what's
>>>> cached, etc. and we'd invalidate stale plans just like after ANALYZE.
>>>
>>> You can't just handle it like other such stats - the contents of
>>> shared_buffers can differ between primary and standby and other stats that
>>> trigger replanning are all in system tables that can't differ between primary
>>> and hot standby instances.
>>>
>>> We IIRC don't currently use shared memory stats for planning and thus have no
>>> way to trigger invalidation for relevant changes. While it seems plausible to
>>> drive this via shared memory stats, the current cumulative counters aren't
>>> really suitable, we'd either need something that removes the influence of
>>> olders hits/misses or a new field tracking the current number of buffers for a
>>> relation [fork].
>>>
>>
>> I don't think I mentioned pgstat (i.e. the shmem stats) anywhere, and I
>> mentioned ANALYZE which has nothing to do with pgstats either. So I'm a
>> bit confused why you argue we can't use pgstat.
>
> I'm mentioning pgstats because we can't store stats like ANALYZE otherwise
> does, due to that being in catalog tables. Given that, why wouldn't we store
> the cache hit ratio in pgstats?
>
> It'd be pretty weird to overload this into ANALYZE imo, given that this would
> be the only stat that we'd populate on standbys in ANALYZE. We'd also need to
> start running AV on standbys for it.
>

I didn't say it should be done by ANALYZE (and indeed that would be
weird). I said the plans might be invalidated just like after ANALYZE.

And sure, it could be stored in pgstat, sure. Or we'd invent something
new, I don't know. I can imagine both things. I kinda dislike how people
do pg_stat_reset() to reset runtime stats, not realizing it breaks
autovacuum. I'm not sure it's wise to make it break plans too.

>
>> What I imagined is more like a process that regularly walks shared
>> buffers, counts buffers per relation (or relfilenode), stores the
>> aggregated info into some shared memory (so that standby can have it's
>> own concept of cache contents).
>
> That shared memory datastructure basically describes pgstats, no?
>
>
>> And then invalidates plans the same way ANALYZE does.
>
> I'm not sure the invalidation machinery actually fully works in HS (due to
> doing things like incrementing the command counter). It would probably be
> doable to change that though.
>

Yeah, I'm not pretending I have this thought through, considering I only
started thinking about it about an hour ago.

regards

--
Tomas Vondra
On Mon, Oct  6, 2025 at 12:57:20PM -0400, Bruce Momjian wrote:
> On Mon, Oct  6, 2025 at 11:14:13AM -0400, Andres Freund wrote:
> > I'd guess that the *vast* majority of PG workloads these days run on networked
> > block storage. For those typically the actual latency at the storage level is
> > a rather small fraction of the overall IO latency, which is instead dominated
> > by network and other related cost (like the indirection to which storage
> > system to go to and crossing VM/host boundaries).  Because the majority of the
> > IO latency is not affected by the storage latency, but by network lotency, the
> > random IO/non-random IO difference will play less of a role.
>
> Yes, the last time we discussed changing the default random page cost,
> September 2024, the argument was that while SSDs should be < 4, cloud
> storage might be > 4, so 4 was still a good value:
>
>     https://www.postgresql.org/message-id/flat/877caxaxt6.fsf%40wibble.ilmari.org#8a10b7b8cf05410291d076f8def58c29
>
> Add in cache effects for all of these storage devices as outlined in our
> docs.

I rewrote the random_page_cost docs, attached, to remove a focus on
magnetic disk, and added network latency as a reason for
random_page_cost being low.  I removed the specific caching numbers and
went with a more generic description.

I would normally apply this only to master, but given the complaints in
this thread, maybe I should backpatch it.

--
  Bruce Momjian  <bruce@momjian.us>        https://momjian.us
  EDB                                      https://enterprisedb.com

  Do not let urgent matters crowd out time for investment in the future.
Вложения
On Wed, Oct 8, 2025 at 8:16 PM Bruce Momjian <bruce@momjian.us> wrote:
> I rewrote the random_page_cost docs, attached, to remove a focus on
> magnetic disk, and added network latency as a reason for
> random_page_cost being low.  I removed the specific caching numbers and
> went with a more generic description.
>
> I would normally apply this only to master, but given the complaints in
> this thread, maybe I should backpatch it.

This seems fine to me but I won't be surprised if other people have
some complaints. :-)

--
Robert Haas
EDB: http://www.enterprisedb.com
On Wed, Oct 8, 2025 at 4:20 PM Tomas Vondra <tomas@vondra.me> wrote:
> What I imagined is more like a process that regularly walks shared
> buffers, counts buffers per relation (or relfilenode), stores the
> aggregated info into some shared memory (so that standby can have it's
> own concept of cache contents). And then invalidates plans the same way
> ANALYZE does.

I'm not saying we couldn't do this, but I have doubts about how well
it would really work. I have a feeling, for example, that it might
sometimes cause the planner to go to great lengths to avoid bringing a
small table fully into memory, based on the knowledge that the table
is not cached. But the right thing to do could easily be to take the
hit of doing an expensive sequential scan on first access, and then
after that the table stays cached. I think it could very possibly be
the case that such a strategy is faster even for the first execution
and also more stable. In my experience, if you run pgbench -S on a
system with a cold cache, it takes just about forever to warm the
cache via random access; a single pg_prewarm can avoid a very long
period of slowness.

I think Andres's idea of trying to account for things like backward
scans being slower, or prefetching, or AIO, is probably a better
direction. I don't know how well we can take those things into account
or whether it will fully get us where we want to be, but we can model
those events in ways that are stable: the cost is just always
different than today, without relying on any new kinds of stats. I
think that's probably good.

In my experience, we get complaints about plans changing when people
didn't want them to all the time, but we very rarely get complaints
about plans not changing when people did want them to. So I think
trying not to depend on things that can be unstable is probably a good
direction.

--
Robert Haas
EDB: http://www.enterprisedb.com
On 10/9/25 14:17, Robert Haas wrote:
> On Wed, Oct 8, 2025 at 4:20 PM Tomas Vondra <tomas@vondra.me> wrote:
>> What I imagined is more like a process that regularly walks shared
>> buffers, counts buffers per relation (or relfilenode), stores the
>> aggregated info into some shared memory (so that standby can have it's
>> own concept of cache contents). And then invalidates plans the same way
>> ANALYZE does.
>
> I'm not saying we couldn't do this, but I have doubts about how well
> it would really work. I have a feeling, for example, that it might
> sometimes cause the planner to go to great lengths to avoid bringing a
> small table fully into memory, based on the knowledge that the table
> is not cached. But the right thing to do could easily be to take the
> hit of doing an expensive sequential scan on first access, and then
> after that the table stays cached. I think it could very possibly be
> the case that such a strategy is faster even for the first execution
> and also more stable. In my experience, if you run pgbench -S on a
> system with a cold cache, it takes just about forever to warm the
> cache via random access; a single pg_prewarm can avoid a very long
> period of slowness.
>

I agree whatever we do should not penalize plans that pull small tables
into caches. But I don't see why would it have such effect? Isn't this
pretty much what effective_cache_size does (for index scans), where it
estimates if a read was already cached by the same query? And it does
not have this effect, right?

Also, isn't the "seqscan is faster with cold cache, but with warm cache
index scans win" pretty much exactly the planning decision this would be
expected to help with?

> I think Andres's idea of trying to account for things like backward
> scans being slower, or prefetching, or AIO, is probably a better
> direction. I don't know how well we can take those things into account
> or whether it will fully get us where we want to be, but we can model
> those events in ways that are stable: the cost is just always
> different than today, without relying on any new kinds of stats. I
> think that's probably good.
>

I agree with this. But isn't this a mostly orthogonal problem? I mean,
shouldn't we do both (or try to)?

> In my experience, we get complaints about plans changing when people
> didn't want them to all the time, but we very rarely get complaints
> about plans not changing when people did want them to. So I think
> trying not to depend on things that can be unstable is probably a good
> direction.
>

Perhaps. I certainly understand the reluctance to depend on inherently
unstable information. But would this be so unstable? I'm not sure. And
even if it changes fairly often, because the cache content changes, but
gives you the best plan thanks to that, is that an issue?

Also, if users complain about A and not about B, does that mean B is not
an issue? In The Hitchhiker’s Guide to the Galaxy, there's a monster
"Ravenous Bugblatter Beast of Traal", described like this:

    ... a mind-boggingly stupid animal, it assumes that if you can’t
    see it, it can’t see you.

Isn't ignoring "B" a bit like that? Of course, maybe B really is not
worth worrying about. Or maybe this is not the right approach to address
it, I don't know.


regards

--
Tomas Vondra
On Thu, Oct 9, 2025 at 10:47 AM Tomas Vondra <tomas@vondra.me> wrote:
> I agree with this. But isn't this a mostly orthogonal problem? I mean,
> shouldn't we do both (or try to)?
>
> Also, if users complain about A and not about B, does that mean B is not
> an issue?
>
> Isn't ignoring "B" a bit like that? Of course, maybe B really is not
> worth worrying about. Or maybe this is not the right approach to address
> it, I don't know.

I'm just telling you what I think. I'm not purporting to have all of
the right answers.

--
Robert Haas
EDB: http://www.enterprisedb.com
On 10/9/25 17:03, Robert Haas wrote:
> On Thu, Oct 9, 2025 at 10:47 AM Tomas Vondra <tomas@vondra.me> wrote:
>> I agree with this. But isn't this a mostly orthogonal problem? I mean,
>> shouldn't we do both (or try to)?
>>
>> Also, if users complain about A and not about B, does that mean B is not
>> an issue?
>>
>> Isn't ignoring "B" a bit like that? Of course, maybe B really is not
>> worth worrying about. Or maybe this is not the right approach to address
>> it, I don't know.
>
> I'm just telling you what I think. I'm not purporting to have all of
> the right answers.
>

Neither do I, of course. We're mostly brainstorming here, I think. I
hope none of what I wrote came out as harsh, it wasn't meant that way.


regards

--
Tomas Vondra
On 10/8/25 18:17, Tomas Vondra wrote:
>
>
> On 10/8/25 17:14, Ants Aasma wrote:
>> On Mon, 6 Oct 2025 at 12:24, Tomas Vondra <tomas@vondra.me> wrote:
>>> On 10/6/25 07:29, Tom Lane wrote:
>>>> Another angle is that I expect that the ongoing AIO work will largely
>>>> destroy the existing model altogether, at least if you think in terms
>>>> of the model as trying to predict query execution time.  But if what
>>>> we're trying to model is net resource demands, with an eye to
>>>> minimizing the total system load not execution time of any one query,
>>>> maybe we can continue to work with something close to what we've
>>>> traditionally done.
>>>>
>>>> No answers here, just more questions ...
>>>>
>>>
>>> I had the same thought, when working on the (index) prefetching. Which
>>> of course now relies on AIO. Without concurrency, there wasn't much
>>> difference between optimizing for resources and time, but AIO changes
>>> that. In fact, parallel query has a similar effect, because it also
>>> spreads the work to multiple concurrent processes.
>>>
>>> Parallel query simply divides the cost between workers, as if each use a
>>> fraction of resources. And the cost of the parallel plan is lower than
>>> summing up the per-worker costs. Maybe AIO should do something similar?
>>> That is, estimate the I/O concurrency and lower the cost a bit?
>>
>> OS and/or disk read-ahead is muddying the water here. Most modern
>> storage can saturate their bandwidth capability with enough concurrent
>> or large enough requests. The read-ahead is effectively increasing
>> request concurrency behind PostgreSQLs back while random is running
>> with concurrency 1. It would be very interesting to see what
>> debug_io_direct does, and also fio numbers for direct io.
>>
>
> I think I've done some of the runs with direct I/O (e.g. the Azure runs
> were doing that), and the conclusions were mostly the same. I did a
> couple runs on the other machines, but I don't have results that I could
> present. I'll try to get some, maybe it'll be different.
>

Here are results from with debug_io_direct (and shared_buffers=256MB in
both cases), from the single NVMe device.

                seqscan (s)      index scan (s)  random_page_cost
 -----------------------------------------------------------------
  buffered I/O          115               40404              16.6
  direct I/O            108               53053              23.4

I believe the difference is mostly due to page cache - with 182GB data
on 64GB RAM, that's about 30% cache hit ratio, give or take. And the
buffered runs are about 25% faster - not exactly 30%, but close. Also,
funnily enough, the seqscans are faster with direct I/O (so without
kernel read-ahead).

It's just one run, of course. But the results seem reasonable.

regards

--
Tomas Vondra
On Thu, Oct  9, 2025 at 08:05:37AM -0400, Robert Haas wrote:
> On Wed, Oct 8, 2025 at 8:16 PM Bruce Momjian <bruce@momjian.us> wrote:
> > I rewrote the random_page_cost docs, attached, to remove a focus on
> > magnetic disk, and added network latency as a reason for
> > random_page_cost being low.  I removed the specific caching numbers and
> > went with a more generic description.
> >
> > I would normally apply this only to master, but given the complaints in
> > this thread, maybe I should backpatch it.
>
> This seems fine to me but I won't be surprised if other people have
> some complaints. :-)

Doc patch applied to all supported releases.

--
  Bruce Momjian  <bruce@momjian.us>        https://momjian.us
  EDB                                      https://enterprisedb.com

  Do not let urgent matters crowd out time for investment in the future.
On Thu, Oct 30, 2025 at 07:13:01PM -0400, Bruce Momjian wrote:
> On Thu, Oct  9, 2025 at 08:05:37AM -0400, Robert Haas wrote:
> > On Wed, Oct 8, 2025 at 8:16 PM Bruce Momjian <bruce@momjian.us> wrote:
> > > I rewrote the random_page_cost docs, attached, to remove a focus on
> > > magnetic disk, and added network latency as a reason for
> > > random_page_cost being low.  I removed the specific caching numbers and
> > > went with a more generic description.
> > >
> > > I would normally apply this only to master, but given the complaints in
> > > this thread, maybe I should backpatch it.
> >
> > This seems fine to me but I won't be surprised if other people have
> > some complaints. :-)
>
> Doc patch applied to all supported releases.

I thinking more about how we can improve random_page_cost, I now realize
that we will never perfectly model the caching effects, and even if we
did, the possible time gap between planning and execution would rander
it unreliable anyway, i.e., prepared queries.

I think the best we could do is to model how _volatile_ the cache is,
meaning how often are we removing and adding items to the shared buffer
cache, and somehow mix that to the random_page_cost value.  That value
might be fairly stable over a longer period of time.

--
  Bruce Momjian  <bruce@momjian.us>        https://momjian.us
  EDB                                      https://enterprisedb.com

  Do not let urgent matters crowd out time for investment in the future.
I definitely agree with Tom's idea that the costing model needs a re-think, if for no other reason than the volume of discussion on this thread that (AFAICT) has reached precious few conclusions. Along those lines, the two biggest problems I see with the current state of affairs are:
1) We blindly take the lowest cost query, regardless of how close #2 is. More importantly, we do nothing to model how accurate the cost estimate is. In the realm of OLTP, stability is FAR, *FAR* more important than absolute efficiency. Short of forcing specific query plans, the next best thing for stability would be to consider the estimated accuracy of estimates: I'd much rather have a plan with a 2x higher estimate but 90% confidence than a plan that's half the cost but with only 10% confidence.
When it comes to OLAP, it might be useful to have the ability to start executing several different query plans, and monitor how well reality matches the cost estimates (though dealing with nodes that have to process all data before producing tuples would be a bit of a challenge). If a query's going to run for 30 minutes, letting a few copies of it run for 30 seconds to evaluate things could well be a fruitful tradeoff.
2) We have essentially no ability to actually measure how well things are working. The thread has shown that even building controlled tests is difficult, given all the moving parts in the executor that we have little visibility into (just one example: the actual cost of deforming tuples). Getting useful data from user's systems is at least as difficult: even an EXPLAIN (ANALYZE, VERBOSE, BUFFERS) doesn't tell you anything about how the planner decided on a plan, or what the alternatives looked like (as well as missing the data you'd need to know if cost coefficients were anywhere close to reasonable).
Speaking of cost coefficients... I'm kinda doubtful of any effort to change the default of random_page_cost that doesn't also look at the cpu_* GUCs. Even assuming sequential access is 0.01ms, the default cpu_tuple_cost of 0.01 means 100us to process a tuple. Even if that's reasonable, it also means 25us for cpu_operator_cost, which seems pretty high even for text comparisons (and is obviously absurd for int or float).
Given the pain involved with trying to manage all these coefficients I do wonder if there's any possible way to determine them empirically on any given system, perhaps using clock cycle counts. That could potentially help with #2 (and might also allow estimating what percent of IO is coming from a cache outside of shared buffers, as opposed to real IO).
On Fri, Oct 31, 2025 at 10:41 AM Bruce Momjian <bruce@momjian.us> wrote:
I thinking more about how we can improve random_page_cost, I now realize
that we will never perfectly model the caching effects, and even if we
did, the possible time gap between planning and execution would rander
it unreliable anyway, i.e., prepared queries.
I think the best we could do is to model how _volatile_ the cache is,
meaning how often are we removing and adding items to the shared buffer
cache, and somehow mix that to the random_page_cost value. That value
might be fairly stable over a longer period of time.
In my experience on OLTP systems, that volatility is effectively quite low, because these systems generally start behaving quite poorly as the critical "working set" of data starts to exceed cache (shared_buffers + filesystem). That certainly may not be true at the level of shared_buffers, and of course over time the specific pages living in cache will slowly change.
One important caveat to that though: it only applies to the (usually rather small) set of queries that are run all the time by the application. Infrequently run queries can have radically different behavior, but their performance is generally not very critical (as long as they don't impact the rest of the system).