Обсуждение: memory leak in trigger handling (since PG12)
Hi,

it seems there's a fairly annoying memory leak in trigger code,
introduced by

  commit fc22b6623b6b3bab3cb057ccd282c2bfad1a0b30
  Author: Peter Eisentraut <peter@eisentraut.org>
  Date:   Sat Mar 30 08:13:09 2019 +0100

    Generated columns
    ...

which added GetAllUpdatedColumns() and uses it many places instead of
the original GetUpdatedColumns():

   #define GetUpdatedColumns(relinfo, estate) \
       (exec_rt_fetch((relinfo)->ri_RangeTableIndex,
                          estate)->updatedCols)

   #define GetAllUpdatedColumns(relinfo, estate) \
    (bms_union(exec_rt_fetch((relinfo)->ri_RangeTableIndex,
                                 estate)->updatedCols, \
                   exec_rt_fetch((relinfo)->ri_RangeTableIndex,
                                 estate)->extraUpdatedCols))

Notice this creates a new bitmap on every calls. That's a bit of a
problem, because we call this from:

  - ExecASUpdateTriggers
  - ExecARUpdateTriggers
  - ExecBSUpdateTriggers
  - ExecBRUpdateTriggers
  - ExecUpdateLockMode

This means that for an UPDATE with triggers, we may end up calling this
for each row, possibly multiple bitmaps. And those bitmaps are allocated
in ExecutorState, so won't be freed until the end of the query :-(

The bitmaps are typically fairly small (a couple bytes), but for wider
tables it can be a couple dozen bytes. But it's primarily driven by
number of updated rows.

It's easy to leak gigabytes when updating ~10M rows. I've seen cases
with a couple tens of GBs leaked, though, but in that case it seems to
be caused by UPDATE ... FROM missing a join condition (so in fact the
memory leak is proportional to number of rows in the join result, not
the number we end up updating).

Attached is a patch, restoring the pre-12 behavior for me.


While looking for other places allocating stuff in ExecutorState (for
the UPDATE case) and leaving it there, I found two more cases:

1) copy_plpgsql_datums

2) make_expanded_record_from_tupdesc
   make_expanded_record_from_exprecord

All of this is calls from plpgsql_exec_trigger.

Fixing the copy_plpgsql_datums case seems fairly simple, the space
allocated for local copies can be freed during the cleanup. That's what
0002 does.

I'm not sure what to do about the expanded records. My understanding of
the expanded record lifecycle is fairly limited, so my (rather naive)
attempt to free the memory failed ...


I wonder how much we should care about these cases. On the one hand we
often leave the cleanup up to the memory context, but the assumption is
the context is not unnecessarily long-lived. And ExecutorState is not
that. And leaking memory per-row does not seem great either.


regards

--
Tomas Vondra
EnterpriseDB: http://www.enterprisedb.com
The Enterprise PostgreSQL Company
Вложения
Tomas Vondra <tomas.vondra@enterprisedb.com> writes:
> it seems there's a fairly annoying memory leak in trigger code,
> introduced by
> ...
> Attached is a patch, restoring the pre-12 behavior for me.

> While looking for other places allocating stuff in ExecutorState (for
> the UPDATE case) and leaving it there, I found two more cases:

> 1) copy_plpgsql_datums

> 2) make_expanded_record_from_tupdesc
>    make_expanded_record_from_exprecord

> All of this is calls from plpgsql_exec_trigger.

Not sure about the expanded-record case, but both of your other two
fixes feel like poor substitutes for pushing the memory into a
shorter-lived context.  In particular I'm quite surprised that
plpgsql isn't already allocating that workspace in the "procedure"
memory context.

> I wonder how much we should care about these cases. On the one hand we
> often leave the cleanup up to the memory context, but the assumption is
> the context is not unnecessarily long-lived. And ExecutorState is not
> that. And leaking memory per-row does not seem great either.

I agree per-row leaks in the ExecutorState context are not cool.

            regards, tom lane
Hi,

On 2023-05-23 18:23:00 +0200, Tomas Vondra wrote:
> This means that for an UPDATE with triggers, we may end up calling this
> for each row, possibly multiple bitmaps. And those bitmaps are allocated
> in ExecutorState, so won't be freed until the end of the query :-(

Ugh.


I've wondered about some form of instrumentation to detect such issues
before. It's obviously a problem that we can have fairly large leaks, like the
one you just discovered, without detecting it for a couple years. It's kinda
made worse by the memory context infrastructure, because it hides such issues.

Could it help to have a mode where the executor shutdown hook checks how much
memory is allocated in ExecutorState and warns if its too much? There's IIRC a
few places that allocate large things directly in it, but most of those
probably should be dedicated contexts anyway.  Something similar could be
useful for some other long-lived contexts.


> The bitmaps are typically fairly small (a couple bytes), but for wider
> tables it can be a couple dozen bytes. But it's primarily driven by
> number of updated rows.

Random aside: I've been wondering whether it'd be worth introducing an
in-place representation of Bitmap (e.g. if the low bit is set, the low 63 bits
are in-place, if unset, it's a pointer).


> Attached is a patch, restoring the pre-12 behavior for me.

Hm. Somehow this doesn't seem quite right. Shouldn't we try to use a shorter
lived memory context instead? Otherwise we'll just end up with the same
problem in a few years.


Greetings,

Andres Freund
Andres Freund <andres@anarazel.de> writes:
> I've wondered about some form of instrumentation to detect such issues
> before.

Yeah.

> Could it help to have a mode where the executor shutdown hook checks how much
> memory is allocated in ExecutorState and warns if its too much?

It'd be very hard to set a limit for what's "too much", since the amount
of stuff created initially will depend on the plan size.  In any case
I think that the important issue is not how much absolute space, but is
there per-row leakage.  I wonder if we could do something involving
checking for continued growth after the first retrieved tuple, or
something like that.

> Random aside: I've been wondering whether it'd be worth introducing an
> in-place representation of Bitmap (e.g. if the low bit is set, the low 63 bits
> are in-place, if unset, it's a pointer).

Why?  Unlike Lists, those things are already a single palloc chunk.

            regards, tom lane
Hi,

On 2023-05-23 13:28:30 -0400, Tom Lane wrote:
> Andres Freund <andres@anarazel.de> writes:
> > Could it help to have a mode where the executor shutdown hook checks how much
> > memory is allocated in ExecutorState and warns if its too much?
>
> It'd be very hard to set a limit for what's "too much", since the amount
> of stuff created initially will depend on the plan size.

I was thinking of some limit that should really never be reached outside of a
leak or work_mem based allocations, say 2GB or so.


> In any case I think that the important issue is not how much absolute space,
> but is there per-row leakage.  I wonder if we could do something involving
> checking for continued growth after the first retrieved tuple, or something
> like that.

As-is I some nodes do large allocations the query context, but are not
guaranteed to be reached when gathering the first row. So we would still have
to move such large allocations out of ExecutorState.


I think it might be best to go for a combination of these two
heuristics. Store the size of es_query_context after standard_ExecutorStart(),
that would include the allocation of the executor tree itself. Then in
standard_ExecutorEnd(), if the difference in size of ExecutorState is bigger
than some constant *and* is bigger than the initial size by some factor, emit
a warning.

The constant size difference avoids spurious warnings in case of a small plan
that just grows due to a few fmgr lookups or such, the factor takes care of
the plan complexity?


> > Random aside: I've been wondering whether it'd be worth introducing an
> > in-place representation of Bitmap (e.g. if the low bit is set, the low 63 bits
> > are in-place, if unset, it's a pointer).
>
> Why?  Unlike Lists, those things are already a single palloc chunk.

We do a fair amount of 8 byte allocations - they have quite a bit of overhead,
even after c6e0fe1f2a0. Not needing allocations for the common case of
bitmapsets with a max member < 63 seems like it could be worth it.

Greetings,

Andres Freund
Andres Freund <andres@anarazel.de> writes:
> On 2023-05-23 13:28:30 -0400, Tom Lane wrote:
>> Why?  Unlike Lists, those things are already a single palloc chunk.

> We do a fair amount of 8 byte allocations - they have quite a bit of overhead,
> even after c6e0fe1f2a0. Not needing allocations for the common case of
> bitmapsets with a max member < 63 seems like it could be worth it.

Oh, now I understand what you meant: use the pointer's bits as data.
Dunno that it's a good idea though.  You'd pay for the palloc savings
by needing two or four code paths in every bitmapset function, because
the need to reserve one bit would mean you couldn't readily make the
two cases look alike at the bit-pushing level.

Another big problem is that we'd have to return to treating bitmapsets
as a special-purpose thing rather than a kind of Node.  While that's
not very deeply embedded yet, I recall that the alternatives weren't
attractive.

Also, returning to the original topic: we'd never find leaks of the
sort complained of here, because they wouldn't exist in cases with
fewer than 64 relations per query (or whatever the bitmap is
representing).

            regards, tom lane
On 5/23/23 18:39, Tom Lane wrote:
> Tomas Vondra <tomas.vondra@enterprisedb.com> writes:
>> it seems there's a fairly annoying memory leak in trigger code,
>> introduced by
>> ...
>> Attached is a patch, restoring the pre-12 behavior for me.
>
>> While looking for other places allocating stuff in ExecutorState (for
>> the UPDATE case) and leaving it there, I found two more cases:
>
>> 1) copy_plpgsql_datums
>
>> 2) make_expanded_record_from_tupdesc
>>    make_expanded_record_from_exprecord
>
>> All of this is calls from plpgsql_exec_trigger.
>
> Not sure about the expanded-record case, but both of your other two
> fixes feel like poor substitutes for pushing the memory into a
> shorter-lived context.  In particular I'm quite surprised that
> plpgsql isn't already allocating that workspace in the "procedure"
> memory context.
>

I don't disagree, but which memory context should this use and
when/where should we switch to it?

I haven't seen any obvious memory context candidate in the code calling
ExecGetAllUpdatedCols, so I guess we'd have to pass it from above. Is
that a good idea for backbranches ...

regards

--
Tomas Vondra
EnterpriseDB: http://www.enterprisedb.com
The Enterprise PostgreSQL Company
On 5/23/23 19:14, Andres Freund wrote:
> Hi,
>
> On 2023-05-23 18:23:00 +0200, Tomas Vondra wrote:
>> This means that for an UPDATE with triggers, we may end up calling this
>> for each row, possibly multiple bitmaps. And those bitmaps are allocated
>> in ExecutorState, so won't be freed until the end of the query :-(
>
> Ugh.
>
>
> I've wondered about some form of instrumentation to detect such issues
> before. It's obviously a problem that we can have fairly large leaks, like the
> one you just discovered, without detecting it for a couple years. It's kinda
> made worse by the memory context infrastructure, because it hides such issues.
>
> Could it help to have a mode where the executor shutdown hook checks how much
> memory is allocated in ExecutorState and warns if its too much? There's IIRC a
> few places that allocate large things directly in it, but most of those
> probably should be dedicated contexts anyway.  Something similar could be
> useful for some other long-lived contexts.
>

Not sure such simple instrumentation would help much, unfortunately :-(

We only discovered this because the user reported OOM crashes, which
means the executor didn't get to the shutdown hook at all. Yeah, maybe
if we had such instrumentation it'd get triggered for milder cases, but
I'd bet the amount of noise is going to be significant.

For example, there's a nearby thread about hashjoin allocating buffiles
etc. in ExecutorState - we ended up moving that to a separate context,
but surely there are more such cases (not just for ExecutorState).

The really hard thing was determining what causes the memory leak - the
simple instrumentation doesn't help with that at all. It tells you there
might be a leak, but you don't know where did the allocations came from.

What I ended up doing is a simple gdb script that sets breakpoints on
all palloc/pfree variants, and prints info (including the backtrace) for
each call on ExecutorState. And then a script that aggregate those to
identify which backtraces allocated most chunks that were not freed.

This was super slow (definitely useless outside development environment)
but it made it super obvious where the root cause is.

I experimented with instrumenting the code a bit (as alternative to gdb
breakpoints) - still slow, but much faster than gdb. But perhaps useful
for special (valgrind-like) testing mode ...

Would require testing with more data, though. I doubt we'd find much
with our regression tests, which have tiny data sets.

>  ...
>
>> Attached is a patch, restoring the pre-12 behavior for me.
>
> Hm. Somehow this doesn't seem quite right. Shouldn't we try to use a shorter
> lived memory context instead? Otherwise we'll just end up with the same
> problem in a few years.
>

I agree using a shorter lived memory context would be more elegant, and
more in line with how we do things. But it's not clear to me why we'd
end up with the same problem in a few years with what the patch does.

regards

--
Tomas Vondra
EnterpriseDB: http://www.enterprisedb.com
The Enterprise PostgreSQL Company
Tomas Vondra <tomas.vondra@enterprisedb.com> writes:
> The really hard thing was determining what causes the memory leak - the
> simple instrumentation doesn't help with that at all. It tells you there
> might be a leak, but you don't know where did the allocations came from.

> What I ended up doing is a simple gdb script that sets breakpoints on
> all palloc/pfree variants, and prints info (including the backtrace) for
> each call on ExecutorState. And then a script that aggregate those to
> identify which backtraces allocated most chunks that were not freed.

FWIW, I've had some success localizing palloc memory leaks with valgrind's
leak detection mode.  The trick is to ask it for a report before the
context gets destroyed.  Beats writing your own infrastructure ...

> Would require testing with more data, though. I doubt we'd find much
> with our regression tests, which have tiny data sets.

Yeah, it's not clear whether we could make the still-hypothetical check
sensitive enough to find leaks using small test cases without getting an
unworkable number of false positives.  Still, might be worth trying.
It might be an acceptable tradeoff to have stricter rules for what can
be allocated in ExecutorState in order to make this sort of problem
more easily detectable.

            regards, tom lane
Hi, just two cents:

On Tue, May 23, 2023 at 8:01 PM Andres Freund <andres@anarazel.de> wrote:
>
> Hi,
>
> On 2023-05-23 13:28:30 -0400, Tom Lane wrote:
> > Andres Freund <andres@anarazel.de> writes:
> > > Could it help to have a mode where the executor shutdown hook checks how much
> > > memory is allocated in ExecutorState and warns if its too much?
> >
> > It'd be very hard to set a limit for what's "too much", since the amount
> > of stuff created initially will depend on the plan size.
>
> I was thinking of some limit that should really never be reached outside of a
> leak or work_mem based allocations, say 2GB or so.

RE: instrumentation subthread:
if that helps then below technique can work somewhat good on normal
binaries for end users (given there are debug symbols installed), so
maybe we don't need that much infrastructure added in to see the hot
code path:

perf probe -x /path/to/postgres 'palloc' 'size=%di:u64' # RDI on
x86_64(palloc size arg0)
perf record -avg --call-graph dwarf -e probe_postgres:palloc -aR -p
<pid> sleep 3 # cannot be longer, huge overhead (~3s=~2GB)

it produces:
    50.27%  (563d0e380670) size=24
            |
            ---palloc
               bms_copy
               ExecUpdateLockMode
               ExecBRUpdateTriggers
               ExecUpdate
[..]

    49.73%  (563d0e380670) size=16
            |
            ---palloc
               bms_copy
               RelationGetIndexAttrBitmap
               ExecUpdateLockMode
               ExecBRUpdateTriggers
               ExecUpdate
[..]

Now we know that those small palloc() are guilty, but we didn't know
at the time with Tomas. The problem here is that we do not know in
palloc() - via its own arguments for which MemoryContext this is going
to be allocated for. This is problematic for perf, because on RHEL8, I
was not able to generate an uprobe that was capable of reaching a
global variable (CurrentMemoryContext) at that time.

Additionally what was even more frustrating on diagnosing that case on
the customer end system, was that such OOMs were crashing other
PostgreSQL clusters on the same OS. Even knowing the exact guilty
statement it was impossible to limit RSS memory usage of that
particular backend. So, what you are proposing makes a lot of sense.
Also it got me thinking of implementing safety-memory-net-GUC
debug_query_limit_backend_memory=X MB that would inject
setrlimit(RLIMIT_DATA) through external extension via hook(s) and
un-set it later, but the man page states it works for mmap() only
after Linux 4.7+ so it is future proof but won't work e.g. on RHEL7 -
maybe that's still good enough?; Or, well maybe try to hack a palloc()
a little, but that has probably too big overhead, right? (just
thinking loud).

-Jakub Wartak.
On 5/23/23 23:39, Tom Lane wrote:
> Tomas Vondra <tomas.vondra@enterprisedb.com> writes:
>> The really hard thing was determining what causes the memory leak - the
>> simple instrumentation doesn't help with that at all. It tells you there
>> might be a leak, but you don't know where did the allocations came from.
>
>> What I ended up doing is a simple gdb script that sets breakpoints on
>> all palloc/pfree variants, and prints info (including the backtrace) for
>> each call on ExecutorState. And then a script that aggregate those to
>> identify which backtraces allocated most chunks that were not freed.
>
> FWIW, I've had some success localizing palloc memory leaks with valgrind's
> leak detection mode.  The trick is to ask it for a report before the
> context gets destroyed.  Beats writing your own infrastructure ...
>

I haven't tried valgrind, so can't compare.

Would it be possible to filter which memory contexts to track? Say we
know the leak is in ExecutorState, so we don't need to track allocations
in other contexts. That was a huge speedup for me, maybe it'd help
valgrind too.

Also, how did you ask for the report before context gets destroyed?

>> Would require testing with more data, though. I doubt we'd find much
>> with our regression tests, which have tiny data sets.
>
> Yeah, it's not clear whether we could make the still-hypothetical check
> sensitive enough to find leaks using small test cases without getting an
> unworkable number of false positives.  Still, might be worth trying.

I'm not against experimenting with that. Were you thinking about
something that'd be cheap enough to just be enabled always/everywhere,
or something we'd enable during testing?

This reminded me a strangeloop talk [1] [2] about the Scalene memory
profiler from UMass. That's for Python, but they did some smart tricks
to reduce the cost of profiling - maybe we could do something similar,
possibly by extending the memory contexts a bit.

[1] https://youtu.be/vVUnCXKuNOg?t=1405
[2] https://youtu.be/vVUnCXKuNOg?t=1706

> It might be an acceptable tradeoff to have stricter rules for what can
> be allocated in ExecutorState in order to make this sort of problem
> more easily detectable.
>

Would these rules be just customary, or defined/enforced in the code
somehow? I can't quite imagine how would that work, TBH.


regards

--
Tomas Vondra
EnterpriseDB: http://www.enterprisedb.com
The Enterprise PostgreSQL Company
On 5/24/23 10:19, Jakub Wartak wrote:
> Hi, just two cents:
>
> On Tue, May 23, 2023 at 8:01 PM Andres Freund <andres@anarazel.de> wrote:
>>
>> Hi,
>>
>> On 2023-05-23 13:28:30 -0400, Tom Lane wrote:
>>> Andres Freund <andres@anarazel.de> writes:
>>>> Could it help to have a mode where the executor shutdown hook checks how much
>>>> memory is allocated in ExecutorState and warns if its too much?
>>>
>>> It'd be very hard to set a limit for what's "too much", since the amount
>>> of stuff created initially will depend on the plan size.
>>
>> I was thinking of some limit that should really never be reached outside of a
>> leak or work_mem based allocations, say 2GB or so.
>
> RE: instrumentation subthread:
> if that helps then below technique can work somewhat good on normal
> binaries for end users (given there are debug symbols installed), so
> maybe we don't need that much infrastructure added in to see the hot
> code path:
>
> perf probe -x /path/to/postgres 'palloc' 'size=%di:u64' # RDI on
> x86_64(palloc size arg0)
> perf record -avg --call-graph dwarf -e probe_postgres:palloc -aR -p
> <pid> sleep 3 # cannot be longer, huge overhead (~3s=~2GB)
>
> it produces:
>     50.27%  (563d0e380670) size=24
>             |
>             ---palloc
>                bms_copy
>                ExecUpdateLockMode
>                ExecBRUpdateTriggers
>                ExecUpdate
> [..]
>
>     49.73%  (563d0e380670) size=16
>             |
>             ---palloc
>                bms_copy
>                RelationGetIndexAttrBitmap
>                ExecUpdateLockMode
>                ExecBRUpdateTriggers
>                ExecUpdate
> [..]
>
> Now we know that those small palloc() are guilty, but we didn't know
> at the time with Tomas. The problem here is that we do not know in
> palloc() - via its own arguments for which MemoryContext this is going
> to be allocated for. This is problematic for perf, because on RHEL8, I
> was not able to generate an uprobe that was capable of reaching a
> global variable (CurrentMemoryContext) at that time.
>

I think there are a couple even bigger issues:

(a) There are other methods that allocate memory - repalloc, palloc0,
MemoryContextAlloc, ... and so on. But presumably we can trace all of
them at once? We'd have to trace reset/deletes too.

(b) This doesn't say if/when the allocated chunks get freed - even with
a fix, we'll still do exactly the same number of allocations, except
that we'll free the memory shortly after that. I wonder if we could
print a bit more info for each probe, to match the alloc/free requests.

> Additionally what was even more frustrating on diagnosing that case on
> the customer end system, was that such OOMs were crashing other
> PostgreSQL clusters on the same OS. Even knowing the exact guilty
> statement it was impossible to limit RSS memory usage of that
> particular backend. So, what you are proposing makes a lot of sense.
> Also it got me thinking of implementing safety-memory-net-GUC
> debug_query_limit_backend_memory=X MB that would inject
> setrlimit(RLIMIT_DATA) through external extension via hook(s) and
> un-set it later, but the man page states it works for mmap() only
> after Linux 4.7+ so it is future proof but won't work e.g. on RHEL7 -
> maybe that's still good enough?; Or, well maybe try to hack a palloc()
> a little, but that has probably too big overhead, right? (just
> thinking loud).
>

Not sure about setting a hard limit - that seems pretty tricky and may
easily backfire. It's already possible to set such memory limit using
e.g. cgroups, or even better use VMs to isolate the instances.

I certainly agree it's annoying that when OOM hits, we end up with no
information about what used the memory. Maybe we could have a threshold
triggering a call to MemoryContextStats? So that we have at least some
memory usage info in the log in case the OOM killer intervenes.


regards

--
Tomas Vondra
EnterpriseDB: http://www.enterprisedb.com
The Enterprise PostgreSQL Company
On 5/23/23 22:57, Tomas Vondra wrote:
>
>
> On 5/23/23 18:39, Tom Lane wrote:
>> Tomas Vondra <tomas.vondra@enterprisedb.com> writes:
>>> it seems there's a fairly annoying memory leak in trigger code,
>>> introduced by
>>> ...
>>> Attached is a patch, restoring the pre-12 behavior for me.
>>
>>> While looking for other places allocating stuff in ExecutorState (for
>>> the UPDATE case) and leaving it there, I found two more cases:
>>
>>> 1) copy_plpgsql_datums
>>
>>> 2) make_expanded_record_from_tupdesc
>>>    make_expanded_record_from_exprecord
>>
>>> All of this is calls from plpgsql_exec_trigger.
>>
>> Not sure about the expanded-record case, but both of your other two
>> fixes feel like poor substitutes for pushing the memory into a
>> shorter-lived context.  In particular I'm quite surprised that
>> plpgsql isn't already allocating that workspace in the "procedure"
>> memory context.
>>
>
> I don't disagree, but which memory context should this use and
> when/where should we switch to it?
>
> I haven't seen any obvious memory context candidate in the code
> calling ExecGetAllUpdatedCols, so I guess we'd have to pass it from
> above. Is that a good idea for backbranches ...
>

I looked at this again, and I think GetPerTupleMemoryContext(estate)
might do the trick, see the 0002 part. Unfortunately it's not much
smaller/simpler than just freeing the chunks, because we end up doing

    oldcxt = MemoryContextSwitchTo(GetPerTupleMemoryContext(estate));
    updatedCols = ExecGetAllUpdatedCols(relinfo, estate);
    MemoryContextSwitchTo(oldcxt);

and then have to pass updatedCols elsewhere. It's tricky to just switch
to the context (e.g. in ExecASUpdateTriggers/ExecARUpdateTriggers), as
AfterTriggerSaveEvent allocates other bits of memory too (in a longer
lived context). So we'd have to do another switch again. Not sure how
backpatch-friendly would that be.


regards

--
Tomas Vondra
EnterpriseDB: http://www.enterprisedb.com
The Enterprise PostgreSQL Company
Вложения
Tomas Vondra <tomas.vondra@enterprisedb.com> writes:
> While looking for other places allocating stuff in ExecutorState (for
> the UPDATE case) and leaving it there, I found two more cases:

> 1) copy_plpgsql_datums

> 2) make_expanded_record_from_tupdesc
>    make_expanded_record_from_exprecord

> All of this is calls from plpgsql_exec_trigger.

Can you show a test case in which this happens?  I added some
instrumentation and verified at least within our regression tests,
copy_plpgsql_datums' CurrentMemoryContext is always plpgsql's
"SPI Proc" context, so I do not see how there can be a query-lifespan
leak there, nor how your 0003 would fix it if there is.

            regards, tom lane
Tomas Vondra <tomas.vondra@enterprisedb.com> writes:
> On 5/23/23 23:39, Tom Lane wrote:
>> FWIW, I've had some success localizing palloc memory leaks with valgrind's
>> leak detection mode.  The trick is to ask it for a report before the
>> context gets destroyed.  Beats writing your own infrastructure ...

> I haven't tried valgrind, so can't compare.
> Would it be possible to filter which memory contexts to track? Say we
> know the leak is in ExecutorState, so we don't need to track allocations
> in other contexts. That was a huge speedup for me, maybe it'd help
> valgrind too.

I don't think valgrind has a way to do that, but this'd be something you
set up specially in any case.

> Also, how did you ask for the report before context gets destroyed?

There are several valgrind client requests that could be helpful:

/* Do a full memory leak check (like --leak-check=full) mid-execution. */
#define VALGRIND_DO_LEAK_CHECK                                   \
    VALGRIND_DO_CLIENT_REQUEST_STMT(VG_USERREQ__DO_LEAK_CHECK,   \
                                    0, 0, 0, 0, 0)

/* Same as VALGRIND_DO_LEAK_CHECK but only showing the entries for
   which there was an increase in leaked bytes or leaked nr of blocks
   since the previous leak search. */
#define VALGRIND_DO_ADDED_LEAK_CHECK                            \
    VALGRIND_DO_CLIENT_REQUEST_STMT(VG_USERREQ__DO_LEAK_CHECK,  \
                                    0, 1, 0, 0, 0)

/* Return number of leaked, dubious, reachable and suppressed bytes found by
   all previous leak checks.  They must be lvalues.  */
#define VALGRIND_COUNT_LEAK_BLOCKS(leaked, dubious, reachable, suppressed) \

Putting VALGRIND_DO_ADDED_LEAK_CHECK someplace in the executor loop would
help narrow things down pretty quickly, assuming you had a self-contained
example demonstrating the leak.  I don't recall exactly how I used these
but it was something along that line.

>> Yeah, it's not clear whether we could make the still-hypothetical check
>> sensitive enough to find leaks using small test cases without getting an
>> unworkable number of false positives.  Still, might be worth trying.

> I'm not against experimenting with that. Were you thinking about
> something that'd be cheap enough to just be enabled always/everywhere,
> or something we'd enable during testing?

We seem to have already paid the overhead of counting all palloc
allocations, so I don't think it'd be too expensive to occasionally check
the ExecutorState's mem_allocated and see if it's growing (especially
if we only do so in assert-enabled builds).  The trick is to define the
rules for what's worth reporting.

>> It might be an acceptable tradeoff to have stricter rules for what can
>> be allocated in ExecutorState in order to make this sort of problem
>> more easily detectable.

> Would these rules be just customary, or defined/enforced in the code
> somehow? I can't quite imagine how would that work, TBH.

If the check bleated "WARNING: possible executor memory leak" during
regression testing, people would soon become conditioned to doing
whatever they have to do to avoid it ;-)

            regards, tom lane
On 5/24/23 17:37, Tom Lane wrote:
> Tomas Vondra <tomas.vondra@enterprisedb.com> writes:
>> While looking for other places allocating stuff in ExecutorState (for
>> the UPDATE case) and leaving it there, I found two more cases:
>
>> 1) copy_plpgsql_datums
>
>> 2) make_expanded_record_from_tupdesc
>>    make_expanded_record_from_exprecord
>
>> All of this is calls from plpgsql_exec_trigger.
>
> Can you show a test case in which this happens?  I added some
> instrumentation and verified at least within our regression tests,
> copy_plpgsql_datums' CurrentMemoryContext is always plpgsql's
> "SPI Proc" context, so I do not see how there can be a query-lifespan
> leak there, nor how your 0003 would fix it if there is.
>

Interesting. I tried to reproduce it, but without success, and it passes
even with an assert on the context name. The only explanation I have is
that the gdb script I used might have been a bit broken - it used
conditional breakpoints like this one:

  break AllocSetAlloc if strcmp(((MemoryContext) $rdi)->name, \
                                "ExecutorState") == 0
  commands
  bt
  cont
  end

but I just noticed gdb sometimes complains about this:

  Error in testing breakpoint condition:
  '__strcmp_avx2' has unknown return type; cast the call to its declared
  return type

The breakpoint still fires all the commands, which is pretty surprising
behavior, but that might explain why I saw copy_plpgsql_data as another
culprit. And I suspect the make_expanded_record calls might be caused by
the same thing.

I'll check deeper tomorrow, when I get access to the original script
etc. We can ignore these cases until then.

Sorry for the confusion :-/


regards

--
Tomas Vondra
EnterpriseDB: http://www.enterprisedb.com
The Enterprise PostgreSQL Company
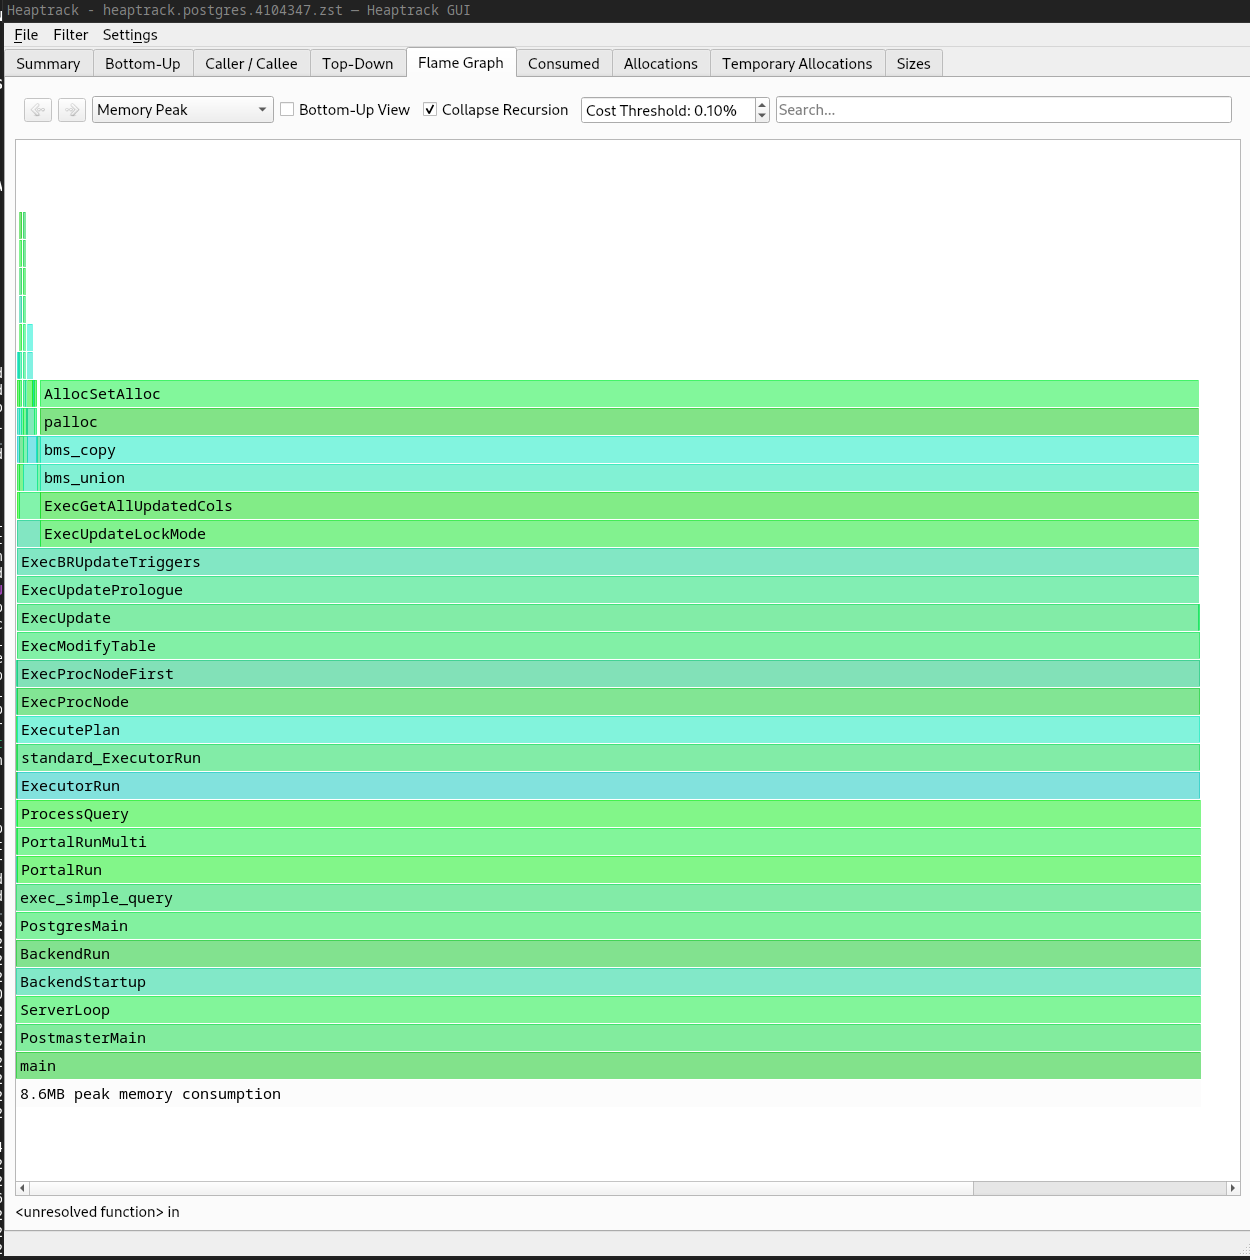
Hi,

On 2023-05-23 23:26:42 +0200, Tomas Vondra wrote:
> On 5/23/23 19:14, Andres Freund wrote:
> > Hi,
> >
> > On 2023-05-23 18:23:00 +0200, Tomas Vondra wrote:
> >> This means that for an UPDATE with triggers, we may end up calling this
> >> for each row, possibly multiple bitmaps. And those bitmaps are allocated
> >> in ExecutorState, so won't be freed until the end of the query :-(
> >
> > Ugh.
> >
> >
> > I've wondered about some form of instrumentation to detect such issues
> > before. It's obviously a problem that we can have fairly large leaks, like the
> > one you just discovered, without detecting it for a couple years. It's kinda
> > made worse by the memory context infrastructure, because it hides such issues.
> >
> > Could it help to have a mode where the executor shutdown hook checks how much
> > memory is allocated in ExecutorState and warns if its too much? There's IIRC a
> > few places that allocate large things directly in it, but most of those
> > probably should be dedicated contexts anyway.  Something similar could be
> > useful for some other long-lived contexts.
> >
>
> Not sure such simple instrumentation would help much, unfortunately :-(
>
> We only discovered this because the user reported OOM crashes, which
> means the executor didn't get to the shutdown hook at all. Yeah, maybe
> if we had such instrumentation it'd get triggered for milder cases, but
> I'd bet the amount of noise is going to be significant.
>
> For example, there's a nearby thread about hashjoin allocating buffiles
> etc. in ExecutorState - we ended up moving that to a separate context,
> but surely there are more such cases (not just for ExecutorState).

Yes, that's why I said that we would have to more of those into dedicated
contexts - which is a good idea independent of this issue.


> The really hard thing was determining what causes the memory leak - the
> simple instrumentation doesn't help with that at all. It tells you there
> might be a leak, but you don't know where did the allocations came from.
>
> What I ended up doing is a simple gdb script that sets breakpoints on
> all palloc/pfree variants, and prints info (including the backtrace) for
> each call on ExecutorState. And then a script that aggregate those to
> identify which backtraces allocated most chunks that were not freed.

FWIW, for things like this I found "heaptrack" to be extremely helpful.

E.g. for a reproducer of the problem here, it gave me the attach "flame graph"
of the peak memory usage - after attaching to a running backend and running an
UPDATE triggering the leak..

Because the view I screenshotted shows the stacks contributing to peak memory
usage, it works nicely to find "temporary leaks", even if memory is actually
freed after all etc.


> > Hm. Somehow this doesn't seem quite right. Shouldn't we try to use a shorter
> > lived memory context instead? Otherwise we'll just end up with the same
> > problem in a few years.
> >
>
> I agree using a shorter lived memory context would be more elegant, and
> more in line with how we do things. But it's not clear to me why we'd
> end up with the same problem in a few years with what the patch does.

Because it sets up the pattern of manual memory management and continues to
run the relevant code within a query-lifetime context.

Greetings,

Andres Freund
Вложения
Hi,

On 2023-05-24 15:38:41 +0200, Tomas Vondra wrote:
> I looked at this again, and I think GetPerTupleMemoryContext(estate)
> might do the trick, see the 0002 part.

Yea, that seems like the right thing here.


> Unfortunately it's not much
> smaller/simpler than just freeing the chunks, because we end up doing
>
>     oldcxt = MemoryContextSwitchTo(GetPerTupleMemoryContext(estate));
>     updatedCols = ExecGetAllUpdatedCols(relinfo, estate);
>     MemoryContextSwitchTo(oldcxt);

We could add a variant of ExecGetAllUpdatedCols that switches the context.


> and then have to pass updatedCols elsewhere. It's tricky to just switch
> to the context (e.g. in ExecASUpdateTriggers/ExecARUpdateTriggers), as
> AfterTriggerSaveEvent allocates other bits of memory too (in a longer
> lived context).

Hm - on a quick look the allocations in trigger.c itself are done with
MemoryContextAlloc().

I did find a problematic path, namely that ExecGetChildToRootMap() ends up
building resultRelInfo->ri_ChildToRootMap in CurrentMemoryContext.

That seems like a flat out bug to me - we can't just store data in a
ResultRelInfo without ensuring the memory is lives long enough. Nearby places
like ExecGetRootToChildMap() do make sure to switch to es_query_cxt.


Did you see other bits of memory getting allocated in CurrentMemoryContext?


> So we'd have to do another switch again. Not sure how
> backpatch-friendly would that be.

Yea, that's a valid concern. I think it might be reasonable to use something
like ExecGetAllUpdatedColsCtx() in the backbranches, and switch to a
short-lived context for the trigger invocations in >= 16.

Greetings,

Andres Freund
On 5/24/23 20:55, Andres Freund wrote:
> Hi,
>
> On 2023-05-24 15:38:41 +0200, Tomas Vondra wrote:
>> I looked at this again, and I think GetPerTupleMemoryContext(estate)
>> might do the trick, see the 0002 part.
>
> Yea, that seems like the right thing here.
>
>
>> Unfortunately it's not much
>> smaller/simpler than just freeing the chunks, because we end up doing
>>
>>     oldcxt = MemoryContextSwitchTo(GetPerTupleMemoryContext(estate));
>>     updatedCols = ExecGetAllUpdatedCols(relinfo, estate);
>>     MemoryContextSwitchTo(oldcxt);
>
> We could add a variant of ExecGetAllUpdatedCols that switches the context.
>

Yeah, we could do that. I was thinking about backpatching, and modifying
 ExecGetAllUpdatedCols signature would be ABI break, but adding a
variant should be fine.

>
>> and then have to pass updatedCols elsewhere. It's tricky to just switch
>> to the context (e.g. in ExecASUpdateTriggers/ExecARUpdateTriggers), as
>> AfterTriggerSaveEvent allocates other bits of memory too (in a longer
>> lived context).
>
> Hm - on a quick look the allocations in trigger.c itself are done with
> MemoryContextAlloc().
>
> I did find a problematic path, namely that ExecGetChildToRootMap() ends up
> building resultRelInfo->ri_ChildToRootMap in CurrentMemoryContext.
>
> That seems like a flat out bug to me - we can't just store data in a
> ResultRelInfo without ensuring the memory is lives long enough. Nearby places
> like ExecGetRootToChildMap() do make sure to switch to es_query_cxt.
>
>
> Did you see other bits of memory getting allocated in CurrentMemoryContext?
>

No, I simply tried to do the context switch and then gave up when it
crashed on the ExecGetRootToChildMap info. I haven't looked much
further, but you may be right it's the only bit.

It didn't occur to me it might be a bug - I think the code simply
assumes it gets called with suitable memory context, just like we do in
various other places. Maybe it should document the assumption.

>
>> So we'd have to do another switch again. Not sure how
>> backpatch-friendly would that be.
>
> Yea, that's a valid concern. I think it might be reasonable to use something
> like ExecGetAllUpdatedColsCtx() in the backbranches, and switch to a
> short-lived context for the trigger invocations in >= 16.
>

WFM


regards

--
Tomas Vondra
EnterpriseDB: http://www.enterprisedb.com
The Enterprise PostgreSQL Company
Hi,

On 2023-05-23 18:23:00 +0200, Tomas Vondra wrote:
> While looking for other places allocating stuff in ExecutorState (for
> the UPDATE case) and leaving it there, I found two more cases:

For a bit I thought there was a similar problem in ExecWithCheckOptions() -
but we error out immediately afterwards, so there's no danger of accumulating
memory.


I find it quite depressing that we have at least four copies of:

    /*
     * If the tuple has been routed, it's been converted to the partition's
     * rowtype, which might differ from the root table's.  We must convert it
     * back to the root table's rowtype so that val_desc in the error message
     * matches the input tuple.
     */
    if (resultRelInfo->ri_RootResultRelInfo)
    {
        ResultRelInfo *rootrel = resultRelInfo->ri_RootResultRelInfo;
        TupleDesc    old_tupdesc;
        AttrMap    *map;

        root_relid = RelationGetRelid(rootrel->ri_RelationDesc);
        tupdesc = RelationGetDescr(rootrel->ri_RelationDesc);

        old_tupdesc = RelationGetDescr(resultRelInfo->ri_RelationDesc);
        /* a reverse map */
        map = build_attrmap_by_name_if_req(old_tupdesc, tupdesc, false);

        /*
         * Partition-specific slot's tupdesc can't be changed, so allocate a
         * new one.
         */
        if (map != NULL)
            slot = execute_attr_map_slot(map, slot,
                                         MakeTupleTableSlot(tupdesc, &TTSOpsVirtual));
        modifiedCols = bms_union(ExecGetInsertedCols(rootrel, estate),
                                 ExecGetUpdatedCols(rootrel, estate));
    }


Once in ExecPartitionCheckEmitError(), *twice* in ExecConstraints(),
ExecWithCheckOptions(). Some of the partitioning stuff has been added in a
really myopic way.

Greetings,

Andres Freund
On 5/24/23 20:14, Andres Freund wrote:
> Hi,
>
> On 2023-05-23 23:26:42 +0200, Tomas Vondra wrote:
>> On 5/23/23 19:14, Andres Freund wrote:
>>> Hi,
>>>
>>> On 2023-05-23 18:23:00 +0200, Tomas Vondra wrote:
>>>> This means that for an UPDATE with triggers, we may end up calling this
>>>> for each row, possibly multiple bitmaps. And those bitmaps are allocated
>>>> in ExecutorState, so won't be freed until the end of the query :-(
>>>
>>> Ugh.
>>>
>>>
>>> I've wondered about some form of instrumentation to detect such issues
>>> before. It's obviously a problem that we can have fairly large leaks, like the
>>> one you just discovered, without detecting it for a couple years. It's kinda
>>> made worse by the memory context infrastructure, because it hides such issues.
>>>
>>> Could it help to have a mode where the executor shutdown hook checks how much
>>> memory is allocated in ExecutorState and warns if its too much? There's IIRC a
>>> few places that allocate large things directly in it, but most of those
>>> probably should be dedicated contexts anyway.  Something similar could be
>>> useful for some other long-lived contexts.
>>>
>>
>> Not sure such simple instrumentation would help much, unfortunately :-(
>>
>> We only discovered this because the user reported OOM crashes, which
>> means the executor didn't get to the shutdown hook at all. Yeah, maybe
>> if we had such instrumentation it'd get triggered for milder cases, but
>> I'd bet the amount of noise is going to be significant.
>>
>> For example, there's a nearby thread about hashjoin allocating buffiles
>> etc. in ExecutorState - we ended up moving that to a separate context,
>> but surely there are more such cases (not just for ExecutorState).
>
> Yes, that's why I said that we would have to more of those into dedicated
> contexts - which is a good idea independent of this issue.
>

Yeah, I think that's a good idea in principle.

>
>> The really hard thing was determining what causes the memory leak - the
>> simple instrumentation doesn't help with that at all. It tells you there
>> might be a leak, but you don't know where did the allocations came from.
>>
>> What I ended up doing is a simple gdb script that sets breakpoints on
>> all palloc/pfree variants, and prints info (including the backtrace) for
>> each call on ExecutorState. And then a script that aggregate those to
>> identify which backtraces allocated most chunks that were not freed.
>
> FWIW, for things like this I found "heaptrack" to be extremely helpful.
>
> E.g. for a reproducer of the problem here, it gave me the attach "flame graph"
> of the peak memory usage - after attaching to a running backend and running an
> UPDATE triggering the leak..
>
> Because the view I screenshotted shows the stacks contributing to peak memory
> usage, it works nicely to find "temporary leaks", even if memory is actually
> freed after all etc.
>

That's a nice visualization, but isn't that useful only once you
determine there's a memory leak? Which I think is the hard problem.

>
>
>>> Hm. Somehow this doesn't seem quite right. Shouldn't we try to use a shorter
>>> lived memory context instead? Otherwise we'll just end up with the same
>>> problem in a few years.
>>>
>>
>> I agree using a shorter lived memory context would be more elegant, and
>> more in line with how we do things. But it's not clear to me why we'd
>> end up with the same problem in a few years with what the patch does.
>
> Because it sets up the pattern of manual memory management and continues to
> run the relevant code within a query-lifetime context.
>

Oh, you mean someone might add new allocations to this code (or into one
of the functions executed from it), and that'd leak again? Yeah, true.


regards

--
Tomas Vondra
EnterpriseDB: http://www.enterprisedb.com
The Enterprise PostgreSQL Company
Hi,

On 2023-05-24 21:49:13 +0200, Tomas Vondra wrote:
> >> and then have to pass updatedCols elsewhere. It's tricky to just switch
> >> to the context (e.g. in ExecASUpdateTriggers/ExecARUpdateTriggers), as
> >> AfterTriggerSaveEvent allocates other bits of memory too (in a longer
> >> lived context).
> >
> > Hm - on a quick look the allocations in trigger.c itself are done with
> > MemoryContextAlloc().
> >
> > I did find a problematic path, namely that ExecGetChildToRootMap() ends up
> > building resultRelInfo->ri_ChildToRootMap in CurrentMemoryContext.
> >
> > That seems like a flat out bug to me - we can't just store data in a
> > ResultRelInfo without ensuring the memory is lives long enough. Nearby places
> > like ExecGetRootToChildMap() do make sure to switch to es_query_cxt.
> >
> >
> > Did you see other bits of memory getting allocated in CurrentMemoryContext?
> >
>
> No, I simply tried to do the context switch and then gave up when it
> crashed on the ExecGetRootToChildMap info. I haven't looked much
> further, but you may be right it's the only bit.
>
> It didn't occur to me it might be a bug - I think the code simply
> assumes it gets called with suitable memory context, just like we do in
> various other places. Maybe it should document the assumption.

I think architecturally, code storing stuff in a ResultRelInfo - which has
query lifetime - ought to be careful to allocate memory with such lifetime.
Note that the nearby ExecGetRootToChildMap() actually is careful to do so.


> >> So we'd have to do another switch again. Not sure how
> >> backpatch-friendly would that be.
> >
> > Yea, that's a valid concern. I think it might be reasonable to use something
> > like ExecGetAllUpdatedColsCtx() in the backbranches, and switch to a
> > short-lived context for the trigger invocations in >= 16.


Hm - stepping back a bit, why are we doing the work in ExecGetAllUpdatedCols()
over and over?  Unless I am missing something, the result doesn't change
across rows. And it doesn't look that cheap to compute, leaving aside the
allocation that bms_union() does.

It's visible in profiles, not as a top entry, but still.

Perhaps the easiest to backpatch fix is to just avoid recomputing the value?
But perhaps it'd be just as problmeatic, because callers might modify
ExecGetAllUpdatedCols()'s return value in place...

Greetings,

Andres Freund
Hi,

On 2023-05-24 21:56:22 +0200, Tomas Vondra wrote:
> >> The really hard thing was determining what causes the memory leak - the
> >> simple instrumentation doesn't help with that at all. It tells you there
> >> might be a leak, but you don't know where did the allocations came from.
> >>
> >> What I ended up doing is a simple gdb script that sets breakpoints on
> >> all palloc/pfree variants, and prints info (including the backtrace) for
> >> each call on ExecutorState. And then a script that aggregate those to
> >> identify which backtraces allocated most chunks that were not freed.
> >
> > FWIW, for things like this I found "heaptrack" to be extremely helpful.
> >
> > E.g. for a reproducer of the problem here, it gave me the attach "flame graph"
> > of the peak memory usage - after attaching to a running backend and running an
> > UPDATE triggering the leak..
> >
> > Because the view I screenshotted shows the stacks contributing to peak memory
> > usage, it works nicely to find "temporary leaks", even if memory is actually
> > freed after all etc.
> >
>
> That's a nice visualization, but isn't that useful only once you
> determine there's a memory leak? Which I think is the hard problem.

So is your gdb approach, unless I am misunderstanding? The view I
screenshotted shows the "peak" allocated memory, if you have a potential leak,
you can see where most of the allocated memory was allocated. Which at least
provides you with a good idea of where to look for a problem in more detail.


> >>> Hm. Somehow this doesn't seem quite right. Shouldn't we try to use a shorter
> >>> lived memory context instead? Otherwise we'll just end up with the same
> >>> problem in a few years.
> >>>
> >>
> >> I agree using a shorter lived memory context would be more elegant, and
> >> more in line with how we do things. But it's not clear to me why we'd
> >> end up with the same problem in a few years with what the patch does.
> >
> > Because it sets up the pattern of manual memory management and continues to
> > run the relevant code within a query-lifetime context.
> >
>
> Oh, you mean someone might add new allocations to this code (or into one
> of the functions executed from it), and that'd leak again? Yeah, true.

Yes. It's certainly not obvious this far down that we are called in a
semi-long-lived memory context.

Greetings,

Andres Freund
On 5/24/23 22:22, Andres Freund wrote:
> Hi,
>
> On 2023-05-24 21:56:22 +0200, Tomas Vondra wrote:
>>>> The really hard thing was determining what causes the memory leak - the
>>>> simple instrumentation doesn't help with that at all. It tells you there
>>>> might be a leak, but you don't know where did the allocations came from.
>>>>
>>>> What I ended up doing is a simple gdb script that sets breakpoints on
>>>> all palloc/pfree variants, and prints info (including the backtrace) for
>>>> each call on ExecutorState. And then a script that aggregate those to
>>>> identify which backtraces allocated most chunks that were not freed.
>>>
>>> FWIW, for things like this I found "heaptrack" to be extremely helpful.
>>>
>>> E.g. for a reproducer of the problem here, it gave me the attach "flame graph"
>>> of the peak memory usage - after attaching to a running backend and running an
>>> UPDATE triggering the leak..
>>>
>>> Because the view I screenshotted shows the stacks contributing to peak memory
>>> usage, it works nicely to find "temporary leaks", even if memory is actually
>>> freed after all etc.
>>>
>>
>> That's a nice visualization, but isn't that useful only once you
>> determine there's a memory leak? Which I think is the hard problem.
>
> So is your gdb approach, unless I am misunderstanding? The view I
> screenshotted shows the "peak" allocated memory, if you have a potential leak,
> you can see where most of the allocated memory was allocated. Which at least
> provides you with a good idea of where to look for a problem in more detail.
>

Right, it wasn't my ambition to detect memory leaks but to source of the
leak if there's one. I got a bit distracted by the discussion detecting
leaks etc.

>
>>>>> Hm. Somehow this doesn't seem quite right. Shouldn't we try to use a shorter
>>>>> lived memory context instead? Otherwise we'll just end up with the same
>>>>> problem in a few years.
>>>>>
>>>>
>>>> I agree using a shorter lived memory context would be more elegant, and
>>>> more in line with how we do things. But it's not clear to me why we'd
>>>> end up with the same problem in a few years with what the patch does.
>>>
>>> Because it sets up the pattern of manual memory management and continues to
>>> run the relevant code within a query-lifetime context.
>>>
>>
>> Oh, you mean someone might add new allocations to this code (or into one
>> of the functions executed from it), and that'd leak again? Yeah, true.
>
> Yes. It's certainly not obvious this far down that we are called in a
> semi-long-lived memory context.
>

That's true, but I don't see how adding a ExecGetAllUpdatedCols()
variant that allocates stuff in a short-lived context improves this.
That'll only cover memory allocated in ExecGetAllUpdatedCols() and
nothing else.

regards

--
Tomas Vondra
EnterpriseDB: http://www.enterprisedb.com
The Enterprise PostgreSQL Company
On 5/24/23 21:49, Tomas Vondra wrote:
>
>
> On 5/24/23 20:55, Andres Freund wrote:
>> Hi,
>>
>> On 2023-05-24 15:38:41 +0200, Tomas Vondra wrote:
>>> I looked at this again, and I think GetPerTupleMemoryContext(estate)
>>> might do the trick, see the 0002 part.
>>
>> Yea, that seems like the right thing here.
>>
>>
>>> Unfortunately it's not much
>>> smaller/simpler than just freeing the chunks, because we end up doing
>>>
>>>     oldcxt = MemoryContextSwitchTo(GetPerTupleMemoryContext(estate));
>>>     updatedCols = ExecGetAllUpdatedCols(relinfo, estate);
>>>     MemoryContextSwitchTo(oldcxt);
>>
>> We could add a variant of ExecGetAllUpdatedCols that switches the context.
>>
>
> Yeah, we could do that. I was thinking about backpatching, and modifying
>  ExecGetAllUpdatedCols signature would be ABI break, but adding a
> variant should be fine.
>
>>
>>> and then have to pass updatedCols elsewhere. It's tricky to just switch
>>> to the context (e.g. in ExecASUpdateTriggers/ExecARUpdateTriggers), as
>>> AfterTriggerSaveEvent allocates other bits of memory too (in a longer
>>> lived context).
>>
>> Hm - on a quick look the allocations in trigger.c itself are done with
>> MemoryContextAlloc().
>>
>> I did find a problematic path, namely that ExecGetChildToRootMap() ends up
>> building resultRelInfo->ri_ChildToRootMap in CurrentMemoryContext.
>>
>> That seems like a flat out bug to me - we can't just store data in a
>> ResultRelInfo without ensuring the memory is lives long enough. Nearby places
>> like ExecGetRootToChildMap() do make sure to switch to es_query_cxt.
>>
>>
>> Did you see other bits of memory getting allocated in CurrentMemoryContext?
>>
>
> No, I simply tried to do the context switch and then gave up when it
> crashed on the ExecGetRootToChildMap info. I haven't looked much
> further, but you may be right it's the only bit.
>
> It didn't occur to me it might be a bug - I think the code simply
> assumes it gets called with suitable memory context, just like we do in
> various other places. Maybe it should document the assumption.
>
>>
>>> So we'd have to do another switch again. Not sure how
>>> backpatch-friendly would that be.
>>
>> Yea, that's a valid concern. I think it might be reasonable to use something
>> like ExecGetAllUpdatedColsCtx() in the backbranches, and switch to a
>> short-lived context for the trigger invocations in >= 16.
>>
>

The attached patch does this - I realized we actually have estate in
ExecGetAllUpdatedCols(), so we don't even need a variant with a
different signature. That makes the patch much simpler.

The question is whether we need the signature anyway. There might be a
caller expecting the result to be in CurrentMemoryContext (be it
ExecutorState or something else), and this change might break it. But
I'm not aware of any callers, so maybe that's fine.


regards

--
Tomas Vondra
EnterpriseDB: http://www.enterprisedb.com
The Enterprise PostgreSQL Company
Вложения
On 5/24/23 22:19, Andres Freund wrote:
>
> ...
>
> Hm - stepping back a bit, why are we doing the work in ExecGetAllUpdatedCols()
> over and over?  Unless I am missing something, the result doesn't change
> across rows. And it doesn't look that cheap to compute, leaving aside the
> allocation that bms_union() does.
>
> It's visible in profiles, not as a top entry, but still.
>
> Perhaps the easiest to backpatch fix is to just avoid recomputing the value?
> But perhaps it'd be just as problmeatic, because callers might modify
> ExecGetAllUpdatedCols()'s return value in place...
>

Yes, I think that's a perfectly valid point - I was actually wondering
about that too, but I was focused on fixing this in backbranches so I
left this as a future optimization (assuming it can be cached).


regards

--
Tomas Vondra
EnterpriseDB: http://www.enterprisedb.com
The Enterprise PostgreSQL Company
On 5/25/23 16:41, Tomas Vondra wrote:
> ...
>
> The attached patch does this - I realized we actually have estate in
> ExecGetAllUpdatedCols(), so we don't even need a variant with a
> different signature. That makes the patch much simpler.
>
> The question is whether we need the signature anyway. There might be a
> caller expecting the result to be in CurrentMemoryContext (be it
> ExecutorState or something else), and this change might break it. But
> I'm not aware of any callers, so maybe that's fine.
>

I've just pushed a fix along these lines, with a comment explaining that
the caller is expected to copy the bitmap into a different context if
per-tuple context is not sufficient.

IMHO this is the simplest backpatchable solution, and I haven't found
any callers that'd need to do that.

I agree with the idea not to calculate the bitmap over and over, but
that's clearly not backpatchable so it's a matter for separate patch.


regards

--
Tomas Vondra
EnterpriseDB: http://www.enterprisedb.com
The Enterprise PostgreSQL Company
Tomas Vondra писал 2023-05-25 17:41:

> The attached patch does this - I realized we actually have estate in
> ExecGetAllUpdatedCols(), so we don't even need a variant with a
> different signature. That makes the patch much simpler.
>
> The question is whether we need the signature anyway. There might be a
> caller expecting the result to be in CurrentMemoryContext (be it
> ExecutorState or something else), and this change might break it. But
> I'm not aware of any callers, so maybe that's fine.
>

Hi.
Unfortunately, this patch has broken trigdata->tg_updatedcols usage in
AFTER UPDATE triggers.
Should it be if not fixed, but at least mentioned in documentation?

Attaching sample code. After creating trigger, an issue can be
reproduced as this:

create table test (i int, j int);
create function report_update_fields() RETURNS TRIGGER AS
'/location/to/trig_test.so' language C;
create trigger test_update after update ON test FOR EACH ROW EXECUTE
FUNCTION report_update_fields();
insert into test values (1, 12);
update test set j=2;

--
Best regards,
Alexander Pyhalov,
Postgres Professional
Вложения
On 6/22/23 13:07, Alexander Pyhalov wrote:
> Tomas Vondra писал 2023-05-25 17:41:
>
>> The attached patch does this - I realized we actually have estate in
>> ExecGetAllUpdatedCols(), so we don't even need a variant with a
>> different signature. That makes the patch much simpler.
>>
>> The question is whether we need the signature anyway. There might be a
>> caller expecting the result to be in CurrentMemoryContext (be it
>> ExecutorState or something else), and this change might break it. But
>> I'm not aware of any callers, so maybe that's fine.
>>
>
> Hi.
> Unfortunately, this patch has broken trigdata->tg_updatedcols usage in
> AFTER UPDATE triggers.
> Should it be if not fixed, but at least mentioned in documentation?
>

That's clearly a bug, we can't just break stuff like that.

> Attaching sample code. After creating trigger, an issue can be
> reproduced as this:
>
> create table test (i int, j int);
> create function report_update_fields() RETURNS TRIGGER AS
> '/location/to/trig_test.so' language C;
> create trigger test_update after update ON test FOR EACH ROW EXECUTE
> FUNCTION report_update_fields();
> insert into test values (1, 12);
> update test set j=2;
>

I haven't tried the reproducer, but I think I see the issue - we store
the bitmap as part of the event to be executed later, but the bitmap is
in per-tuple context and gets reset. So I guess we need to copy it into
the proper long-lived context (e.g. AfterTriggerEvents).

I'll get that fixed.

Anyway, this probably hints we should not recalculate the bitmap over
and over, but calculate it once and keep it for all events. Not
something we can do in backbranches, though.


regards

--
Tomas Vondra
EnterpriseDB: http://www.enterprisedb.com
The Enterprise PostgreSQL Company
On 6/22/23 13:46, Tomas Vondra wrote:
> ...
>
> I haven't tried the reproducer, but I think I see the issue - we store
> the bitmap as part of the event to be executed later, but the bitmap is
> in per-tuple context and gets reset. So I guess we need to copy it into
> the proper long-lived context (e.g. AfterTriggerEvents).
>
> I'll get that fixed.
>

Alexander, can you try if this fixes the issue for you?


regard

--
Tomas Vondra
EnterpriseDB: http://www.enterprisedb.com
The Enterprise PostgreSQL Company
Вложения
Tomas Vondra писал 2023-06-22 17:16:
> On 6/22/23 13:46, Tomas Vondra wrote:
>> ...
>>
>> I haven't tried the reproducer, but I think I see the issue - we store
>> the bitmap as part of the event to be executed later, but the bitmap
>> is
>> in per-tuple context and gets reset. So I guess we need to copy it
>> into
>> the proper long-lived context (e.g. AfterTriggerEvents).
>>
>> I'll get that fixed.
>>
>
> Alexander, can you try if this fixes the issue for you?
>
>
> regard

Hi.
The patch fixes the problem and looks good to me.
--
Best regards,
Alexander Pyhalov,
Postgres Professional
On 6/23/23 08:03, Alexander Pyhalov wrote:
> Tomas Vondra писал 2023-06-22 17:16:
>> On 6/22/23 13:46, Tomas Vondra wrote:
>>> ...
>>>
>>> I haven't tried the reproducer, but I think I see the issue - we store
>>> the bitmap as part of the event to be executed later, but the bitmap is
>>> in per-tuple context and gets reset. So I guess we need to copy it into
>>> the proper long-lived context (e.g. AfterTriggerEvents).
>>>
>>> I'll get that fixed.
>>>
>>
>> Alexander, can you try if this fixes the issue for you?
>>
>>
>> regard
>
> Hi.
> The patch fixes the problem and looks good to me.

Thanks, I've pushed the fix, including backpatch to 13+ (12 is not
affected by the oversight, the bitmap was added by 71d60e2aa0).

I think it'd be good to investigate if it's possible to compute the
bitmap only once - as already suggested by Andres, but that's a matter
for separate patch, not a bugfix.

regards

--
Tomas Vondra
EnterpriseDB: http://www.enterprisedb.com
The Enterprise PostgreSQL Company