Обсуждение: Trouble with hashagg spill I/O pattern and costing
Hi,
I've been running some TPC-H benchmarks on master, to check if there's
something unexpected, and I ran into some annoying issues with Q17 and
Q20. I'll use Q17 as it's a bit simpler.
I think there are two related problem - with costing and with excessive
I/O due to using logical tapes.
Let's talk about the costing first. On 75GB scale (with disabled parallel
query), the execution plan looks like this:
QUERY PLAN
---------------------------------------------------------------------------------------------------------------
Limit (cost=16997740.10..16997740.12 rows=1 width=32)
-> Aggregate (cost=16997740.10..16997740.12 rows=1 width=32)
-> Nested Loop (cost=14204895.82..16997574.11 rows=66397 width=8)
Join Filter: (part.p_partkey = lineitem.l_partkey)
-> Hash Join (cost=14204895.25..16251060.84 rows=6640 width=40)
Hash Cond: (lineitem_1.l_partkey = part.p_partkey)
-> HashAggregate (cost=13977751.34..15945557.39 rows=6206695 width=36)
Group Key: lineitem_1.l_partkey
Planned Partitions: 128
-> Seq Scan on lineitem lineitem_1 (cost=0.00..5519079.56 rows=191969856 width=9)
-> Hash (cost=227058.33..227058.33 rows=6846 width=4)
-> Seq Scan on part (cost=0.00..227058.33 rows=6846 width=4)
Filter: ((p_brand = 'Brand#22'::bpchar) AND (p_container = 'LG BOX'::bpchar))
-> Index Scan using idx_lineitem_part_supp on lineitem (cost=0.57..112.30 rows=10 width=17)
Index Cond: (l_partkey = lineitem_1.l_partkey)
Filter: (l_quantity < ((0.2 * avg(lineitem_1.l_quantity))))
(16 rows)
and if I disale hash aggregate (or spill to disk), it changes to this:
QUERY PLAN
-------------------------------------------------------------------------------------------------------------------------
Limit (cost=44577524.39..44577524.40 rows=1 width=32)
-> Aggregate (cost=44577524.39..44577524.40 rows=1 width=32)
-> Merge Join (cost=41772792.17..44577358.39 rows=66397 width=8)
Merge Cond: (lineitem_1.l_partkey = part.p_partkey)
Join Filter: (lineitem.l_quantity < ((0.2 * avg(lineitem_1.l_quantity))))
-> GroupAggregate (cost=41772791.17..43305665.51 rows=6206695 width=36)
Group Key: lineitem_1.l_partkey
-> Sort (cost=41772791.17..42252715.81 rows=191969856 width=9)
Sort Key: lineitem_1.l_partkey
-> Seq Scan on lineitem lineitem_1 (cost=0.00..5519079.56 rows=191969856 width=9)
-> Materialize (cost=1.00..1191105.89 rows=205371 width=21)
-> Nested Loop (cost=1.00..1190592.46 rows=205371 width=21)
-> Index Scan using part_pkey on part (cost=0.43..329262.21 rows=6846 width=4)
Filter: ((p_brand = 'Brand#22'::bpchar) AND (p_container = 'LG BOX'::bpchar))
-> Index Scan using idx_lineitem_part_supp on lineitem (cost=0.57..125.51 rows=31
width=17)
Index Cond: (l_partkey = part.p_partkey)
(16 rows)
The problem is that the hashagg plan runs in ~1400 seconds, while the
groupagg only takes ~360. And per explain analyze, the difference really
is in the aggregation - if we subtract the seqscan, the sort+groupagg
takes about 310s:
-> GroupAggregate (cost=41772791.17..43305665.51 rows=6206695 width=36) (actual time=283378.004..335611.192
rows=6398981loops=1)
Group Key: lineitem_1.l_partkey
-> Sort (cost=41772791.17..42252715.81 rows=191969856 width=9) (actual time=283377.977..306182.393
rows=191969841loops=1)
Sort Key: lineitem_1.l_partkey
Sort Method: external merge Disk: 3569544kB
-> Seq Scan on lineitem lineitem_1 (cost=0.00..5519079.56 rows=191969856 width=9) (actual
time=0.019..28253.076rows=192000551 loops=1)
while the hashagg takes ~1330s:
-> HashAggregate (cost=13977751.34..15945557.39 rows=6206695 width=36) (actual time=202952.170..1354546.897
rows=6400000loops=1)
Group Key: lineitem_1.l_partkey
Planned Partitions: 128
Peak Memory Usage: 4249 kB
Disk Usage: 26321840 kB
HashAgg Batches: 16512
-> Seq Scan on lineitem lineitem_1 (cost=0.00..5519079.56 rows=191969856 width=9) (actual
time=0.007..22205.617rows=192000551 loops=1)
And that's while only writing 26GB, compared to 35GB in the sorted plan,
and with cost being ~16M vs. ~43M (so roughly inverse).
OK, let's make the hashagg plan more expensive - that'll fix it, right?.
But how do you do that? I might lower the work_mem, say from 4MB to 1MB,
which gets us from ~16M
-> HashAggregate (cost=13977751.34..15945557.39 rows=6206695 width=36)
Group Key: lineitem_1.l_partkey
Planned Partitions: 128
-> Seq Scan on lineitem lineitem_1 (cost=0.00..5519079.56 rows=191969856 width=9)
to ~20M (I'm a bit surprised that the planned partitions dropped 4x, but
I suspect there's an explanation for that).
-> HashAggregate (cost=17727162.59..20632321.45 rows=6206695 width=36)
Group Key: lineitem_1.l_partkey
Planned Partitions: 32
-> Seq Scan on lineitem lineitem_1 (cost=0.00..5519079.56 rows=191969856 width=9)
Anyway, this did not really solve anything, apparently. The cost is
still much lower than for groupagg, and moreover I don't want to lower
work_mem - I want to increase cost for a given work_mem value. And it
also increases the sort cost estimate, of course.
As I'll show in a minute, I believe most of this is due to I/O pattern
for the logical tapes, which is very different between sort and hashagg.
So it'd be natural to consider seq_page_cost/random_page_cost on the
temp tablespace, but that's not how it works - we just ignore that :-(
Why do I think this is due to a difference in I/O pattern on the logical
tape set? I've moved the temporary tablespace to a separate SSD device,
and used iosnoop [1] to collect all I/O requests associated with this
query. Attached are four charts showing blocks (sectors) accessed over
time, both for the groupagg and hashagg plans.
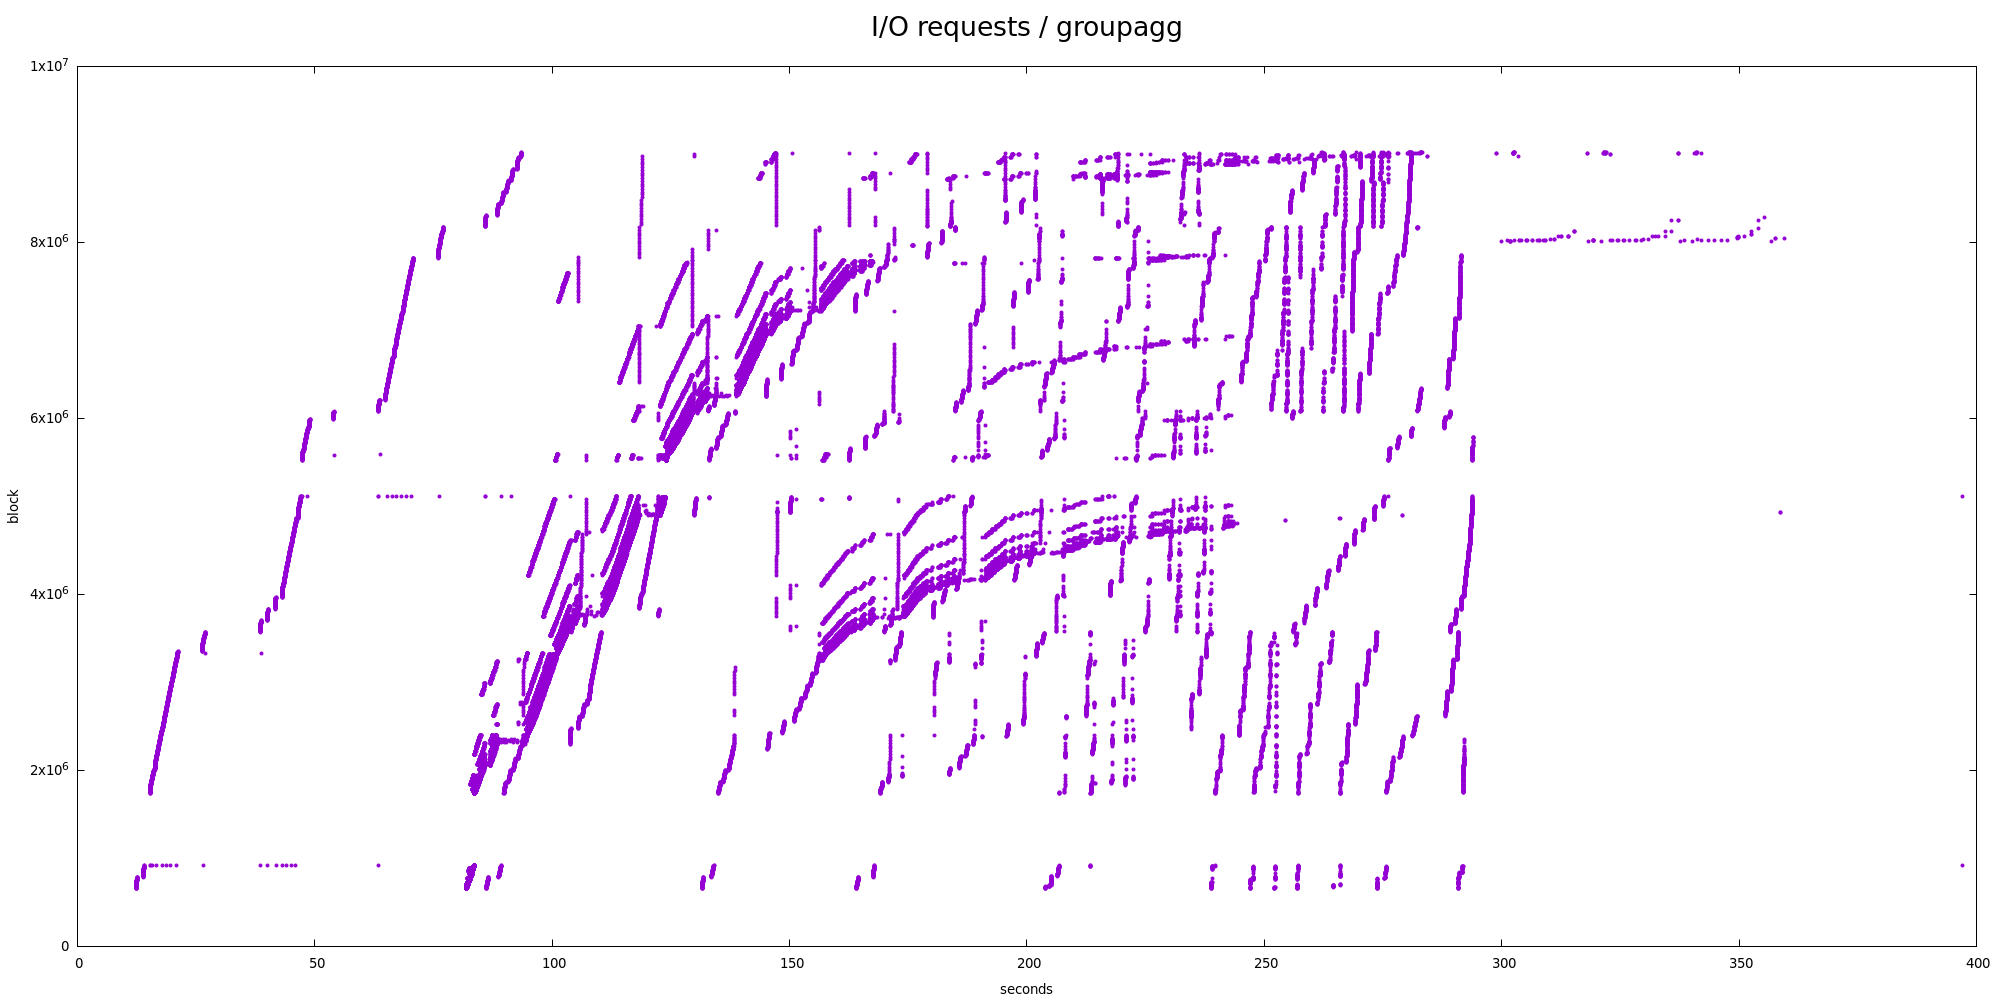
1) sort + groupagg
For groupagg (tempio-sort.png) the chart looks a bit chaotic, but it's
reasonable - it shows the sort does merges, etc. Nothing particularly
surprising, IMHO.
It's also interesting to look at statistics of block sizes, and deltas
of the blocks, for different request types. Showing the most common
block sizes look something like this (the last column is percentage
of all requests with the same request type):
type | bytes | count | pct
------+---------+-------+-------
RA | 131072 | 26034 | 59.92
RA | 16384 | 6160 | 14.18
RA | 8192 | 3636 | 8.37
RA | 32768 | 3406 | 7.84
RA | 65536 | 3270 | 7.53
RA | 24576 | 361 | 0.83
...
W | 1310720 | 8070 | 34.26
W | 262144 | 1213 | 5.15
W | 524288 | 1056 | 4.48
W | 1056768 | 689 | 2.93
W | 786432 | 292 | 1.24
W | 802816 | 199 | 0.84
...
The writes are buffered and so are done by kworkers, which seem to be
able to coalesce them into fairly large chunks (e.g. 34% are 1280kB).
The reads come from the postgres backend, and generally are 128kB reads.
The deltas (in 512B sectors) are mostly consistent with this:
type | block_delta | count | pct
------+-------------+-------+-------
RA | 256 | 13432 | 30.91
RA | 16 | 3291 | 7.57
RA | 32 | 3272 | 7.53
RA | 64 | 3266 | 7.52
RA | 128 | 2877 | 6.62
RA | 1808 | 1278 | 2.94
RA | -2320 | 483 | 1.11
RA | 28928 | 386 | 0.89
...
W | 2560 | 7856 | 33.35
W | 2064 | 4921 | 20.89
W | 2080 | 586 | 2.49
W | 30960 | 300 | 1.27
W | 2160 | 253 | 1.07
W | 1024 | 248 | 1.05
...
I believe this suggests most of the I/O is pretty sequential. E.g. 31%
of the reads are 256 sectors (128kB) apart, which is proportional to the
128kB reads.
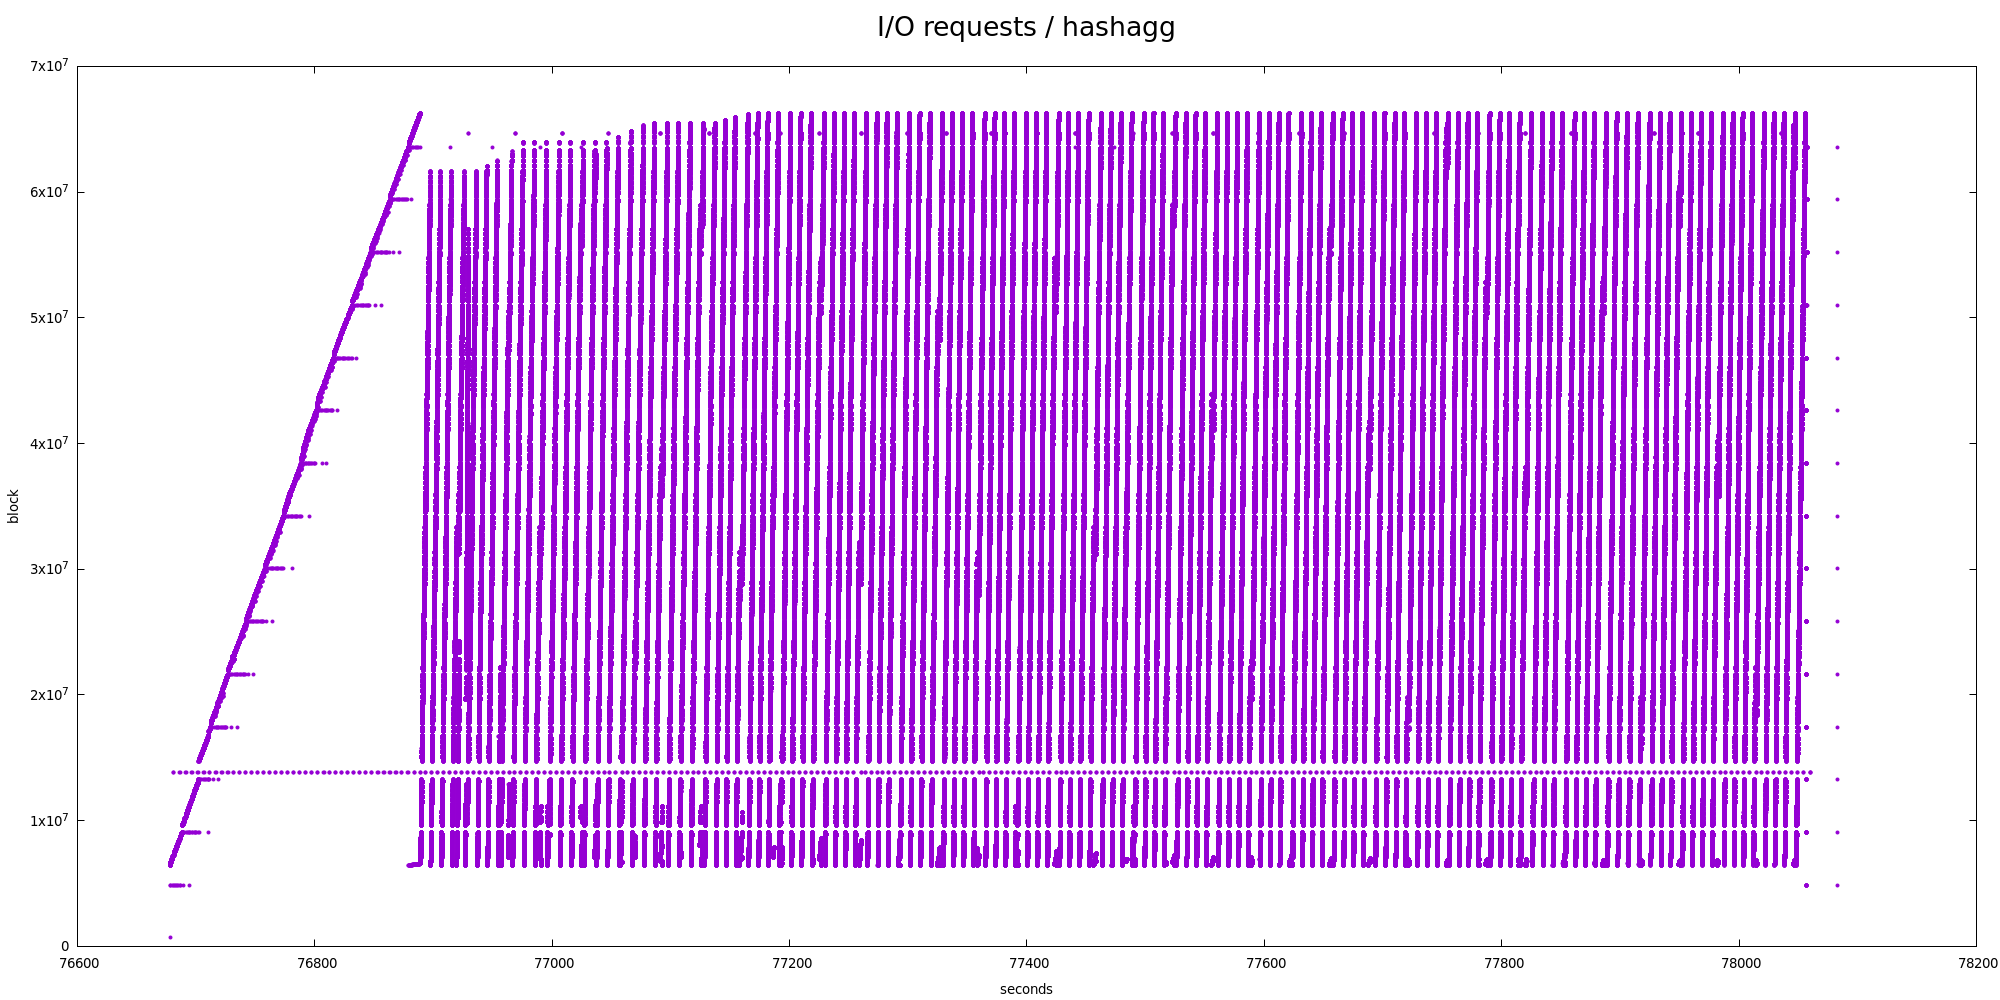
2) hashagg
The I/O pattern is illustrated by the tempion-hash.png chart, and it's
clearly very different from the sort one. We're reading over and over
in a zig-zag way. I'm pretty sure there are ~128 cycles matching the
number of partitions in the explain analyze output, which end up being
interleaved in the temporary file.
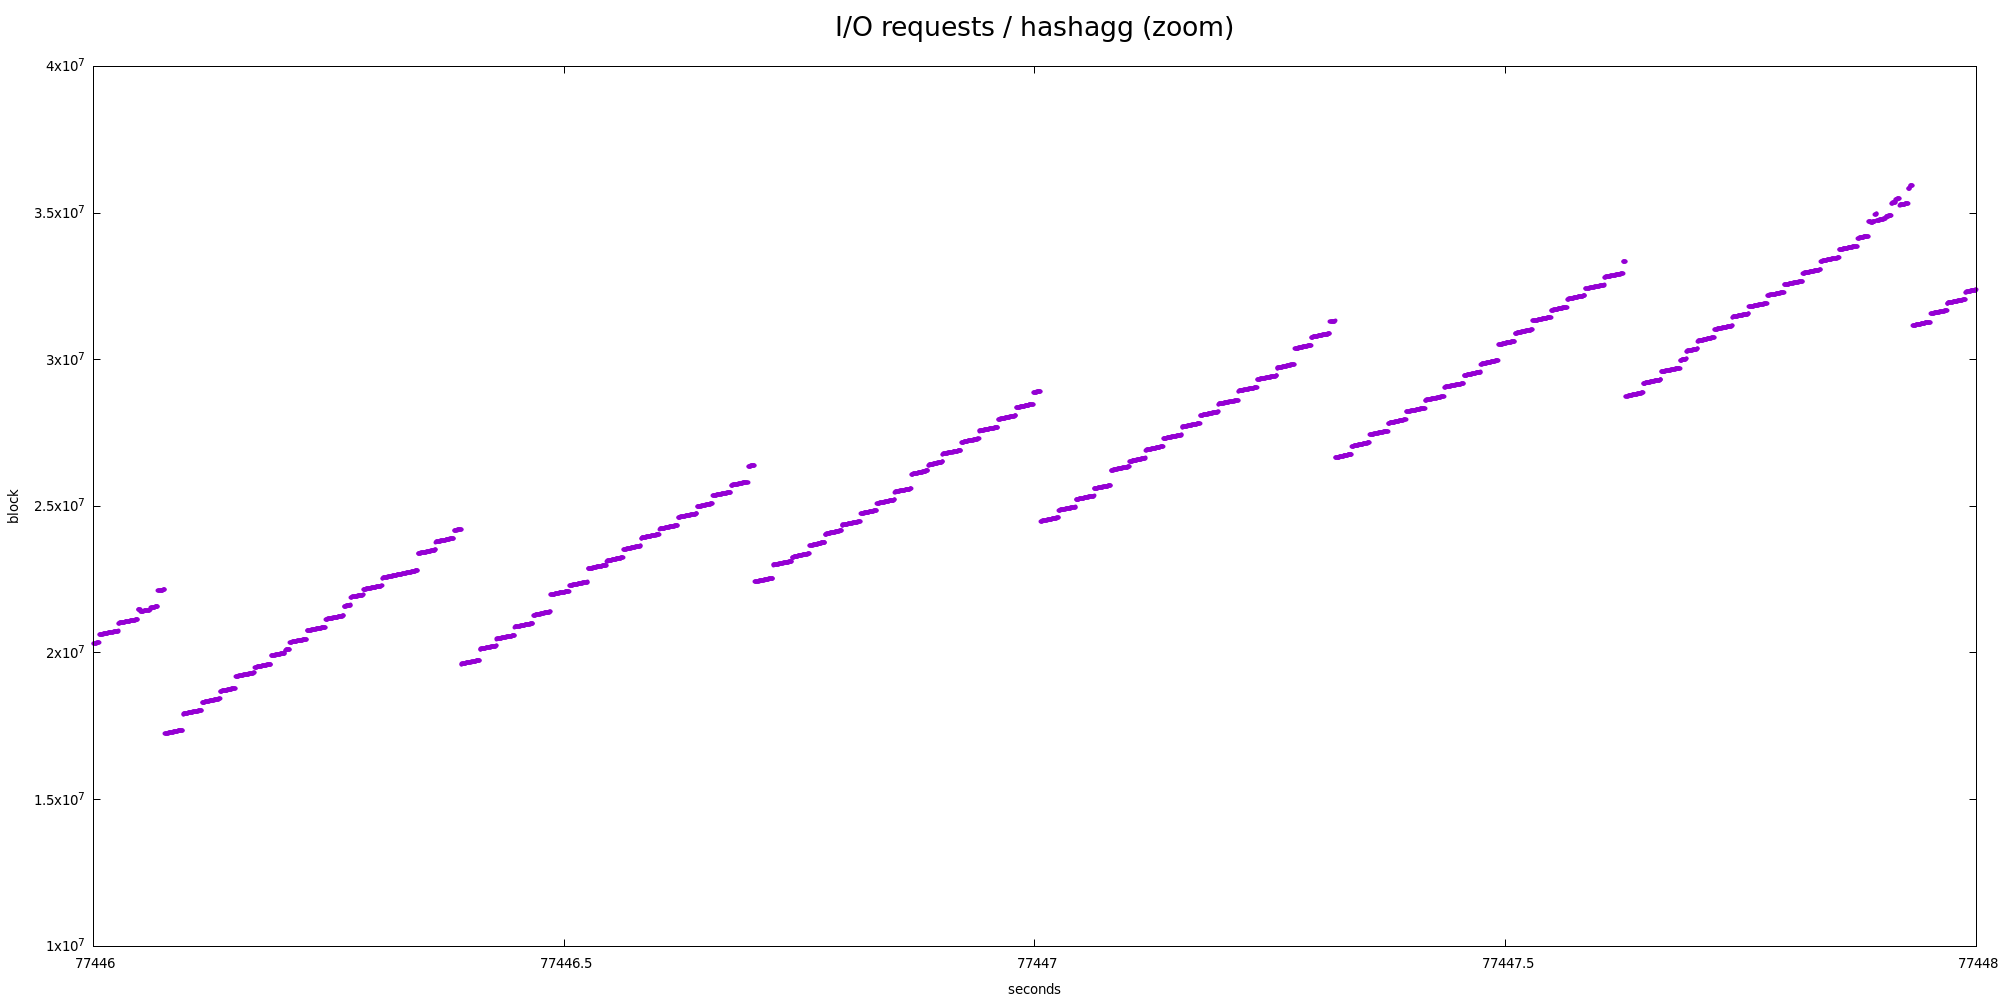
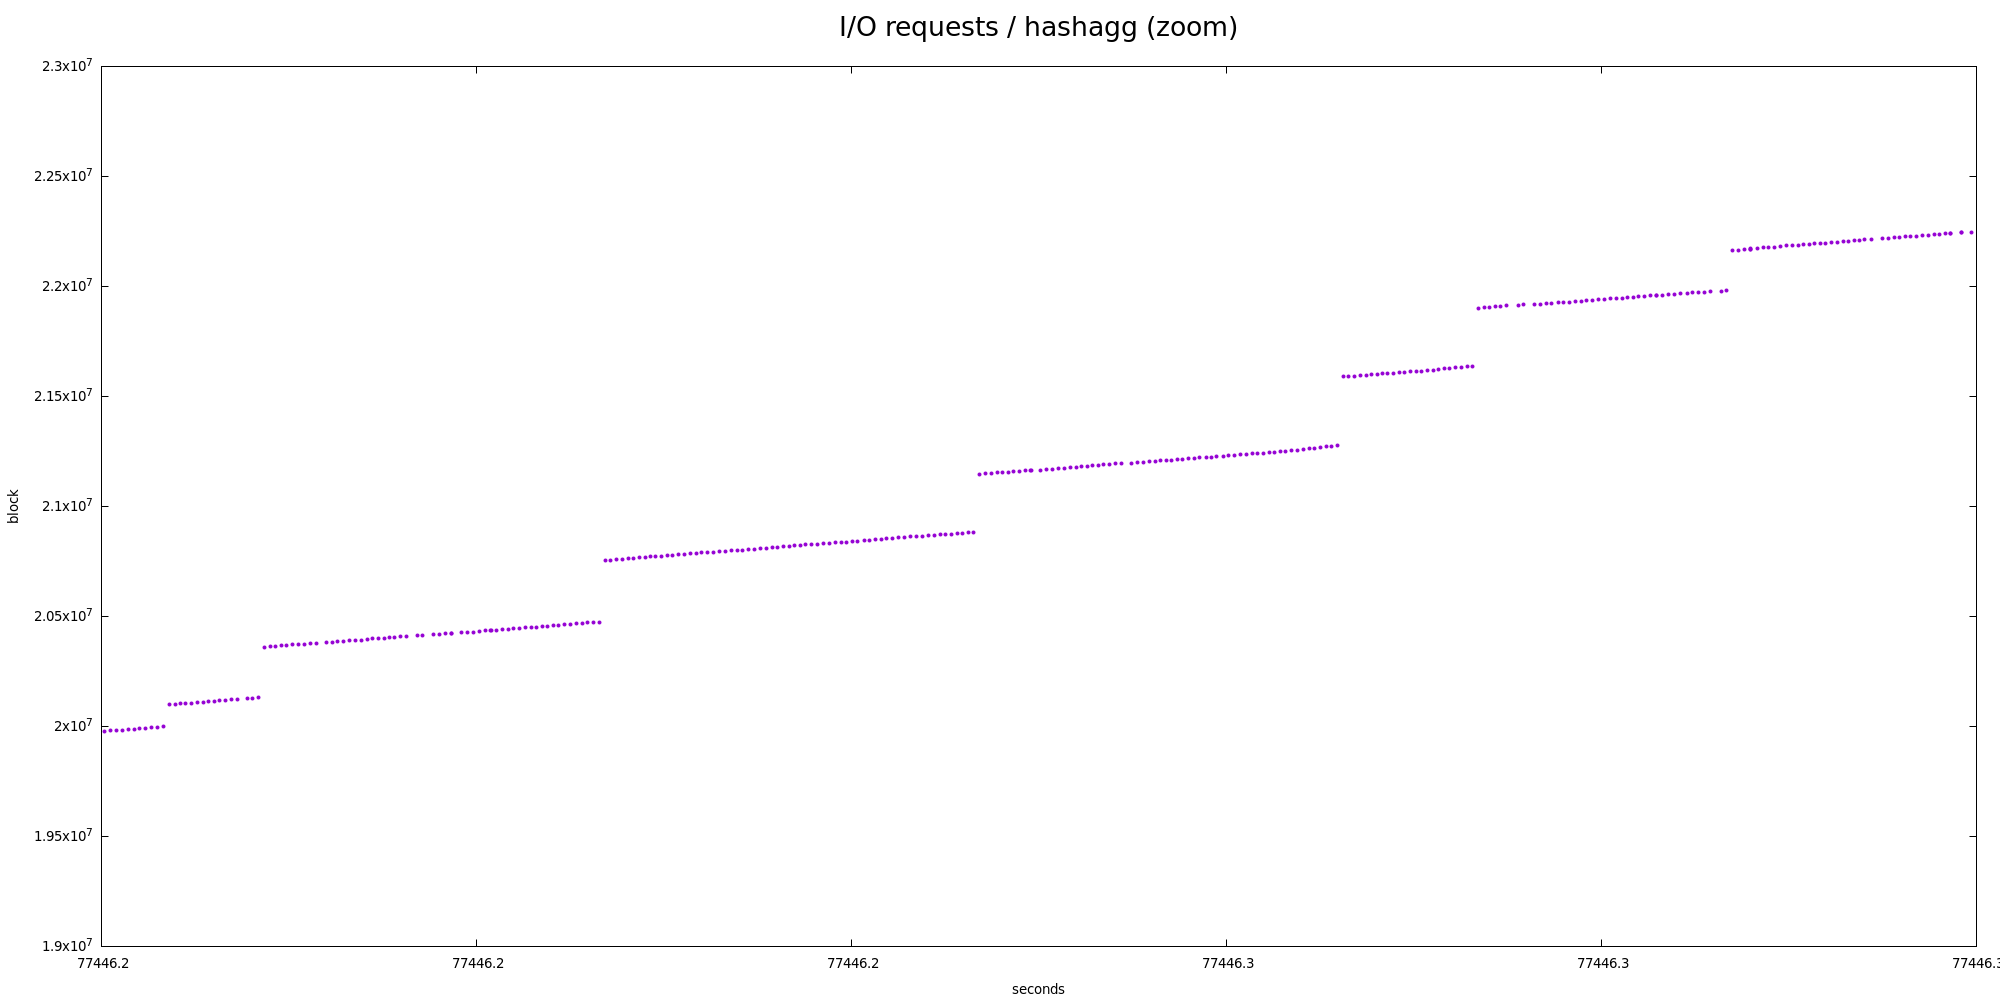
But even at the partition level this is not very very sequential - there
are two "zoom" charts showing smaller parts in more detail, and there's
very obvious nested zig-zag pattern.
Also, let's look at the block / delta stats:
type | bytes | count | pct
------+---------+---------+--------
RA | 8192 | 3087724 | 95.42
RA | 24576 | 69511 | 2.15
RA | 16384 | 49297 | 1.52
RA | 32768 | 15589 | 0.48
...
W | 8192 | 321089 | 65.72
W | 16384 | 74097 | 15.17
W | 24576 | 27785 | 5.69
W | 1310720 | 16860 | 3.45
W | 32768 | 13823 | 2.83
W | 40960 | 7771 | 1.59
W | 49152 | 4767 | 0.98
...
Well, that's not great - we're not really coalescing writes or reads,
everything is pretty much 8kB block. Especially the writes are somewhat
surprising/concerning, because it shows the kernel is unable to combine
the requests etc.
The deltas look very different too:
type | block_delta | count | pct
------+-------------+-------+-------
RA | 2016 | 72399 | 2.24
RA | 2032 | 72351 | 2.24
RA | 1984 | 72183 | 2.23
RA | 2000 | 71964 | 2.22
RA | 2048 | 71718 | 2.22
RA | 2064 | 71387 | 2.21
RA | 1968 | 71363 | 2.21
RA | 1952 | 70412 | 2.18
RA | 2080 | 70189 | 2.17
RA | 2096 | 69568 | 2.15
RA | 1936 | 69109 | 2.14
RA | 1920 | 67660 | 2.09
RA | 2112 | 67248 | 2.08
RA | 1904 | 66026 | 2.04
...
There's no clear winner matching the block size, or anything. In fact,
it does oscillate around 2000 sectors, i.e. 1MB. And 128 partitions
multiplied by 8kB block per partition is ... 1MB (tadaaaa!).
This however makes any read-ahead attempts ineffective :-(
And let me repeat - this is on a machine with temp tablespace moved to
an SSD, so the random I/O is not entirely terrible. On a different box
with temp tablespace on 3x SATA RAID, the impact is much worse.
This kinda makes me question whether logical tapes are the right tool
for hashagg. I've read the explanation in logtape.c why it's about the
same amount of I/O as using separate files, but IMO that only really
works for I/O patters similar to merge sort - the more I think about
this, the more I'm convinced we should just do what hashjoin is doing.
But maybe I'm wrong, and logical tapes are the best thing we can do
here. But in that case I think we need to improve the costing, so that
it reflects the very different I/O pattern.
[1] https://github.com/brendangregg/perf-tools/blob/master/iosnoop
--
Tomas Vondra http://www.2ndQuadrant.com
PostgreSQL Development, 24x7 Support, Remote DBA, Training & Services
Вложения
On Tue, 2020-05-19 at 17:12 +0200, Tomas Vondra wrote:
> I think there are two related problem - with costing and with
> excessive
> I/O due to using logical tapes.

Thank you for the detailed analysis. I am still digesting this
information.

> This kinda makes me question whether logical tapes are the right tool
> for hashagg. I've read the explanation in logtape.c why it's about
> the
> same amount of I/O as using separate files, but IMO that only really
> works for I/O patters similar to merge sort - the more I think about
> this, the more I'm convinced we should just do what hashjoin is
> doing.

Fundamentally, sort writes sequentially and reads randomly; while
HashAgg writes randomly and reads sequentially.

If the random writes of HashAgg end up fragmented too much on disk,
then clearly the sequential reads are not so sequential anyway. The
only way to avoid fragmentation on disk is to preallocate for the
tape/file.

BufFile (relying more on the OS) would probably do a better job of
preallocating the disk space in a useful way; whereas logtape.c makes
it easier to manage buffers and the overall number of files created
(thereby allowing higher fanout of partitions).

We have a number of possibilities here:

1. Improve costing to reflect that HashAgg is creating more random IOs
than Sort.
2. Reduce the partition fanout in the hopes that the OS does a better
job with readahead.
3. Switch back to BufFile, in which case we probably need to reduce the
fanout for other reasons.
4. Change logtape.c to allow preallocation or to write in larger
blocks.
5. Change BufFile to allow more control over buffer usage, and switch
to that.

#1 or #2 are the least invasive, and I think we can get a satisfactory
solution by combining those.

I saw good results with the high fanout and low work_mem when there is
still a lot of system memory. That's a nice benefit, but perhaps it's
safer to use a lower fanout (which will lead to recursion) until we get
a better handle on the IO patterns.

Perhaps you can try recompiling with a lower max partitions and rerun
the query? How much would we have to lower it for either the cost to
approach reality or the OS readahead to become effective?

Regards,
    Jeff Davis
On Tue, May 19, 2020 at 09:27:34AM -0700, Jeff Davis wrote:
>On Tue, 2020-05-19 at 17:12 +0200, Tomas Vondra wrote:
>> I think there are two related problem - with costing and with
>> excessive
>> I/O due to using logical tapes.
>
>Thank you for the detailed analysis. I am still digesting this
>information.
>
>> This kinda makes me question whether logical tapes are the right tool
>> for hashagg. I've read the explanation in logtape.c why it's about
>> the
>> same amount of I/O as using separate files, but IMO that only really
>> works for I/O patters similar to merge sort - the more I think about
>> this, the more I'm convinced we should just do what hashjoin is
>> doing.
>
>Fundamentally, sort writes sequentially and reads randomly; while
>HashAgg writes randomly and reads sequentially.
>

Not sure. I think the charts and stats of iosnoop data show that an
awful lot of reads during sort is actually pretty sequential. Moreover,
sort manages to read the data in much larger blocks - 128kB instead of
just 8kB (which is what hashagg seems to be doing).

I wonder why is that and if we could achieve that for hashagg too ...

>If the random writes of HashAgg end up fragmented too much on disk,
>then clearly the sequential reads are not so sequential anyway. The
>only way to avoid fragmentation on disk is to preallocate for the
>tape/file.
>

And if there a way to pre-allocate larger chunks? Presumably we could
assign the blocks to tape in larger chunks (e.g. 128kB, i.e. 16 x 8kB)
instead of just single block. I haven't seen anything like that in
tape.c, though ...

>BufFile (relying more on the OS) would probably do a better job of
>preallocating the disk space in a useful way; whereas logtape.c makes
>it easier to manage buffers and the overall number of files created
>(thereby allowing higher fanout of partitions).
>
>We have a number of possibilities here:
>
>1. Improve costing to reflect that HashAgg is creating more random IOs
>than Sort.

I think we'll need to do something about this, but I think we should try
improving the behavior first and then model the costing based on that.

>2. Reduce the partition fanout in the hopes that the OS does a better
>job with readahead.

I doubt this will make a significant difference. I think the problem is
the partitions end up interleaved way too much in the temp file, and I
don't see how a lower fanout would fix that.

BTW what do you mean when you say "fanout"? Do you mean how fast we
increase the number of partitions, or some parameter in particular?

>3. Switch back to BufFile, in which case we probably need to reduce the
>fanout for other reasons.

Maybe, although that seems pretty invasive post beta1.

>4. Change logtape.c to allow preallocation or to write in larger
>blocks.

I think this is what I suggested above (allocating 16 blocks at a time,
or something). I wonder how wasteful this would be, but I think not very
much. Essentially, with 1024 partitions and pre-allocating space in
128kB chunks, that means 128MB may end up unused, which seems ok-ish,
and I guess we could further restrict that by starting with lower value
and gradually increasing the number. Or something like that ...

>5. Change BufFile to allow more control over buffer usage, and switch
>to that.
>

Maybe. I don't recall what exactly is the issue with buffer usage, but I
think it has the same invasiveness issue as (3). OTOH it's what hashjoin
does, and we've lived with it for ages ...

>#1 or #2 are the least invasive, and I think we can get a satisfactory
>solution by combining those.
>

OK. I think tweaking the costing (and essentially reverting to what 12
does for those queries) is perfectly reasonable. But if we can actually
get some speedup thanks to hashagg, even better.

>I saw good results with the high fanout and low work_mem when there is
>still a lot of system memory. That's a nice benefit, but perhaps it's
>safer to use a lower fanout (which will lead to recursion) until we get
>a better handle on the IO patterns.
>

I don't know how much we can rely on that - once we push some of the
data from page cache, it has the issues I described. The trouble is
people may not have enough memory to keep everything in cache, otherwise
they might just as well bump up work_mem and not spill at all.

>Perhaps you can try recompiling with a lower max partitions and rerun
>the query? How much would we have to lower it for either the cost to
>approach reality or the OS readahead to become effective?
>

I can try that, of course. Which parameters should I tweak / how?

I can also try running it with BufFile, in case you prepare a WIP patch.


regards

--
Tomas Vondra                  http://www.2ndQuadrant.com
PostgreSQL Development, 24x7 Support, Remote DBA, Training & Services
On Tue, 2020-05-19 at 19:53 +0200, Tomas Vondra wrote:
>
> And if there a way to pre-allocate larger chunks? Presumably we could
> assign the blocks to tape in larger chunks (e.g. 128kB, i.e. 16 x
> 8kB)
> instead of just single block. I haven't seen anything like that in
> tape.c, though ...

It turned out to be simple (at least a POC) so I threw together a
patch. I just added a 32-element array of block numbers to each tape.
When we need a new block, we retrieve a block number from that array;
or if it's empty, we fill it by calling ltsGetFreeBlock() 32 times.

I reproduced the problem on a smaller scale (330M groups, ~30GB of
memory on a 16GB box). Work_mem=64MB. The query is a simple distinct.

Unpatched master:
   Sort: 250s
   HashAgg: 310s
Patched master:
   Sort: 245s
   HashAgg: 262s

That's a nice improvement for such a simple patch. We can tweak the
number of blocks to preallocate, or do other things like double from a
small number up to a maximum. Also, a proper patch would probably
release the blocks back as free when the tape was rewound.

As long as the number of block numbers to preallocate is not too large,
I don't think we need to change the API. It seems fine for sort to do
the same thing, even though there's not any benefit.

Regards,
    Jeff Davis
Вложения
On Tue, May 19, 2020 at 09:15:40PM -0700, Jeff Davis wrote:
>On Tue, 2020-05-19 at 19:53 +0200, Tomas Vondra wrote:
>>
>> And if there a way to pre-allocate larger chunks? Presumably we could
>> assign the blocks to tape in larger chunks (e.g. 128kB, i.e. 16 x
>> 8kB)
>> instead of just single block. I haven't seen anything like that in
>> tape.c, though ...
>
>It turned out to be simple (at least a POC) so I threw together a
>patch. I just added a 32-element array of block numbers to each tape.
>When we need a new block, we retrieve a block number from that array;
>or if it's empty, we fill it by calling ltsGetFreeBlock() 32 times.
>
>I reproduced the problem on a smaller scale (330M groups, ~30GB of
>memory on a 16GB box). Work_mem=64MB. The query is a simple distinct.
>
>Unpatched master:
>   Sort: 250s
>   HashAgg: 310s
>Patched master:
>   Sort: 245s
>   HashAgg: 262s
>
>That's a nice improvement for such a simple patch. We can tweak the
>number of blocks to preallocate, or do other things like double from a
>small number up to a maximum. Also, a proper patch would probably
>release the blocks back as free when the tape was rewound.
>
>As long as the number of block numbers to preallocate is not too large,
>I don't think we need to change the API. It seems fine for sort to do
>the same thing, even though there's not any benefit.
>

I gave it a try on the machine with temp tablespace on SSD, and I can
confirm it improves performance. I've tried with different work_mem
values and I've also increased the number of pre-allocated blocks to 64
and 128 blocks, and the numbers look like this:

master

                sort      hash
    ----------------------------
       4MB       335      1331
     128MB       220      1208


patched (32)

                sort      hash
    ----------------------------
       4MB       344       685
     128MB       217       641


patched (64)

                 sort      hash
    ----------------------------
       4MB       329       545
     128MB       214       493

patched (128)

                sort      hash
    ----------------------------
       4MB       331       478
     128MB       222       434


I agree that's pretty nice. I wonder how far would we need to go before
reaching a plateau. I'll try this on the other machine with temporary
tablespace on SATA, but that'll take longer.

The I/O pattern changed significantly - it's not visible on the charts,
so I'm not attaching them. But the statistics of block sizes and "gaps"
are pretty clear.


size of I/O requests
--------------------

a) master

      type |  bytes  |  count  |  pct
     ------+---------+---------+--------
      RA   |    8192 | 2905948 |  95.83
      RA   |   24576 |   63470 |   2.09
      RA   |   16384 |   40155 |   1.32
      W    |    8192 |  149295 |  52.85
      W    |   16384 |   51781 |  18.33
      W    |   24576 |   22247 |   7.88
      W    | 1310720 |   15493 |   5.48
      W    |   32768 |   11856 |   4.20

b) patched, 32 blocks

      type |  bytes  | count  |  pct
     ------+---------+--------+--------
      RA   |  131072 | 247686 |  41.75
      RA   |    8192 |  95746 |  16.14
      RA   |   16384 |  82314 |  13.87
      RA   |   32768 |  82146 |  13.85
      RA   |   65536 |  82126 |  13.84
      W    | 1310720 |  16815 |  52.19
      W    |  262144 |   3628 |  11.26
      W    |  524288 |   2791 |   8.66

c) patched, 64 blocks

      type |  bytes  | count  |  pct
     ------+---------+--------+--------
      RA   |  131072 | 213556 |  56.18
      RA   |    8192 |  47663 |  12.54
      RA   |   16384 |  39358 |  10.35
      RA   |   32768 |  39308 |  10.34
      RA   |   65536 |  39304 |  10.34
      W    | 1310720 |  18132 |  65.27
      W    |  524288 |   3722 |  13.40
      W    |  262144 |    581 |   2.09
      W    | 1048576 |    405 |   1.46
      W    |    8192 |    284 |   1.02

d) patched, 128 blocks

      type |  bytes  | count  |  pct
     ------+---------+--------+--------
      RA   |  131072 | 200816 |  70.93
      RA   |    8192 |  23640 |   8.35
      RA   |   16384 |  19324 |   6.83
      RA   |   32768 |  19279 |   6.81
      RA   |   65536 |  19273 |   6.81
      W    | 1310720 |  18000 |  65.91
      W    |  524288 |   2074 |   7.59
      W    | 1048576 |    660 |   2.42
      W    |    8192 |    409 |   1.50
      W    |  786432 |    354 |   1.30

Clearly, the I/O requests are much larger - both reads and writes
shifted from 8kB to much larger ones, and the larger the number of
blocks the more significant the shift is. This means the workload is
getting more "sequential" and the write combining / read-ahead becomes
more effective.


deltas between I/O requests
---------------------------

I'll only show reads to save space, it's about the same for writes.

a) master

      type | block_delta | count  |  pct
     ------+-------------+--------+-------
      RA   |         256 | 569237 | 18.77
      RA   |         240 | 475182 | 15.67
      RA   |         272 | 437260 | 14.42
      RA   |         224 | 328604 | 10.84
      RA   |         288 | 293628 |  9.68
      RA   |         208 | 199530 |  6.58
      RA   |         304 | 181695 |  5.99
      RA   |         192 | 109472 |  3.61
      RA   |         320 | 105211 |  3.47
      RA   |         336 |  57423 |  1.89

b) patched, 32 blocks

      type | block_delta | count  |  pct
     ------+-------------+--------+-------
      RA   |         256 | 165071 | 27.82
      RA   |          32 |  82129 | 13.84
      RA   |          64 |  82122 | 13.84
      RA   |         128 |  82077 | 13.83
      RA   |          16 |  82042 | 13.83
      RA   |        7440 |  45168 |  7.61
      RA   |        7952 |   9838 |  1.66

c) patched, 64 blocks

      type | block_delta | count  |  pct
     ------+-------------+--------+-------
      RA   |         256 | 173737 | 45.70
      RA   |          32 |  39301 | 10.34
      RA   |          64 |  39299 | 10.34
      RA   |         128 |  39291 | 10.34
      RA   |          16 |  39250 | 10.32
      RA   |       15120 |  21202 |  5.58
      RA   |       15376 |   4448 |  1.17

d) patched, 128 blocks

      type | block_delta | count  |  pct
     ------+-------------+--------+-------
      RA   |         256 | 180955 | 63.91
      RA   |          32 |  19274 |  6.81
      RA   |          64 |  19273 |  6.81
      RA   |         128 |  19264 |  6.80
      RA   |          16 |  19203 |  6.78
      RA   |       30480 |   9835 |  3.47

The way I understand it, this needs to be interpreted together with
block size stats - in a perfectly sequential workload the two stats
would match. For master that's clearly not the case - the most common
read request size is 8kB, but the most common delta is 128kB (256
sectors, which is the read-ahead for the SSD device). The patched
results are much closer, mostly thanks to switching to 128kB reads.


regards

--
Tomas Vondra                  http://www.2ndQuadrant.com
PostgreSQL Development, 24x7 Support, Remote DBA, Training & Services
On Tue, May 19, 2020 at 05:12:02PM +0200, Tomas Vondra wrote:
>
> ...
>
>The problem is that the hashagg plan runs in ~1400 seconds, while the
>groupagg only takes ~360. And per explain analyze, the difference really
>is in the aggregation - if we subtract the seqscan, the sort+groupagg
>takes about 310s:
>
>    ->  GroupAggregate  (cost=41772791.17..43305665.51 rows=6206695 width=36) (actual time=283378.004..335611.192
rows=6398981loops=1)

>          Group Key: lineitem_1.l_partkey
>          ->  Sort  (cost=41772791.17..42252715.81 rows=191969856 width=9) (actual time=283377.977..306182.393
rows=191969841loops=1)

>                Sort Key: lineitem_1.l_partkey
>                Sort Method: external merge  Disk: 3569544kB
>                ->  Seq Scan on lineitem lineitem_1  (cost=0.00..5519079.56 rows=191969856 width=9) (actual
time=0.019..28253.076rows=192000551 loops=1)

>
>while the hashagg takes ~1330s:
>
>    ->  HashAggregate  (cost=13977751.34..15945557.39 rows=6206695 width=36) (actual time=202952.170..1354546.897
rows=6400000loops=1)

>          Group Key: lineitem_1.l_partkey
>          Planned Partitions: 128
>          Peak Memory Usage: 4249 kB
>          Disk Usage: 26321840 kB
>          HashAgg Batches: 16512
>          ->  Seq Scan on lineitem lineitem_1  (cost=0.00..5519079.56 rows=191969856 width=9) (actual
time=0.007..22205.617rows=192000551 loops=1)

>
>And that's while only writing 26GB, compared to 35GB in the sorted plan,
>and with cost being ~16M vs. ~43M (so roughly inverse).
>

I've noticed I've actually made a mistake here - it's not 26GB vs. 35GB
in hash vs. sort, it's 26GB vs. 3.5GB. That is, the sort-based plan
writes out *way less* data to the temp file.

The reason is revealed by explain verbose:

   ->  GroupAggregate
         Output: lineitem_1.l_partkey, (0.2 * avg(lineitem_1.l_quantity))
         Group Key: lineitem_1.l_partkey
         ->  Sort
               Output: lineitem_1.l_partkey, lineitem_1.l_quantity
               Sort Key: lineitem_1.l_partkey
               ->  Seq Scan on public.lineitem lineitem_1
                     Output: lineitem_1.l_partkey, lineitem_1.l_quantity

   ->  HashAggregate
         Output: lineitem_1.l_partkey, (0.2 * avg(lineitem_1.l_quantity))
         Group Key: lineitem_1.l_partkey
         ->  Seq Scan on public.lineitem lineitem_1
               Output: lineitem_1.l_orderkey, lineitem_1.l_partkey,
                       lineitem_1.l_suppkey, lineitem_1.l_linenumber,
                       lineitem_1.l_quantity, lineitem_1.l_extendedprice,
                       lineitem_1.l_discount, lineitem_1.l_tax,
                       lineitem_1.l_returnflag, lineitem_1.l_linestatus,
                       lineitem_1.l_shipdate, lineitem_1.l_commitdate,
                       lineitem_1.l_receiptdate, lineitem_1.l_shipinstruct,
                       lineitem_1.l_shipmode, lineitem_1.l_comment

It seems that in the hashagg case we're not applying projection in the
seqscan, forcing us to serialize way much data (the whole lineitem
table, essentially).

It's probably still worth tweaking the I/O pattern, I think.


regards

--
Tomas Vondra                  http://www.2ndQuadrant.com
PostgreSQL Development, 24x7 Support, Remote DBA, Training & Services
On Thu, May 21, 2020 at 03:41:22PM +0200, Tomas Vondra wrote:
>On Tue, May 19, 2020 at 05:12:02PM +0200, Tomas Vondra wrote:
>>
>>...
>>
>>The problem is that the hashagg plan runs in ~1400 seconds, while the
>>groupagg only takes ~360. And per explain analyze, the difference really
>>is in the aggregation - if we subtract the seqscan, the sort+groupagg
>>takes about 310s:
>>
>>   ->  GroupAggregate  (cost=41772791.17..43305665.51 rows=6206695 width=36) (actual time=283378.004..335611.192
rows=6398981loops=1)

>>         Group Key: lineitem_1.l_partkey
>>         ->  Sort  (cost=41772791.17..42252715.81 rows=191969856 width=9) (actual time=283377.977..306182.393
rows=191969841loops=1)

>>               Sort Key: lineitem_1.l_partkey
>>               Sort Method: external merge  Disk: 3569544kB
>>               ->  Seq Scan on lineitem lineitem_1  (cost=0.00..5519079.56 rows=191969856 width=9) (actual
time=0.019..28253.076rows=192000551 loops=1)

>>
>>while the hashagg takes ~1330s:
>>
>>   ->  HashAggregate  (cost=13977751.34..15945557.39 rows=6206695 width=36) (actual time=202952.170..1354546.897
rows=6400000loops=1)

>>         Group Key: lineitem_1.l_partkey
>>         Planned Partitions: 128
>>         Peak Memory Usage: 4249 kB
>>         Disk Usage: 26321840 kB
>>         HashAgg Batches: 16512
>>         ->  Seq Scan on lineitem lineitem_1  (cost=0.00..5519079.56 rows=191969856 width=9) (actual
time=0.007..22205.617rows=192000551 loops=1)

>>
>>And that's while only writing 26GB, compared to 35GB in the sorted plan,
>>and with cost being ~16M vs. ~43M (so roughly inverse).
>>
>
>I've noticed I've actually made a mistake here - it's not 26GB vs. 35GB
>in hash vs. sort, it's 26GB vs. 3.5GB. That is, the sort-based plan
>writes out *way less* data to the temp file.
>
>The reason is revealed by explain verbose:
>
>  ->  GroupAggregate
>        Output: lineitem_1.l_partkey, (0.2 * avg(lineitem_1.l_quantity))
>        Group Key: lineitem_1.l_partkey
>        ->  Sort
>              Output: lineitem_1.l_partkey, lineitem_1.l_quantity
>              Sort Key: lineitem_1.l_partkey
>              ->  Seq Scan on public.lineitem lineitem_1
>                    Output: lineitem_1.l_partkey, lineitem_1.l_quantity
>
>  ->  HashAggregate
>        Output: lineitem_1.l_partkey, (0.2 * avg(lineitem_1.l_quantity))
>        Group Key: lineitem_1.l_partkey
>        ->  Seq Scan on public.lineitem lineitem_1
>              Output: lineitem_1.l_orderkey, lineitem_1.l_partkey,
>                      lineitem_1.l_suppkey, lineitem_1.l_linenumber,
>                      lineitem_1.l_quantity, lineitem_1.l_extendedprice,
>                      lineitem_1.l_discount, lineitem_1.l_tax,
>                      lineitem_1.l_returnflag, lineitem_1.l_linestatus,
>                      lineitem_1.l_shipdate, lineitem_1.l_commitdate,
>                      lineitem_1.l_receiptdate, lineitem_1.l_shipinstruct,
>                      lineitem_1.l_shipmode, lineitem_1.l_comment
>
>It seems that in the hashagg case we're not applying projection in the
>seqscan, forcing us to serialize way much data (the whole lineitem
>table, essentially).
>
>It's probably still worth tweaking the I/O pattern, I think.
>

OK, it seems the attached trivial fix (simply changing CP_LABEL_TLIST to
CP_SMALL_TLIST) addresses this for me. I've only tried it on the patched
version that pre-allocates 128 blocks, and the results seem pretty nice:

                sort      hash      hash+tlist
    ------------------------------------------
       4MB       331       478            188
     128MB       222       434            210

which I guess is what we wanted ...

I'll give it a try on the other machine (temp on SATA), but I don't see
why would it not behave similarly nicely.

regards

--
Tomas Vondra                  http://www.2ndQuadrant.com
PostgreSQL Development, 24x7 Support, Remote DBA, Training & Services
Вложения
On Thu, May 21, 2020 at 02:12:55AM +0200, Tomas Vondra wrote:
>
> ...
>
>I agree that's pretty nice. I wonder how far would we need to go before
>reaching a plateau. I'll try this on the other machine with temporary
>tablespace on SATA, but that'll take longer.
>

OK, I've managed to get some numbers from the other machine, with 75GB
data set and temp tablespace on SATA RAID. I haven't collected I/O data
using iosnoop this time, because we already know how that changes from
the other machine. I've also only done this with 128MB work_mem, because
of how long a single run takes, and with 128 blocks pre-allocation.

The patched+tlist means both pre-allocation and with the tlist tweak
I've posted to this thread a couple minutes ago:

                master       patched       patched+tlist
    -----------------------------------------------------
     sort         485            472                 462
     hash       24686           3060                 559

So the pre-allocation makes it 10x faster, and the tlist tweak makes it
5x faster. Not bad, I guess.

Note: I've slightly tweaked read-ahead on the RAID device(s) on those
patched runs, but the effect was pretty negligible (compared to other
patched runs with the old read-ahead setting).


regards

--
Tomas Vondra                  http://www.2ndQuadrant.com
PostgreSQL Development, 24x7 Support, Remote DBA, Training & Services
On Thu, May 21, 2020 at 10:45 AM Tomas Vondra
<tomas.vondra@2ndquadrant.com> wrote:
> So the pre-allocation makes it 10x faster, and the tlist tweak makes it
> 5x faster. Not bad, I guess.

That is pretty great stuff, Tomas.

FWIW, I agree that CP_SMALL_TLIST seems like the right thing here.

--
Robert Haas
EnterpriseDB: http://www.enterprisedb.com
The Enterprise PostgreSQL Company
On Thu, 2020-05-21 at 16:30 +0200, Tomas Vondra wrote:
> OK, it seems the attached trivial fix (simply changing CP_LABEL_TLIST
> to
> CP_SMALL_TLIST) addresses this for me.

Great!

There were a couple plan changes where it introduced a Subquery Scan.
I'm not sure that I understand why it's doing that, can you verify that
it is a reasonable thing to do?

Aside from that, feel free to commit it.

Regards,
    Jeff Davis
On Thu, May 21, 2020 at 11:19:01AM -0700, Jeff Davis wrote:
>On Thu, 2020-05-21 at 16:30 +0200, Tomas Vondra wrote:
>> OK, it seems the attached trivial fix (simply changing CP_LABEL_TLIST
>> to
>> CP_SMALL_TLIST) addresses this for me.
>
>Great!
>
>There were a couple plan changes where it introduced a Subquery Scan.
>I'm not sure that I understand why it's doing that, can you verify that
>it is a reasonable thing to do?
>
>Aside from that, feel free to commit it.
>

It's doing that because we're doing projection everywhere, even in cases
when it may not be necessary - but I think that's actually OK.

At first I thought we might only do it conditionally when we expect to
spill to disk, but that'd not work for cases when we only realize we
need to spill to disk during execution.

So I think the plan changes are correct and expected.

I think we should do the pre-allocation patch too. I haven't tried yet
but I believe the tlist fix alone won't do nearly as good.


regards

--
Tomas Vondra                  http://www.2ndQuadrant.com
PostgreSQL Development, 24x7 Support, Remote DBA, Training & Services
On Thu, May 21, 2020 at 08:34:05PM +0200, Tomas Vondra wrote:
>On Thu, May 21, 2020 at 11:19:01AM -0700, Jeff Davis wrote:
>
> ...
>
>I think we should do the pre-allocation patch too. I haven't tried yet
>but I believe the tlist fix alone won't do nearly as good.
>

I've done some measurements on the smaller (SSD) machine, and the
comparison looks like this:

             sort   hash   hash+prealloc+tlist   hash+tlist
    --------------------------------------------------------
       4MB    331    478                   188          330
     128MB    222    434                   210          350


The last column is master with the tlist tweak alone - it's better than
hashagg on master alone, but it's not nearly as good as with both tlist
and prealloc patches.

I can't test this on the larger box with SATA temporary tablespace at
the moment (other tests are running), but I believe the difference will
be even more pronounced there.

I don't think we're under a lot of pressure - beta1 is out anyway, so we
have time to do proper testing first.


regards

--
Tomas Vondra                  http://www.2ndQuadrant.com
PostgreSQL Development, 24x7 Support, Remote DBA, Training & Services
On Thu, 2020-05-21 at 20:54 +0200, Tomas Vondra wrote:
> The last column is master with the tlist tweak alone - it's better
> than
> hashagg on master alone, but it's not nearly as good as with both
> tlist
> and prealloc patches.

Right, I certainly think we should do the prealloc change, as well.

I'm tweaking the patch to be a bit more flexible. I'm thinking we
should start the preallocation list size ~8 and then double it up to
~128 (depending on your results). That would reduce the waste in case
we have a large number of small partitions.

Regards,
    Jeff Davis
On Tue, May 19, 2020 at 09:15:40PM -0700, Jeff Davis wrote:
>On Tue, 2020-05-19 at 19:53 +0200, Tomas Vondra wrote:
>>
>> And if there a way to pre-allocate larger chunks? Presumably we could
>> assign the blocks to tape in larger chunks (e.g. 128kB, i.e. 16 x
>> 8kB)
>> instead of just single block. I haven't seen anything like that in
>> tape.c, though ...
>
>It turned out to be simple (at least a POC) so I threw together a
>patch. I just added a 32-element array of block numbers to each tape.
>When we need a new block, we retrieve a block number from that array;
>or if it's empty, we fill it by calling ltsGetFreeBlock() 32 times.
>

I think the PoC patch goes in the right direction. I have two ideas how
to improve it a bit:

1) Instead of assigning the pages one by one, we can easily extend the
API to allow getting a range of blocks, so that we don't need to call
ltsGetFreeBlock in a loop. Instead we could call ltsGetFreeBlockRange
with the requested number of blocks. And we could keep just a min/max
of free blocks, not an array with fixed number of elements.

2) We could make it self-tuning, by increasing the number of blocks
we pre-allocate. So every time we exhaust the range, we double the
number of blocks (with a reasonable maximum, like 1024 or so). Or we
might just increment it by 32, or something.

IIUC the danger of pre-allocating blocks is that we might not fill them,
resulting in temp file much larger than necessary. It might be harmless
on some (most?) current filesystems that don't actually allocate space
for blocks that are never written, but it also confuses our accounting
of temporary file sizes. So we should try to limit that, and growing the
number of pre-allocated blocks over time seems reasonable.

Both (1) and (2) seem fairly simple, not much more complex than the
current PoC patch.

I also wonder if we could collect / report useful statistics about I/O
on the temporary file, not just the size. I mean, how many pages we've
written/read, how sequential it was, etc. But some of that is probably
only visible at the OS level (e.g. we have no insignt into how the
kernel combines writes in page cache, etc.). This is clearly matter for
v14, though.


regards

--
Tomas Vondra                  http://www.2ndQuadrant.com
PostgreSQL Development, 24x7 Support, Remote DBA, Training & Services
On Thu, May 21, 2020 at 12:04:19PM -0700, Jeff Davis wrote:
>On Thu, 2020-05-21 at 20:54 +0200, Tomas Vondra wrote:
>> The last column is master with the tlist tweak alone - it's better
>> than
>> hashagg on master alone, but it's not nearly as good as with both
>> tlist
>> and prealloc patches.
>
>Right, I certainly think we should do the prealloc change, as well.
>
>I'm tweaking the patch to be a bit more flexible. I'm thinking we
>should start the preallocation list size ~8 and then double it up to
>~128 (depending on your results). That would reduce the waste in case
>we have a large number of small partitions.
>

You're reading my mind ;-)

I don't think 128 is necessarily the maximum we should use - it's just
that I haven't tested higher values. I wouldn't be surprised if higher
values made it a bit faster. But we can test and tune that, I agree with
growing the number of pre-allocted blocks over time.


regards

--
Tomas Vondra                  http://www.2ndQuadrant.com
PostgreSQL Development, 24x7 Support, Remote DBA, Training & Services
On Thu, 2020-05-21 at 21:13 +0200, Tomas Vondra wrote:
> 1) Instead of assigning the pages one by one, we can easily extend
> the
> API to allow getting a range of blocks, so that we don't need to call
> ltsGetFreeBlock in a loop. Instead we could call ltsGetFreeBlockRange
> with the requested number of blocks.

ltsGetFreeBlock() just draws one element from a minheap. Is there some
more efficient way to get many elements from a minheap at once?

>  And we could keep just a min/max
> of free blocks, not an array with fixed number of elements.

I don't quite know what you mean. Can you elaborate?

Regards,
    Jeff Davis
On Thu, May 21, 2020 at 12:40:23PM -0700, Jeff Davis wrote:
>On Thu, 2020-05-21 at 21:13 +0200, Tomas Vondra wrote:
>> 1) Instead of assigning the pages one by one, we can easily extend
>> the
>> API to allow getting a range of blocks, so that we don't need to call
>> ltsGetFreeBlock in a loop. Instead we could call ltsGetFreeBlockRange
>> with the requested number of blocks.
>
>ltsGetFreeBlock() just draws one element from a minheap. Is there some
>more efficient way to get many elements from a minheap at once?
>
>>  And we could keep just a min/max
>> of free blocks, not an array with fixed number of elements.
>
>I don't quite know what you mean. Can you elaborate?
>

Ah, I forgot there's and internal minheap thing - I thought we're just
incrementing some internal counter or something like that, but with the
minheap we can't just get a range of blocks. So just disregard that,
you're right we need the array.


regards

--
Tomas Vondra                  http://www.2ndQuadrant.com
PostgreSQL Development, 24x7 Support, Remote DBA, Training & Services
On Thu, 2020-05-21 at 21:13 +0200, Tomas Vondra wrote:
> 2) We could make it self-tuning, by increasing the number of blocks
> we pre-allocate. So every time we exhaust the range, we double the
> number of blocks (with a reasonable maximum, like 1024 or so). Or we
> might just increment it by 32, or something.

Attached a new version that uses the doubling behavior, and cleans it
up a bit. It also returns the unused prealloc blocks back to lts-
>freeBlocks when the tape is rewound for reading.

> IIUC the danger of pre-allocating blocks is that we might not fill
> them,
> resulting in temp file much larger than necessary. It might be
> harmless
> on some (most?) current filesystems that don't actually allocate
> space
> for blocks that are never written, but it also confuses our
> accounting
> of temporary file sizes. So we should try to limit that, and growing
> the
> number of pre-allocated blocks over time seems reasonable.

There's another danger here: it doesn't matter how well the filesystem
deals with sparse writes, because ltsWriteBlock fills in the holes with
zeros anyway. That's potentially a significant amount of wasted IO
effort if we aren't careful.

Regards,
    Jeff Davis
Вложения
On Thu, May 21, 2020 at 02:16:37PM -0700, Jeff Davis wrote:
>On Thu, 2020-05-21 at 21:13 +0200, Tomas Vondra wrote:
>> 2) We could make it self-tuning, by increasing the number of blocks
>> we pre-allocate. So every time we exhaust the range, we double the
>> number of blocks (with a reasonable maximum, like 1024 or so). Or we
>> might just increment it by 32, or something.
>
>Attached a new version that uses the doubling behavior, and cleans it
>up a bit. It also returns the unused prealloc blocks back to lts-
>freeBlocks when the tape is rewound for reading.
>

Ah, the returning is a nice idea, that should limit the overhead quite a
bit, I think.

>> IIUC the danger of pre-allocating blocks is that we might not fill
>> them,
>> resulting in temp file much larger than necessary. It might be
>> harmless
>> on some (most?) current filesystems that don't actually allocate
>> space
>> for blocks that are never written, but it also confuses our
>> accounting
>> of temporary file sizes. So we should try to limit that, and growing
>> the
>> number of pre-allocated blocks over time seems reasonable.
>
>There's another danger here: it doesn't matter how well the filesystem
>deals with sparse writes, because ltsWriteBlock fills in the holes with
>zeros anyway. That's potentially a significant amount of wasted IO
>effort if we aren't careful.
>

True. I'll give it a try on both machines and report some numbers. Might
take a couple of days.


regards

--
Tomas Vondra                  http://www.2ndQuadrant.com
PostgreSQL Development, 24x7 Support, Remote DBA, Training & Services
On Thu, May 21, 2020 at 11:41:22PM +0200, Tomas Vondra wrote:
>On Thu, May 21, 2020 at 02:16:37PM -0700, Jeff Davis wrote:
>>On Thu, 2020-05-21 at 21:13 +0200, Tomas Vondra wrote:
>>>2) We could make it self-tuning, by increasing the number of blocks
>>>we pre-allocate. So every time we exhaust the range, we double the
>>>number of blocks (with a reasonable maximum, like 1024 or so). Or we
>>>might just increment it by 32, or something.
>>
>>Attached a new version that uses the doubling behavior, and cleans it
>>up a bit. It also returns the unused prealloc blocks back to lts-
>>freeBlocks when the tape is rewound for reading.
>>
>
>Ah, the returning is a nice idea, that should limit the overhead quite a
>bit, I think.
>
>>>IIUC the danger of pre-allocating blocks is that we might not fill
>>>them,
>>>resulting in temp file much larger than necessary. It might be
>>>harmless
>>>on some (most?) current filesystems that don't actually allocate
>>>space
>>>for blocks that are never written, but it also confuses our
>>>accounting
>>>of temporary file sizes. So we should try to limit that, and growing
>>>the
>>>number of pre-allocated blocks over time seems reasonable.
>>
>>There's another danger here: it doesn't matter how well the filesystem
>>deals with sparse writes, because ltsWriteBlock fills in the holes with
>>zeros anyway. That's potentially a significant amount of wasted IO
>>effort if we aren't careful.
>>
>
>True. I'll give it a try on both machines and report some numbers. Might
>take a couple of days.
>
OK, so I do have some numbers to share. I think there's a clear
conclusion that the two patches are a huge improvement, but there's also
something fishy about planning of parallel queries.
Firstly, I have two machines that I used for testing:
1) small one: i5-2500k (4 cores), 8GB RAM, SSD RAID for data, SSD for
temporary tablespace, using TPC-H 32GB data set
2) big one: 2x xeon e5-2620v3 (8 cores), 64GB RAM, NVME SSD for data,
temporary tablespace on SATA RAID0 (3 x 7.2k), using TPC-H 75GB
serial queries (no parallelism)
===============================
Results with parallel query disabled on the two machines look like this:
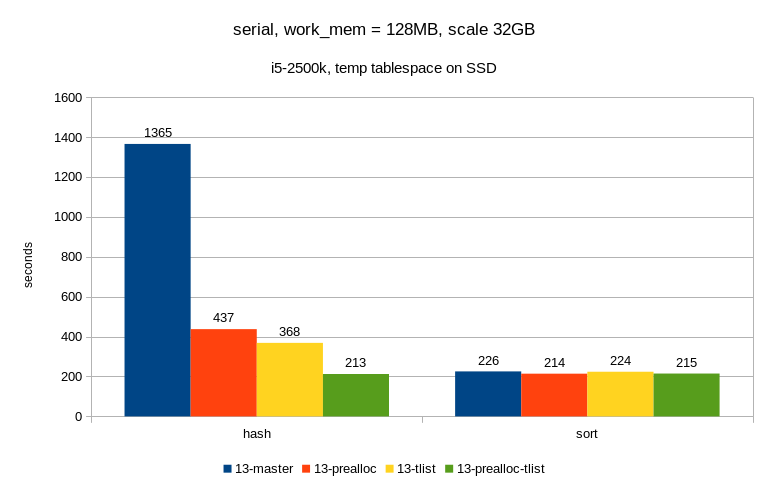
1) small one (SSD)
algorithm master prealloc tlist prealloc-tlist
--------------------------------------------------
hash 1365 437 368 213
sort 226 214 224 215
The sort row simply means "enable_hashagg = off" and AFAIK the patches
should not have a lot of influence here - the prealloc does, but it's
fairly negligible.
It's not always exactly on part, I've seen cases where hash or sort were
a bit faster (probably depending on work_mem), but I think we can ignore
that for now.
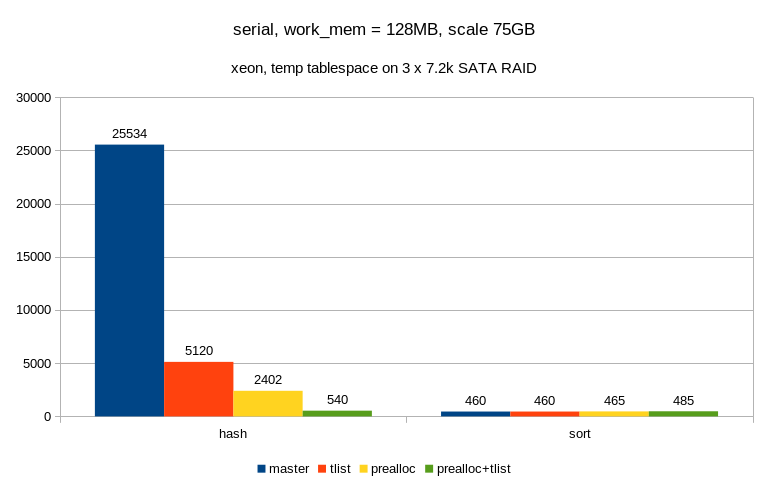
2) big one (SATA)
algorithm master tlist prealloc prealloc+tlist
--------------------------------------------------
hash 25534 5120 2402 540
sort 460 460 465 485
The effect is even more pronounced, thanks to poor handling of random
I/O by the SATA RAID device. It's not exactly on par with sort, but it's
close enough ...
parallel queries
================
And now the fun begins ...
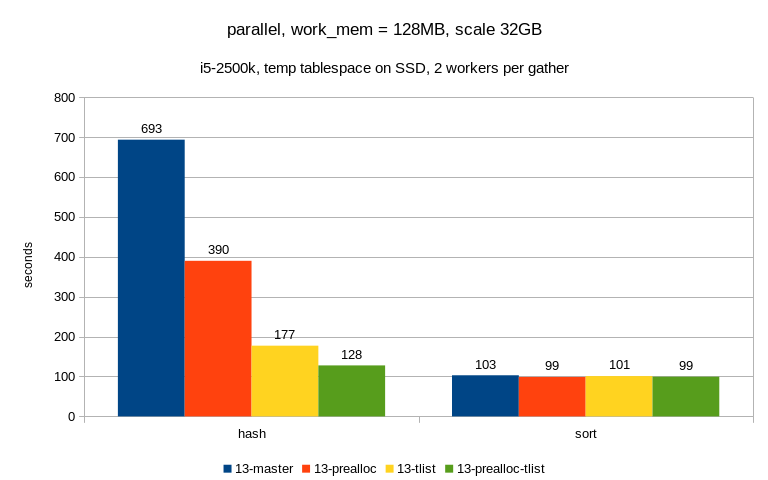
1) small one (SSD, max_parallel_workers_per_gather = 2)
algorithm master tlist prealloc prealloc+tlist
--------------------------------------------------
hash 693 390 177 128
sort 103 99 101 99
This looks pretty nice - the patches have the expected effect, it got
faster than with just a single CPU etc.
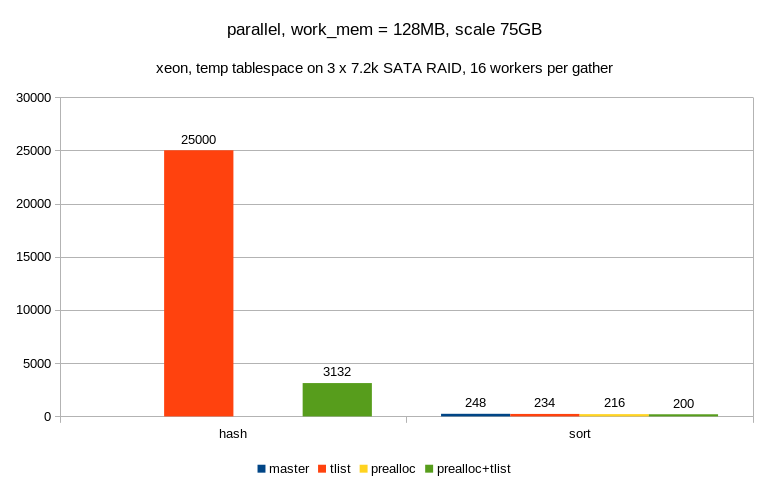
2) big one (SATA, max_parallel_workers_per_gather = 16)
algorithm master tlist prealloc prealloc+tlist
--------------------------------------------------
hash ? 25000 ? 3132
sort 248 234 216 200
Well, not that nice :-( The hash queries take so much time that I've
decided not to wait for them and the two numbers are actually just
estimates (after processing just a couple of logical tapes).
Plus it actually gets slower than with serial execution, so what's the
problem here? Especially considering it worked OK on the small machine?
At first I thought it's something about SSD vs. SATA, but it seems to be
more about how we construct the plans, because the plans between the two
machines are very different. And it seems to be depend by the number of
workers per gather - for low number of workers the plan looks like this
(the plans are attached in plans.txt in case the formatting gets broken
by your client):
QUERY PLAN
---------------------------------------------------------------------------------------------------------------
Limit
-> Aggregate
-> Hash Join
Hash Cond: (part.p_partkey = lineitem_1.l_partkey)
Join Filter: (lineitem.l_quantity < ((0.2 * avg(lineitem_1.l_quantity))))
-> Gather
Workers Planned: 2
-> Nested Loop
-> Parallel Seq Scan on part
Filter: ((p_brand = 'Brand#22'::bpchar) AND (p_container = 'LG BOX'::bpchar))
-> Index Scan using idx_lineitem_part_supp on lineitem
Index Cond: (l_partkey = part.p_partkey)
-> Hash
-> Finalize HashAggregate
Group Key: lineitem_1.l_partkey
-> Gather
Workers Planned: 2
-> Partial HashAggregate
Group Key: lineitem_1.l_partkey
-> Parallel Seq Scan on lineitem lineitem_1
(20 rows)
but then if I crank the number of workers up, it switches to this:
QUERY PLAN
---------------------------------------------------------------------------------------------------------------------
Limit
-> Finalize Aggregate
-> Gather
Workers Planned: 5
-> Partial Aggregate
-> Nested Loop
Join Filter: (part.p_partkey = lineitem.l_partkey)
-> Hash Join
Hash Cond: (part.p_partkey = lineitem_1.l_partkey)
-> Parallel Seq Scan on part
Filter: ((p_brand = 'Brand#22'::bpchar) AND (p_container = 'LG
BOX'::bpchar))
-> Hash
-> HashAggregate
Group Key: lineitem_1.l_partkey
-> Seq Scan on lineitem lineitem_1
-> Index Scan using idx_lineitem_part_supp on lineitem
Index Cond: (l_partkey = lineitem_1.l_partkey)
Filter: (l_quantity < ((0.2 * avg(lineitem_1.l_quantity))))
(18 rows)
Notice that in the first plan, the hashagg is on top of parallel-aware
path - so each workers builds hashagg only on a subset of data, and also
spills only a fraction of the input rows (so that all workers combined
spill rouhly the "whole" table).
In the second plan, the hashagg is on the non-partitioned side of the
join, so each workers builds a hash aggregate on the *whole* set of
input rows. Which means that (a) we need much more disk space for temp
files, making it unlikely to fit into page cache and (b) there's a lot
of contention for I/O, making it much more random.
Now, I haven't seen the second plan with sort-based aggregation, no
matter how I set the number of workers it always looks like this:
QUERY PLAN
---------------------------------------------------------------------------------------------------------------------
Limit
-> Aggregate
-> Merge Join
Merge Cond: (lineitem_1.l_partkey = part.p_partkey)
Join Filter: (lineitem.l_quantity < ((0.2 * avg(lineitem_1.l_quantity))))
-> Finalize GroupAggregate
Group Key: lineitem_1.l_partkey
-> Gather Merge
Workers Planned: 8
-> Partial GroupAggregate
Group Key: lineitem_1.l_partkey
-> Sort
Sort Key: lineitem_1.l_partkey
-> Parallel Seq Scan on lineitem lineitem_1
-> Materialize
-> Gather Merge
Workers Planned: 6
-> Nested Loop
-> Parallel Index Scan using part_pkey on part
Filter: ((p_brand = 'Brand#22'::bpchar) AND (p_container = 'LG
BOX'::bpchar))
-> Index Scan using idx_lineitem_part_supp on lineitem
Index Cond: (l_partkey = part.p_partkey)
(22 rows)
How come we don't have the same issue here? Is there something in the
optimizer that prevents us from creating the "silly" plans with
groupagg, and we should do the same thing for hashagg?
regards
--
Tomas Vondra http://www.2ndQuadrant.com
PostgreSQL Development, 24x7 Support, Remote DBA, Training & Services
Вложения
On Mon, May 25, 2020 at 04:10:45AM +0200, Tomas Vondra wrote:
>
> ...
>
>parallel queries
>================
>
>And now the fun begins ...
>
>
>1) small one (SSD, max_parallel_workers_per_gather = 2)
>
>    algorithm  master  tlist  prealloc  prealloc+tlist
>    --------------------------------------------------
>         hash   693      390       177             128
>         sort   103       99       101              99
>
>This looks pretty nice - the patches have the expected effect, it got
>faster than with just a single CPU etc.
>
>
>2) big one (SATA, max_parallel_workers_per_gather = 16)
>
>    algorithm  master  tlist  prealloc  prealloc+tlist
>    --------------------------------------------------
>         hash       ?  25000         ?            3132
>         sort     248    234       216             200
>
>Well, not that nice :-( The hash queries take so much time that I've
>decided not to wait for them and the two numbers are actually just
>estimates (after processing just a couple of logical tapes).
>
>Plus it actually gets slower than with serial execution, so what's the
>problem here? Especially considering it worked OK on the small machine?
>
>At first I thought it's something about SSD vs. SATA, but it seems to be
>more about how we construct the plans, because the plans between the two
>machines are very different. And it seems to be depend by the number of
>workers per gather - for low number of workers the plan looks like this
>(the plans are attached in plans.txt in case the formatting gets broken
>by your client):
>
>
>                                                      QUERY PLAN
>    ---------------------------------------------------------------------------------------------------------------
>     Limit
>       ->  Aggregate
>             ->  Hash Join
>                   Hash Cond: (part.p_partkey = lineitem_1.l_partkey)
>                   Join Filter: (lineitem.l_quantity < ((0.2 * avg(lineitem_1.l_quantity))))
>                   ->  Gather
>                         Workers Planned: 2
>                         ->  Nested Loop
>                               ->  Parallel Seq Scan on part
>                                     Filter: ((p_brand = 'Brand#22'::bpchar) AND (p_container = 'LG BOX'::bpchar))
>                               ->  Index Scan using idx_lineitem_part_supp on lineitem
>                                     Index Cond: (l_partkey = part.p_partkey)
>                   ->  Hash
>                         ->  Finalize HashAggregate
>                               Group Key: lineitem_1.l_partkey
>                               ->  Gather
>                                     Workers Planned: 2
>                                     ->  Partial HashAggregate
>                                           Group Key: lineitem_1.l_partkey
>                                           ->  Parallel Seq Scan on lineitem lineitem_1
>    (20 rows)
>
>but then if I crank the number of workers up, it switches to this:
>
>                                                         QUERY PLAN
>
---------------------------------------------------------------------------------------------------------------------
>     Limit
>       ->  Finalize Aggregate
>             ->  Gather
>                   Workers Planned: 5
>                   ->  Partial Aggregate
>                         ->  Nested Loop
>                               Join Filter: (part.p_partkey = lineitem.l_partkey)
>                               ->  Hash Join
>                                     Hash Cond: (part.p_partkey = lineitem_1.l_partkey)
>                                     ->  Parallel Seq Scan on part
>                                           Filter: ((p_brand = 'Brand#22'::bpchar) AND (p_container = 'LG
BOX'::bpchar))
>                                     ->  Hash
>                                           ->  HashAggregate
>                                                 Group Key: lineitem_1.l_partkey
>                                                 ->  Seq Scan on lineitem lineitem_1
>                               ->  Index Scan using idx_lineitem_part_supp on lineitem
>                                     Index Cond: (l_partkey = lineitem_1.l_partkey)
>                                     Filter: (l_quantity < ((0.2 * avg(lineitem_1.l_quantity))))
>    (18 rows)
>
>
>Notice that in the first plan, the hashagg is on top of parallel-aware
>path - so each workers builds hashagg only on a subset of data, and also
>spills only a fraction of the input rows (so that all workers combined
>spill rouhly the "whole" table).
>

OK, I've done an experiment and re-ran the test with

     max_parallel_workers_per_gather = 5

which is the highest value still giving the "good" plan, and the results
look like this:

            master    tlist    prealloc    prealloc+tlist
     ----------------------------------------------------
     hash    10535     1044        1723               407
     sort      198      196         192               219

which is obviously *way* better than the numbers with more workers:

>    algorithm  master  tlist  prealloc  prealloc+tlist
>    --------------------------------------------------
>         hash       ?  25000         ?            3132
>         sort     248    234       216             200

It's still ~2x slower than the sort, so presumably we'll need to tweak
the costing somehow. I do belive this is still due to differences in I/O
patterns, with parallel hashagg probably being a bit more random (I'm
deducing that from SSD not being affected by this).

I'd imagine this is because given the same work_mem value, sort tends to
create "sorted chunks" that are then merged into larger runs, making it
more sequential. OTOH hashagg likely makes it more random with smaller
work_mem values - more batches making it more interleaved / random.


This does not explain why we end up with the "bad" plans, though.

Attached are two files showing how the plan changes for different number
of workers per gather, both for groupagg and hashagg. For groupagg the
plan shape does not change at all, for hashagg it starts as "good" and
then between 5 and 6 switches to "bad" one.

There's another interesting thing I just noticed - as we increase the
number of workers, the cost estimate actually starts to grow at some
point:

    workers | plan cost
          0 | 23594267
     1 | 20155545
     2 | 19785306
     5 | 22718176 <-
     6 | 23063639
    10 | 22990594
    12 | 22972363

AFAIK this happens because we pick the number of workers simply based on
size of the input relation, which ignores the cost due to sending data
from workers to leaders (parallel_tuple_cost).  Which in this case is
quite significant, because each worker produces large number of groups.
I don't think this is causing the issue, though, because the sort plans
behave the same way. (I wonder if we could/should consider different
number of workers, somehow.)

We probably can't see these plans on 12 simply because hashagg would
need more memory than work_mem (especially in parallel mode), so we
simply reject them.


regards

--
Tomas Vondra                  http://www.2ndQuadrant.com
PostgreSQL Development, 24x7 Support, Remote DBA, Training & Services
Вложения
On Mon, 2020-05-25 at 04:10 +0200, Tomas Vondra wrote:
>      algorithm  master  prealloc  tlist  prealloc-tlist
>      --------------------------------------------------
>           hash    1365       437    368             213
>           sort     226       214    224             215
>
> The sort row simply means "enable_hashagg = off" and AFAIK the
> patches
> should not have a lot of influence here - the prealloc does, but it's
> fairly negligible.

I also say a small speedup from the prealloc patch for Sort. I wrote if
off initially, but I'm wondering if there's something going on there.
Perhaps drawing K elements from the minheap at once is better for
caching? If so, that's good news, because it means the prealloc list is
a win-win.

>                           ->  Finalize HashAggregate
>                                 Group Key: lineitem_1.l_partkey
>                                 ->  Gather
>                                       Workers Planned: 2
>                                       ->  Partial HashAggregate
>                                             Group Key:
> lineitem_1.l_partkey
>                                             ->  Parallel Seq Scan on
> lineitem lineitem_1
>      (20 rows)

Although each worker here only gets half the tuples, it will get
(approximately) all of the *groups*. This may partly explain why the
planner moves away from this plan when there are more workers: the
number of hashagg batches doesn't go down much with more workers.

It also might be interesting to know the estimate for the number of
groups relative to the size of the table. If those two are close, it
might look to the planner like processing the whole input in each
worker isn't much worse than processing all of the groups in each
worker.

Regards,
    Jeff Davis
On Mon, 2020-05-25 at 14:17 +0200, Tomas Vondra wrote:
> It's still ~2x slower than the sort, so presumably we'll need to
> tweak
> the costing somehow.

One thing to think about is that the default random_page_cost is only
4X seq_page_cost. We know that's complete fiction, but it's meant to
paper over the OS caching effects. It seems like that shortcut may be
what's hurting us now.

HashAgg counts 1/2 of the page accesses as random, whereas Sort only
counts 1/4 as random. If the random_page_cost were closer to reality,
HashAgg would already be penalized substantially. It might be
interesting to test with higher values of random_page_cost and see what
the planner does.

If we want to be a bit more conservative, I'm fine with adding a
general penalty against a HashAgg that we expect to spill (multiply the
disk costs by some factor). We can consider removing the penalty in
v14.

> I do belive this is still due to differences in I/O
> patterns, with parallel hashagg probably being a bit more random (I'm
> deducing that from SSD not being affected by this).

Do you think the difference in IO patterns is due to a difference in
handling reads vs. writes in the kernel? Or do you think that 128
blocks is not enough to amortize the cost of a seek for that device?

Regards,
    Jeff Davis
On Mon, May 25, 2020 at 11:36:42AM -0700, Jeff Davis wrote:
>On Mon, 2020-05-25 at 04:10 +0200, Tomas Vondra wrote:
>>      algorithm  master  prealloc  tlist  prealloc-tlist
>>      --------------------------------------------------
>>           hash    1365       437    368             213
>>           sort     226       214    224             215
>>
>> The sort row simply means "enable_hashagg = off" and AFAIK the
>> patches
>> should not have a lot of influence here - the prealloc does, but it's
>> fairly negligible.
>
>I also say a small speedup from the prealloc patch for Sort. I wrote if
>off initially, but I'm wondering if there's something going on there.
>Perhaps drawing K elements from the minheap at once is better for
>caching? If so, that's good news, because it means the prealloc list is
>a win-win.
>

True.


>>                           ->  Finalize HashAggregate
>>                                 Group Key: lineitem_1.l_partkey
>>                                 ->  Gather
>>                                       Workers Planned: 2
>>                                       ->  Partial HashAggregate
>>                                             Group Key:
>> lineitem_1.l_partkey
>>                                             ->  Parallel Seq Scan on
>> lineitem lineitem_1
>>      (20 rows)
>
>Although each worker here only gets half the tuples, it will get
>(approximately) all of the *groups*. This may partly explain why the
>planner moves away from this plan when there are more workers: the
>number of hashagg batches doesn't go down much with more workers.
>
>It also might be interesting to know the estimate for the number of
>groups relative to the size of the table. If those two are close, it
>might look to the planner like processing the whole input in each
>worker isn't much worse than processing all of the groups in each
>worker.
>

Hmmm, yeah. The number of groups per worker is another moving part. But
isn't the number of groups per worker pretty much the same (and equal to
the total number of groups) in all plans? I mean all the plans (both
hash and sort based) have this:

   ->  Finalize HashAggregate  (cost=18313351.98..18654393.43 rows=14949762 width=36)
         Group Key: lineitem_1.l_partkey
         Planned Partitions: 64
         ->  Gather  (cost=14993231.96..17967638.74 rows=14949762 width=36)
               Workers Planned: 1
               ->  Partial HashAggregate  (cost=14992231.96..16471662.54 rows=14949762 width=36)
                     Group Key: lineitem_1.l_partkey
                     Planned Partitions: 64
                     ->  Parallel Seq Scan on lineitem lineitem_1  (cost=0.00..11083534.91 rows=264715991 width=9)

I think it's rather that we actually expect this number of rows from
each worker, so the total cost is

     parallel_tuple_cost * num_of_workers * num_of_groups

But we just ignore this inherent cost when picking the number of
workers, don't we? Because we don't know how many rows will be produced
and passed to the Gather in the end.


regards

--
Tomas Vondra                  http://www.2ndQuadrant.com
PostgreSQL Development, 24x7 Support, Remote DBA, Training & Services
On Mon, May 25, 2020 at 12:49:45PM -0700, Jeff Davis wrote:
>On Mon, 2020-05-25 at 14:17 +0200, Tomas Vondra wrote:
>> It's still ~2x slower than the sort, so presumably we'll need to
>> tweak
>> the costing somehow.
>
>One thing to think about is that the default random_page_cost is only
>4X seq_page_cost. We know that's complete fiction, but it's meant to
>paper over the OS caching effects. It seems like that shortcut may be
>what's hurting us now.
>
>HashAgg counts 1/2 of the page accesses as random, whereas Sort only
>counts 1/4 as random. If the random_page_cost were closer to reality,
>HashAgg would already be penalized substantially. It might be
>interesting to test with higher values of random_page_cost and see what
>the planner does.
>

Hmmm, good point. I've tried bumping the random_page_cost up (to 40) and
the bogus plans disappeared - instead, the parallel plans switch from
hashagg to groupagg at 4 workers. There's a lot of parameters affecting
this, though (e.g. higher work_mem -> more workers use hashagg).

One thing annoys me, though. The costing just ignores costs set on the
(temporary) tablespace, which confused me at first because

     ALTER TABLESPACE temp SET (random_page_cost = 40);

had absolutely no effect. It's not the fault of this patch and it's
actually understandable (we can have multiple temp tablespaces, and we
don't know which one will end up being used).

I wonder if it would be a good idea to have "temp" version of those cost
variables, applied to all temporary tablespaces ... Currently I have to
do the inverse thing - tweak this for all regular tablespaces.

>If we want to be a bit more conservative, I'm fine with adding a
>general penalty against a HashAgg that we expect to spill (multiply the
>disk costs by some factor). We can consider removing the penalty in
>v14.
>

Not sure, I need to look at the costing a bit.

I see all page writes are random while all page reads are sequential.
Shouldn't this consider the number of tapes and that we pre-allocate
blocks?  Essentially, We split the whole file into chunks of 128 blocks
that can be read sequentially, and switch between blocks are random.

Not sure if that's necessary, though. If increasing random_page_cost
pushes the plans to groupagg, then maybe that's good enough.

Let's push the two fixes that we already have. These extra questions
clearly need more investigation and testing, and I'm not even sure it's
something we should pursue for v13.

>> I do belive this is still due to differences in I/O
>> patterns, with parallel hashagg probably being a bit more random (I'm
>> deducing that from SSD not being affected by this).
>
>Do you think the difference in IO patterns is due to a difference in
>handling reads vs. writes in the kernel? Or do you think that 128
>blocks is not enough to amortize the cost of a seek for that device?
>

I don't know. I kinda imagined it was due to the workers interfering
with each other, but that should affect the sort the same way, right?
I don't have any data to support this, at the moment - I can repeat
the iosnoop tests and analyze the data, of course.

regards

--
Tomas Vondra                  http://www.2ndQuadrant.com
PostgreSQL Development, 24x7 Support, Remote DBA, Training & Services
On Tue, May 26, 2020 at 10:59 AM Tomas Vondra
<tomas.vondra@2ndquadrant.com> wrote:
> On Mon, May 25, 2020 at 12:49:45PM -0700, Jeff Davis wrote:
> >Do you think the difference in IO patterns is due to a difference in
> >handling reads vs. writes in the kernel? Or do you think that 128
> >blocks is not enough to amortize the cost of a seek for that device?
>
> I don't know. I kinda imagined it was due to the workers interfering
> with each other, but that should affect the sort the same way, right?
> I don't have any data to support this, at the moment - I can repeat
> the iosnoop tests and analyze the data, of course.

About the reads vs writes question:  I know that reading and writing
two interleaved sequential "streams" through the same fd confuses the
read-ahead/write-behind heuristics on FreeBSD UFS (I mean: w(1),
r(42), w(2), r(43), w(3), r(44), ...) so the performance is terrible
on spinning media.  Andrew Gierth reported that as a problem for
sequential scans that are also writing back hint bits, and vacuum.
However, in a quick test on a Linux 4.19 XFS system, using a program
to generate interleaving read and write streams 1MB apart, I could see
that it was still happily generating larger clustered I/Os.  I have no
clue for other operating systems.  That said, even on Linux, reads and
writes still have to compete for scant IOPS on slow-seek media (albeit
hopefully in larger clustered I/Os)...

Jumping over large interleaving chunks with no prefetching from other
tapes *must* produce stalls though... and if you crank up the read
ahead size to be a decent percentage of the contiguous chunk size, I
guess you must also waste I/O bandwidth on unwanted data past the end
of each chunk, no?

In an off-list chat with Jeff about whether Hash Join should use
logtape.c for its partitions too, the first thought I had was that to
be competitive with separate files, perhaps you'd need to write out a
list of block ranges for each tape (rather than just next pointers on
each block), so that you have the visibility required to control
prefetching explicitly.  I guess that would be a bit like the list of
physical extents that Linux commands like filefrag(8) and xfs_bmap(8)
can show you for regular files.  (Other thoughts included worrying
about how to make it allocate and stream blocks in parallel queries,
...!?#$)
On Tue, May 26, 2020 at 05:02:41PM +1200, Thomas Munro wrote:
>On Tue, May 26, 2020 at 10:59 AM Tomas Vondra
><tomas.vondra@2ndquadrant.com> wrote:
>> On Mon, May 25, 2020 at 12:49:45PM -0700, Jeff Davis wrote:
>> >Do you think the difference in IO patterns is due to a difference in
>> >handling reads vs. writes in the kernel? Or do you think that 128
>> >blocks is not enough to amortize the cost of a seek for that device?
>>
>> I don't know. I kinda imagined it was due to the workers interfering
>> with each other, but that should affect the sort the same way, right?
>> I don't have any data to support this, at the moment - I can repeat
>> the iosnoop tests and analyze the data, of course.
>
>About the reads vs writes question:  I know that reading and writing
>two interleaved sequential "streams" through the same fd confuses the
>read-ahead/write-behind heuristics on FreeBSD UFS (I mean: w(1),
>r(42), w(2), r(43), w(3), r(44), ...) so the performance is terrible
>on spinning media.  Andrew Gierth reported that as a problem for
>sequential scans that are also writing back hint bits, and vacuum.
>However, in a quick test on a Linux 4.19 XFS system, using a program
>to generate interleaving read and write streams 1MB apart, I could see
>that it was still happily generating larger clustered I/Os.  I have no
>clue for other operating systems.  That said, even on Linux, reads and
>writes still have to compete for scant IOPS on slow-seek media (albeit
>hopefully in larger clustered I/Os)...
>

True. I've repeated the tests with collection of iosnoop stats, both for
the good (partitioned hashagg) and bad (complete hashagg in each worker)
plans. Ignoring the fact that the bad plan does much more I/O in general
(about 32GB write + 35GB reads vs. 5.4GB + 7.6GB), request size stats
are almost exactly the same:

1) good plan (partitioned hashagg, ~180 seconds)

      type |  bytes  | count |  pct
     ------+---------+-------+-------
      RA   |  131072 | 39392 | 71.62
      RA   |    8192 |  5666 | 10.30
      RA   |   16384 |  3080 |  5.60
      RA   |   32768 |  2888 |  5.25
      RA   |   65536 |  2870 |  5.22
      RA   |  262144 |   710 |  1.29
      W    | 1310720 |  3138 | 32.01
      W    |  360448 |   633 |  6.46
      W    |  688128 |   538 |  5.49
      W    |  692224 |   301 |  3.07
      W    |  364544 |   247 |  2.52
      W    |  696320 |   182 |  1.86
      W    |    8192 |   164 |  1.67
      W    |  700416 |   116 |  1.18
      W    |  368640 |   102 |  1.04

2) bad plan (complete hashagg, ~500 seconds)

      type |  bytes  | count  |  pct
     ------+---------+--------+--------
      RA   |  131072 | 258924 |  68.54
      RA   |    8192 |  31357 |   8.30
      RA   |   16384 |  27596 |   7.31
      RA   |   32768 |  26434 |   7.00
      RA   |   65536 |  26415 |   6.99
      RM   |    4096 |    532 | 100.00
      W    | 1310720 |  15346 |  34.64
      W    |    8192 |    911 |   2.06
      W    |  360448 |    816 |   1.84
      W    |   16384 |    726 |   1.64
      W    |  688128 |    545 |   1.23
      W    |   32768 |    544 |   1.23
      W    |   40960 |    486 |   1.10
      W    |  524288 |    457 |   1.03

So in both cases, majority of read requests (~70%) are 128kB, with
additional ~25% happening in request larger than 8kB. In terms of I/O,
that's more than 90% of read I/O.

There is some difference in the "I/O delta" stats, showing how far the
queued I/O requests are. The write stats look almost exactly the same,
but for reads it looks like this:

1) good plan

      type | block_delta | count |  pct
     ------+-------------+-------+-------
      RA   |         256 |  7555 | 13.74
      RA   |          64 |  2297 |  4.18
      RA   |          32 |   685 |  1.25
      RA   |         128 |   613 |  1.11
      RA   |          16 |   612 |  1.11

2) bad plans

      type | block_delta | count |  pct
     ------+-------------+-------+-------
      RA   |          64 | 18817 |  4.98
      RA   |       30480 |  9778 |  2.59
      RA   |         256 |  9437 |  2.50

Ideally this should match the block size stats (it's in sectors, so 256
is 128kB). Unfortunately this does not work all that great - even for
the "good" plan it's only about 14% vs. 70% (of 128kB blocks). In the
serial plan (disabled parallelism) this was ~70% vs. 75%, much closer.

Anyway, I think this shows that the read-ahead works pretty well even
with multiple workers - otherwise there wouldn't be that many 128kB
requests. The poor correlation with 128kB deltas is unfortunate, but I
don't think we can really fix that.

This was on linux (5.6.0) with ext4, but I don't think the filesystem
matters that much - the read-ahead happens in page cache I think.

>Jumping over large interleaving chunks with no prefetching from other
>tapes *must* produce stalls though... and if you crank up the read
>ahead size to be a decent percentage of the contiguous chunk size, I
>guess you must also waste I/O bandwidth on unwanted data past the end
>of each chunk, no?
>
>In an off-list chat with Jeff about whether Hash Join should use
>logtape.c for its partitions too, the first thought I had was that to
>be competitive with separate files, perhaps you'd need to write out a
>list of block ranges for each tape (rather than just next pointers on
>each block), so that you have the visibility required to control
>prefetching explicitly.  I guess that would be a bit like the list of
>physical extents that Linux commands like filefrag(8) and xfs_bmap(8)
>can show you for regular files.  (Other thoughts included worrying
>about how to make it allocate and stream blocks in parallel queries,
>...!?#$)

I was wondering how useful would it be to do explicit prefetch too.

I'm not familiar with logtape internals but IIRC the blocks are linked
by each block having a pointer to the prev/next block, which means we
can't prefetch more than one block ahead I think. But maybe I'm wrong,
or maybe fetching even just one block ahead would help ...

regards

--
Tomas Vondra                  http://www.2ndQuadrant.com
PostgreSQL Development, 24x7 Support, Remote DBA, Training & Services
Вложения
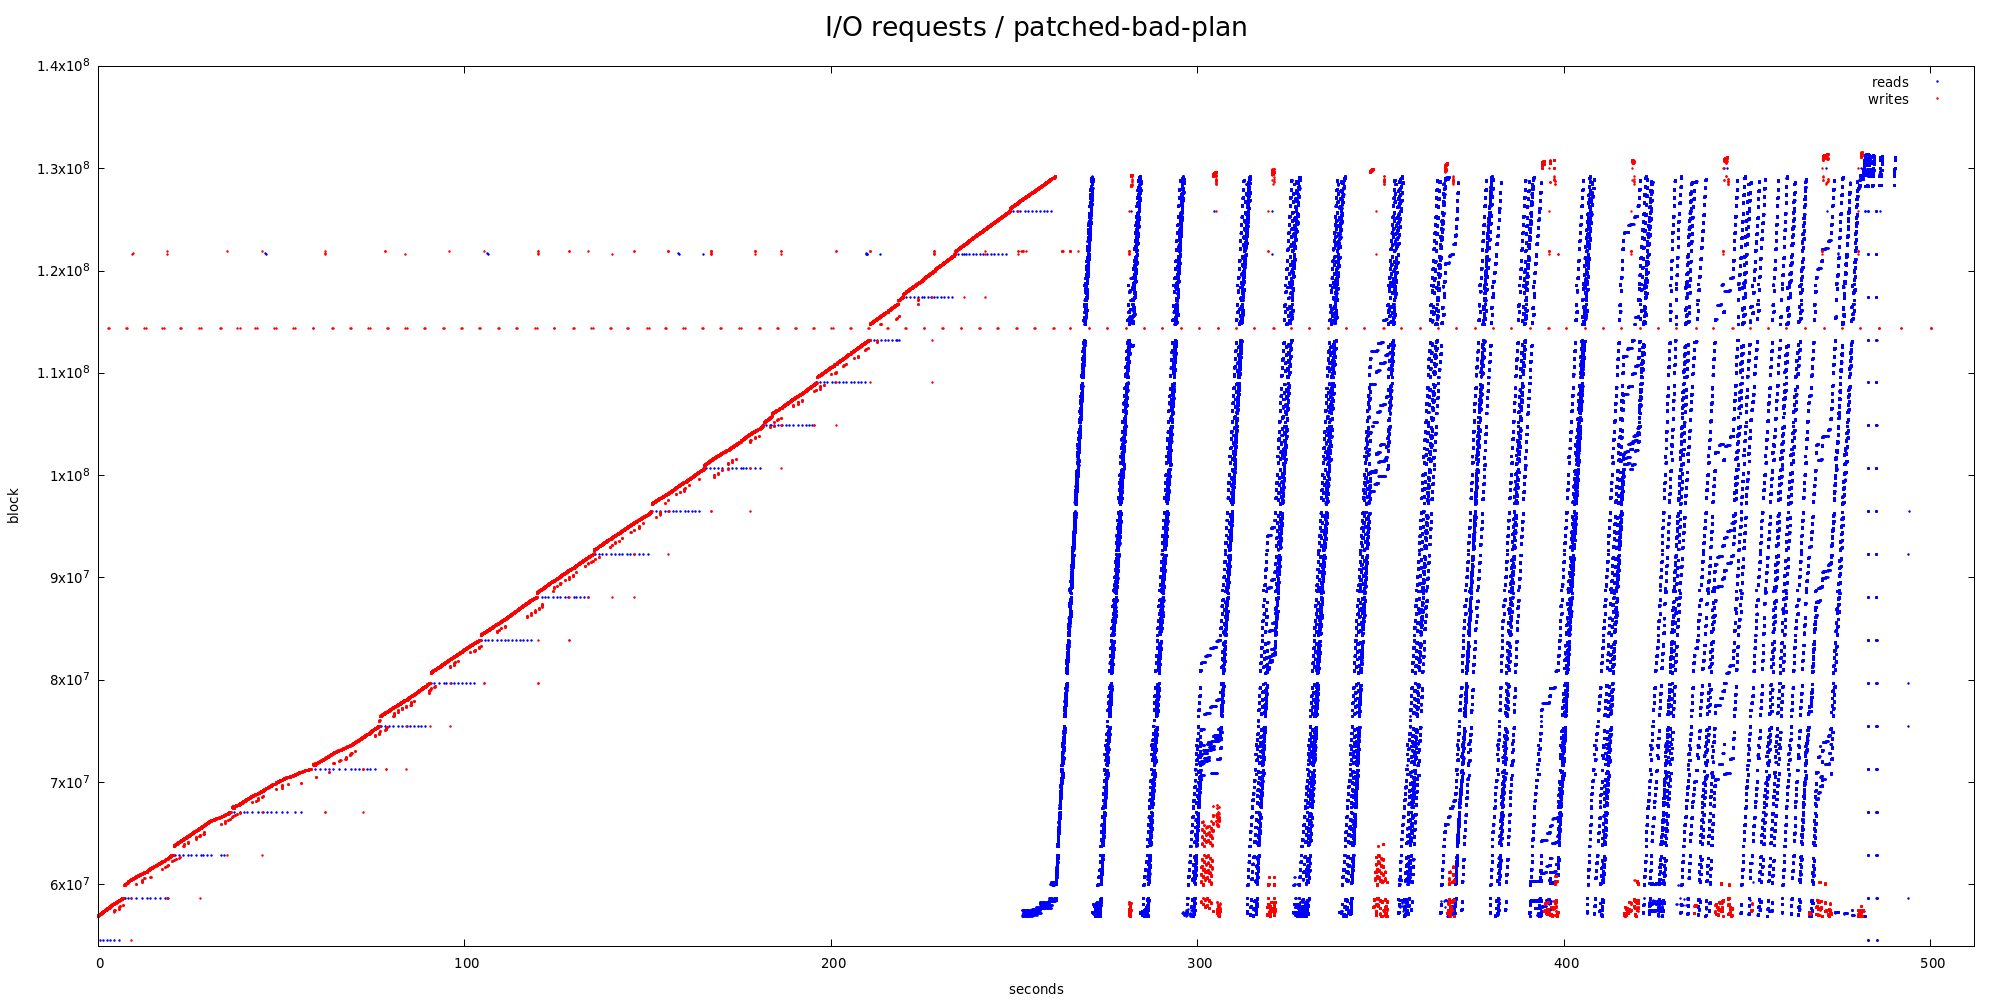
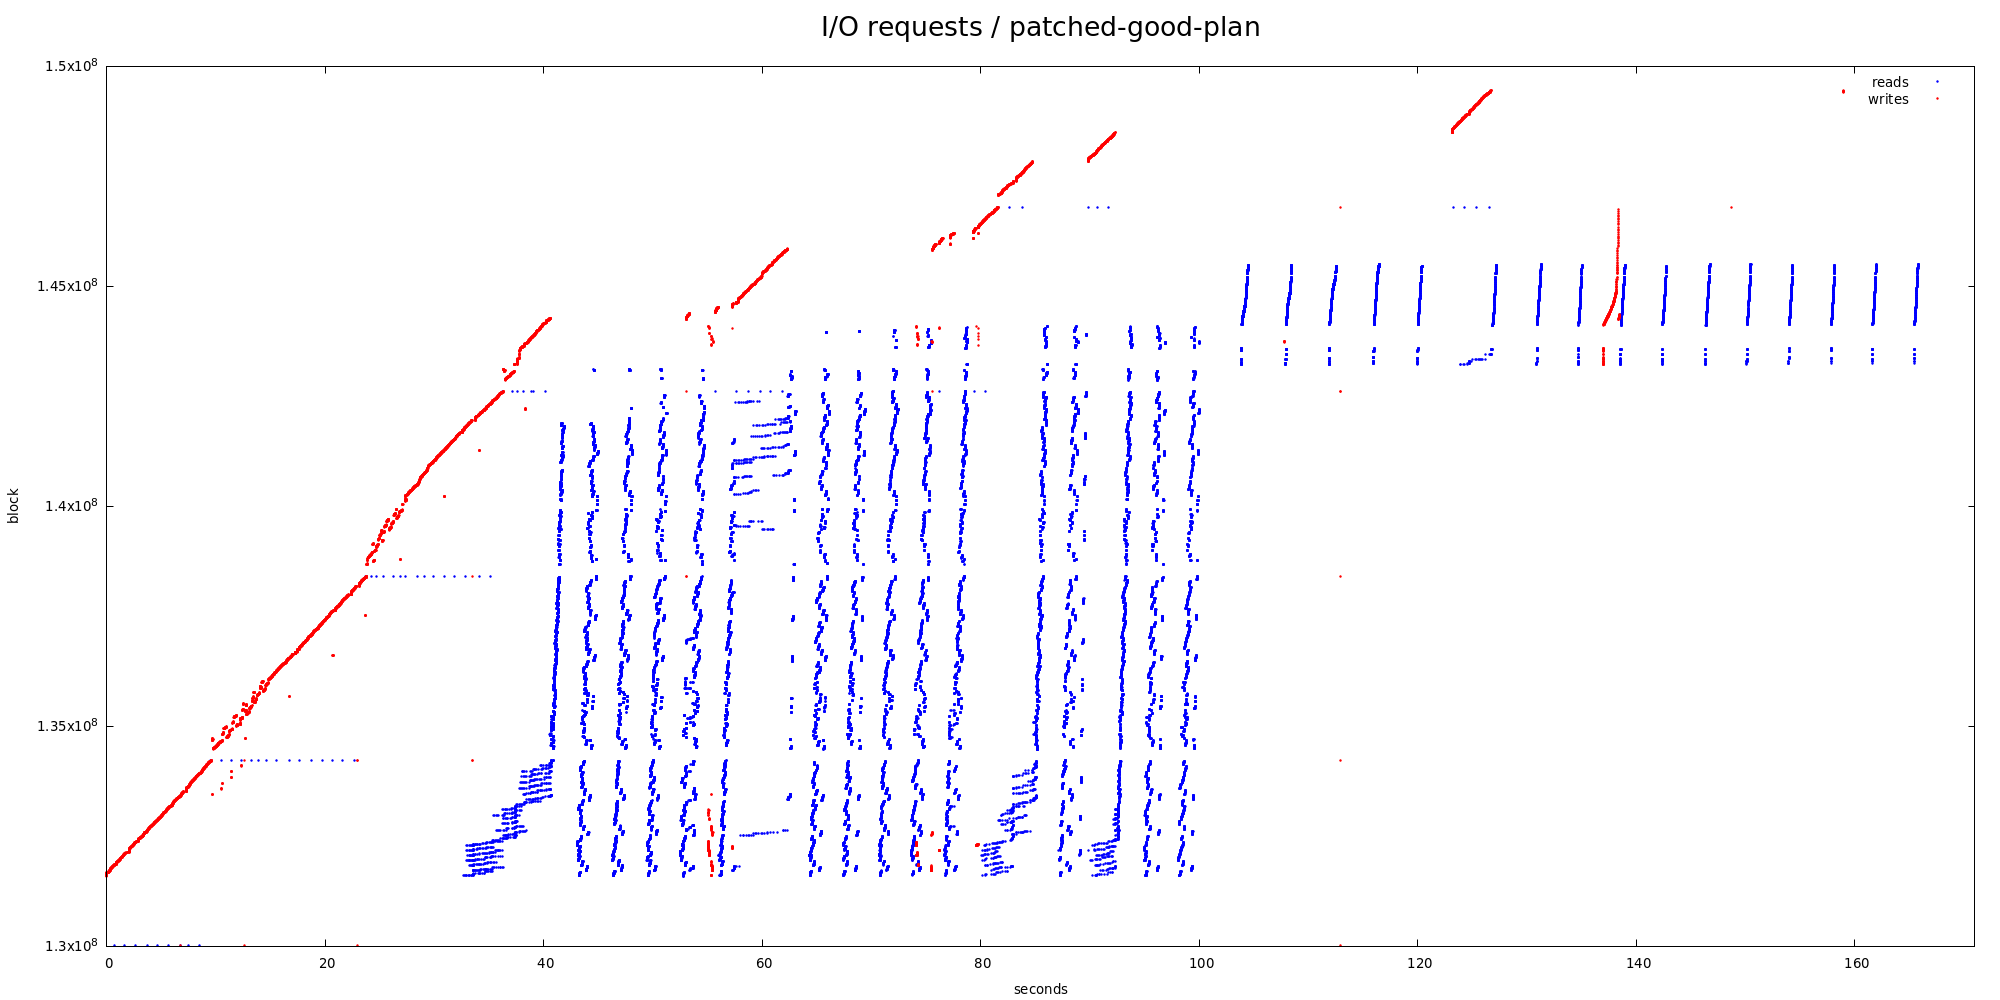
On Tue, 2020-05-26 at 16:15 +0200, Tomas Vondra wrote:
> I'm not familiar with logtape internals but IIRC the blocks are
> linked
> by each block having a pointer to the prev/next block, which means we
> can't prefetch more than one block ahead I think. But maybe I'm
> wrong,
> or maybe fetching even just one block ahead would help ...

We'd have to get creative. Keeping a directory in the LogicalTape
structure might work, but I'm worried the memory requirements would be
too high.

One idea is to add a "prefetch block" to the TapeBlockTrailer (perhaps
only in the forward direction?). We could modify the prealloc list so
that we always know the next K blocks that will be allocated to the
tape. All for v14, of course, but I'd be happy to hack together a
prototype to collect data.

Do you have any other thoughts on the current prealloc patch for v13,
or is it about ready for commit?

Regards,
    Jeff Davis
On Tue, May 26, 2020 at 11:40:07AM -0700, Jeff Davis wrote:
>On Tue, 2020-05-26 at 16:15 +0200, Tomas Vondra wrote:
>> I'm not familiar with logtape internals but IIRC the blocks are
>> linked
>> by each block having a pointer to the prev/next block, which means we
>> can't prefetch more than one block ahead I think. But maybe I'm
>> wrong,
>> or maybe fetching even just one block ahead would help ...
>
>We'd have to get creative. Keeping a directory in the LogicalTape
>structure might work, but I'm worried the memory requirements would be
>too high.
>
>One idea is to add a "prefetch block" to the TapeBlockTrailer (perhaps
>only in the forward direction?). We could modify the prealloc list so
>that we always know the next K blocks that will be allocated to the
>tape. All for v14, of course, but I'd be happy to hack together a
>prototype to collect data.
>

Yeah. I agree prefetching is definitely out of v13 scope. It might be
interesting to try how useful would it be, if you're willing to spend
some time on a prototype.

>
>Do you have any other thoughts on the current prealloc patch for v13,
>or is it about ready for commit?
>

I think it's pretty much ready to go.

I have some some doubts about the maximum value (128 probably means
read-ahead values above 256 are probably pointless, although I have not
tested that). But it's still a huge improvement with 128, so let's get
that committed.

I've been thinking about actually computing the expected number of
blocks per tape, and tying the maximum to that, somehow. But that's
something we can look at in the future.

As for the tlist fix, I think that's mostly ready too - the one thing we
should do is probably only doing it for AGG_HASHED. For AGG_SORTED it's
not really necessary.


iregards

--
Tomas Vondra                  http://www.2ndQuadrant.com
PostgreSQL Development, 24x7 Support, Remote DBA, Training & Services
On Tue, 2020-05-26 at 21:15 +0200, Tomas Vondra wrote:
> Yeah. I agree prefetching is definitely out of v13 scope. It might be
> interesting to try how useful would it be, if you're willing to spend
> some time on a prototype.

I think a POC would be pretty quick; I'll see if I can hack something
together.

> I think it's pretty much ready to go.

Committed with max of 128 preallocated blocks. Minor revisions.

>
> As for the tlist fix, I think that's mostly ready too - the one thing
> we
> should do is probably only doing it for AGG_HASHED. For AGG_SORTED
> it's
> not really necessary.

Melanie previously posted a patch to avoid spilling unneeded columns,
but it introduced more code:


https://www.postgresql.org/message-id/CAAKRu_aefEsv+UkQWqu+ioEnoiL2LJu9Diuh9BR8MbyXuZ0j4A@mail.gmail.com

and it seems that Heikki also looked at it. Perhaps we should get an
acknowledgement from one of them that your one-line change is the right
approach?

Regards,
    Jeff Davis
On Tue, May 26, 2020 at 5:40 PM Jeff Davis <pgsql@j-davis.com> wrote:
On Tue, 2020-05-26 at 21:15 +0200, Tomas Vondra wrote:
>
> As for the tlist fix, I think that's mostly ready too - the one thing
> we
> should do is probably only doing it for AGG_HASHED. For AGG_SORTED
> it's
> not really necessary.
Melanie previously posted a patch to avoid spilling unneeded columns,
but it introduced more code:
https://www.postgresql.org/message-id/CAAKRu_aefEsv+UkQWqu+ioEnoiL2LJu9Diuh9BR8MbyXuZ0j4A@mail.gmail.com
and it seems that Heikki also looked at it. Perhaps we should get an
acknowledgement from one of them that your one-line change is the right
approach?
I spent some time looking at it today, and, it turns out I was wrong.
I thought that there was a case I had found where CP_SMALL_TLIST did not
eliminate as many columns as could be eliminated for the purposes of
spilling, but, that turned out not to be the case.
I changed CP_LABEL_TLIST to CP_SMALL_TLIST in
create_groupingsets_plan(), create_agg_plan(), etc and tried a bunch of
different queries and this 2-3 line change worked for all the cases I
tried. Is that where you made the change?
And then are you proposing to set it based on the aggstrategy to either
CP_LABEL_TLIST or CP_SMALL_TLIST here?
--
Melanie Plageman
On Tue, May 26, 2020 at 06:42:50PM -0700, Melanie Plageman wrote:
>On Tue, May 26, 2020 at 5:40 PM Jeff Davis <pgsql@j-davis.com> wrote:
>
>> On Tue, 2020-05-26 at 21:15 +0200, Tomas Vondra wrote:
>> >
>> > As for the tlist fix, I think that's mostly ready too - the one thing
>> > we
>> > should do is probably only doing it for AGG_HASHED. For AGG_SORTED
>> > it's
>> > not really necessary.
>>
>> Melanie previously posted a patch to avoid spilling unneeded columns,
>> but it introduced more code:
>>
>>
>>
>> https://www.postgresql.org/message-id/CAAKRu_aefEsv+UkQWqu+ioEnoiL2LJu9Diuh9BR8MbyXuZ0j4A@mail.gmail.com
>>
>> and it seems that Heikki also looked at it. Perhaps we should get an
>> acknowledgement from one of them that your one-line change is the right
>> approach?
>>
>>
>I spent some time looking at it today, and, it turns out I was wrong.
>
>I thought that there was a case I had found where CP_SMALL_TLIST did not
>eliminate as many columns as could be eliminated for the purposes of
>spilling, but, that turned out not to be the case.
>
>I changed CP_LABEL_TLIST to CP_SMALL_TLIST in
>create_groupingsets_plan(), create_agg_plan(), etc and tried a bunch of
>different queries and this 2-3 line change worked for all the cases I
>tried. Is that where you made the change?

I've only made the change in create_agg_plan, because that's what was in
the query plan I was investigating. You may be right that the same fix
is needed in additional places, though.

>And then are you proposing to set it based on the aggstrategy to either
>CP_LABEL_TLIST or CP_SMALL_TLIST here?
>

Yes, something like that. The patch I shared on on 5/21 just changed
that, but I'm wondering if that could add overhead for sorted
aggregation, which already does the projection thanks to the sort.


regards

--
Tomas Vondra                  http://www.2ndQuadrant.com
PostgreSQL Development, 24x7 Support, Remote DBA, Training & Services
On Wed, May 27, 2020 at 11:07:04AM +0200, Tomas Vondra wrote:
>On Tue, May 26, 2020 at 06:42:50PM -0700, Melanie Plageman wrote:
>>On Tue, May 26, 2020 at 5:40 PM Jeff Davis <pgsql@j-davis.com> wrote:
>>
>>>On Tue, 2020-05-26 at 21:15 +0200, Tomas Vondra wrote:
>>>>
>>>> As for the tlist fix, I think that's mostly ready too - the one thing
>>>> we
>>>> should do is probably only doing it for AGG_HASHED. For AGG_SORTED
>>>> it's
>>>> not really necessary.
>>>
>>>Melanie previously posted a patch to avoid spilling unneeded columns,
>>>but it introduced more code:
>>>
>>>
>>>
>>>https://www.postgresql.org/message-id/CAAKRu_aefEsv+UkQWqu+ioEnoiL2LJu9Diuh9BR8MbyXuZ0j4A@mail.gmail.com
>>>
>>>and it seems that Heikki also looked at it. Perhaps we should get an
>>>acknowledgement from one of them that your one-line change is the right
>>>approach?
>>>
>>>
>>I spent some time looking at it today, and, it turns out I was wrong.
>>
>>I thought that there was a case I had found where CP_SMALL_TLIST did not
>>eliminate as many columns as could be eliminated for the purposes of
>>spilling, but, that turned out not to be the case.
>>
>>I changed CP_LABEL_TLIST to CP_SMALL_TLIST in
>>create_groupingsets_plan(), create_agg_plan(), etc and tried a bunch of
>>different queries and this 2-3 line change worked for all the cases I
>>tried. Is that where you made the change?
>
>I've only made the change in create_agg_plan, because that's what was in
>the query plan I was investigating. You may be right that the same fix
>is needed in additional places, though.
>

Attached is a patch adding CP_SMALL_TLIST to create_agg_plan and
create_groupingsets_plan. I've looked at the other places that I think
seem like they might benefit from it (create_upper_unique_plan,
create_group_plan) but I think we don't need to modify those - there'll
either be a Sort of HashAgg, which will take care about the projection.

Or do you think some other places need CP_SMALL_TLIST?


>>And then are you proposing to set it based on the aggstrategy to either
>>CP_LABEL_TLIST or CP_SMALL_TLIST here?
>>
>
>Yes, something like that. The patch I shared on on 5/21 just changed
>that, but I'm wondering if that could add overhead for sorted
>aggregation, which already does the projection thanks to the sort.
>

I ended up tweaking the tlist only for AGG_MIXED and AGG_HASHED. We
clearly don't need it for AGG_PLAIN or AGG_SORTED. This way we don't
break regression tests by adding unnecessary "Subquery Scan" nodes.


regards

--
Tomas Vondra                  http://www.2ndQuadrant.com
PostgreSQL Development, 24x7 Support, Remote DBA, Training & Services
Вложения
On Tue, 2020-05-26 at 17:40 -0700, Jeff Davis wrote:
> On Tue, 2020-05-26 at 21:15 +0200, Tomas Vondra wrote:
> > Yeah. I agree prefetching is definitely out of v13 scope. It might
> > be
> > interesting to try how useful would it be, if you're willing to
> > spend
> > some time on a prototype.
>
> I think a POC would be pretty quick; I'll see if I can hack something
> together.

Attached (intended for v14).

I changed the list from a simple array to a circular buffer so that we
can keep enough preallocated block numbers in it to do prefetching.

On SSD I didn't see any improvement, but perhaps it will do better on
magnetic storage.

Regards,
    Jeff Davis
Вложения
On Thu, 2020-05-28 at 20:57 +0200, Tomas Vondra wrote:
> Attached is a patch adding CP_SMALL_TLIST to create_agg_plan and
> create_groupingsets_plan.

Looks good, except one question:

Why would aggstrategy ever be MIXED when in create_agg_path? Wouldn't
that only happen in create_groupingsets_path?

Regards,
    Jeff Davis
On Thu, May 28, 2020 at 06:14:55PM -0700, Jeff Davis wrote:
>On Thu, 2020-05-28 at 20:57 +0200, Tomas Vondra wrote:
>> Attached is a patch adding CP_SMALL_TLIST to create_agg_plan and
>> create_groupingsets_plan.
>
>Looks good, except one question:
>
>Why would aggstrategy ever be MIXED when in create_agg_path? Wouldn't
>that only happen in create_groupingsets_path?
>

Ah, right. Yeah, we only need to check for AGG_HASH here. Moreover,
AGG_MIXED probably does not need the tlist tweak, because the input
should be pre-sorted as with AGG_SORTED.

And we should probably do similar check in the create_groupinsets_path,
I guess. At first I thought we can't do that before inspecting rollups,
which only happens later in the function, but now I see there's
aggstrategy in GroupingSetsPath too.


regards

--
Tomas Vondra                  http://www.2ndQuadrant.com
PostgreSQL Development, 24x7 Support, Remote DBA, Training & Services
Вложения
On Fri, 2020-05-29 at 15:04 +0200, Tomas Vondra wrote:
> Ah, right. Yeah, we only need to check for AGG_HASH here. Moreover,
> AGG_MIXED probably does not need the tlist tweak, because the input
> should be pre-sorted as with AGG_SORTED.
>
> And we should probably do similar check in the
> create_groupinsets_path,
> I guess. At first I thought we can't do that before inspecting
> rollups,
> which only happens later in the function, but now I see there's
> aggstrategy in GroupingSetsPath too.

Looks good.

    Jeff
Hello

Is this patch the only thing missing before this open item can be
considered closed?

Thanks

--
Álvaro Herrera                https://www.2ndQuadrant.com/
PostgreSQL Development, 24x7 Support, Remote DBA, Training & Services
On Fri, Jun 05, 2020 at 05:19:43PM -0400, Alvaro Herrera wrote:
>Hello
>
>Is this patch the only thing missing before this open item can be
>considered closed?
>

I've already pushed this as 4cad2534da6d17067d98cf04be2dfc1bda8f2cd0,
sorry for not mentioning it in this thread explicitly.


regards

--
Tomas Vondra                  http://www.2ndQuadrant.com
PostgreSQL Development, 24x7 Support, Remote DBA, Training & Services
On 2020-Jun-06, Tomas Vondra wrote:

> On Fri, Jun 05, 2020 at 05:19:43PM -0400, Alvaro Herrera wrote:
>
> > Is this patch the only thing missing before this open item can be
> > considered closed?
>
> I've already pushed this as 4cad2534da6d17067d98cf04be2dfc1bda8f2cd0,
> sorry for not mentioning it in this thread explicitly.

That's great to know, thanks.  The other bit necessary to answer my
question is whether do we need to do anything else in this area -- if
no, then we can mark the open item as closed:
https://wiki.postgresql.org/wiki/PostgreSQL_13_Open_Items#Open_Issues

Thanks

--
Álvaro Herrera                https://www.2ndQuadrant.com/
PostgreSQL Development, 24x7 Support, Remote DBA, Training & Services
On Fri, Jun 05, 2020 at 06:51:34PM -0400, Alvaro Herrera wrote:
>On 2020-Jun-06, Tomas Vondra wrote:
>
>> On Fri, Jun 05, 2020 at 05:19:43PM -0400, Alvaro Herrera wrote:
>>
>> > Is this patch the only thing missing before this open item can be
>> > considered closed?
>>
>> I've already pushed this as 4cad2534da6d17067d98cf04be2dfc1bda8f2cd0,
>> sorry for not mentioning it in this thread explicitly.
>
>That's great to know, thanks.  The other bit necessary to answer my
>question is whether do we need to do anything else in this area -- if
>no, then we can mark the open item as closed:
>https://wiki.postgresql.org/wiki/PostgreSQL_13_Open_Items#Open_Issues
>

Hmmm, good question.

There was some discussion about maybe tweaking the costing model to make
it a bit more pessimistic (assuming more random I/O or something like
that), but I'm not sure it's still needed. Increasing random_page_cost
for the temp tablespace did the trick for me.

So I'd say we can mark it as closed ...


regards

--
Tomas Vondra                  http://www.2ndQuadrant.com
PostgreSQL Development, 24x7 Support, Remote DBA, Training & Services