Обсуждение: [PERFORM] postgresql tuning with perf
Hello Experts,
We are trying to tune our postgresql DB using perf. We are running a C program that connects to postgres DB and calls very simple StoredProcs, one each for SELECT, INSERT & UPDATE.
The SPs are very simple.
SELECT_SP:
CREATE OR REPLACE PROCEDURE query_dept_new(p1 IN numeric, p2 OUT numeric,p3 OUT numeric,.......,p205 OUT numeric) AS
BEGIN
SELECT c2,c3,......,c205
INTO p2,p3,.......,p205
FROM dept_new
WHERE c1 = p1;
END;
UPDATE_SP:
CREATE OR REPLACE PROCEDURE query_dept_update(p1 IN numeric, p2 IN numeric,........,p205 IN numeric) AS
BEGIN
update dept_new set c2 = p2,c3 = p3,.....,c205 = p205
WHERE c1 = p1;
commit;
END;
INSERT_SP:
CREATE OR REPLACE PROCEDURE query_dept_insert(p1 IN numeric, p2 IN numeric,.....,p205 IN numeric) AS
BEGIN
insert into dept_new values(p1,p2,.....,p205);
commit;
END;
As shown above, its all on a single table. Before every test, the table is truncated and loaded with 1m rows. WAL is on a separate disk.
Its about 3x slower as compared to Oracle and major events are WAL related. With fsync=off or sync_commit=off it gets 10% better but still far from Oracle. Vacuuming the table does not help. Checkpoint too is not an issue.
Since we dont see any other way to find out what is slowing it down, we gathered data using the perf tool. Can somebody pls help on how do we go about reading the perf report.
Thanks & Regards
Hi,
could you providence the code used with PG ?
Has table dept_new an index/pk on c1 ?
Do you analyze this table after loading it ?

Regards
PAscal


--
Sent from: http://www.postgresql-archive.org/PostgreSQL-performance-f2050081.html


--
Sent via pgsql-performance mailing list (pgsql-performance@postgresql.org)
To make changes to your subscription:
http://www.postgresql.org/mailpref/pgsql-performance
On 10/23/2017 09:19 PM, Purav Chovatia wrote:
> Hello Experts,
>
> We are trying to tune our postgresql DB using perf.

Can you share some of the perf reports, then?

> We are running a C program that connects to postgres DB and calls
> very simple StoredProcs, one each for SELECT, INSERT & UPDATE.
>
> The SPs are very simple.
> *SELECT_SP*:
> CREATE OR REPLACE PROCEDURE query_dept_new(p1 IN numeric, p2 OUT
> numeric,p3 OUT numeric,.......,p205 OUT numeric) AS
> BEGIN
>     SELECT c2,c3,......,c205
>         INTO p2,p3,.......,p205
>         FROM dept_new
>         WHERE c1 = p1;
> END;
>
> *UPDATE_SP*:
> CREATE OR REPLACE PROCEDURE query_dept_update(p1 IN numeric, p2 IN
> numeric,........,p205 IN numeric) AS
> BEGIN
>     update dept_new set  c2 = p2,c3 = p3,.....,c205 = p205
>         WHERE c1 = p1;
> commit;
> END;
>
> *INSERT_SP*:
> CREATE OR REPLACE PROCEDURE query_dept_insert(p1 IN numeric, p2 IN
> numeric,.....,p205 IN numeric) AS
> BEGIN
> insert into dept_new values(p1,p2,.....,p205);
> commit;
> END;
>
> As shown above, its all on a single table. Before every test, the table
> is truncated and loaded with 1m rows. WAL is on a separate disk.
>

It'd be nice if you could share more details about the structure of the
table, hardware and observed metrics (throughput, ...). Otherwise we
can't try reproducing it, for example.

> Its about 3x slower as compared to Oracle and major events are WAL
> related. With fsync=off or sync_commit=off it gets 10% better but still
> far from Oracle. Vacuuming the table does not help. Checkpoint too is
> not an issue.

So how do you know the major events are WAL related? Can you share how
you measure that and the measurements?

>
> Since we dont see any other way to find out what is slowing it down, we
> gathered data using the perf tool. Can somebody pls help on how do we go
> about reading the perf report.

Well, that's hard to do when you haven't shared the report.

regards

--
Tomas Vondra                  http://www.2ndQuadrant.com
PostgreSQL Development, 24x7 Support, Remote DBA, Training & Services


--
Sent via pgsql-performance mailing list (pgsql-performance@postgresql.org)
To make changes to your subscription:
http://www.postgresql.org/mailpref/pgsql-performance
> On Oct 23, 2017, at 12:19 PM, Purav Chovatia <puravc@gmail.com> wrote:
>
> Hello Experts,
>
> We are trying to tune our postgresql DB using perf. We are running a C program that connects to postgres DB and calls
verysimple StoredProcs, one each for SELECT, INSERT & UPDATE.
>
> The SPs are very simple.
> SELECT_SP:
> CREATE OR REPLACE PROCEDURE query_dept_new(p1 IN numeric, p2 OUT numeric,p3 OUT numeric,.......,p205 OUT numeric) AS
> BEGIN
>     SELECT c2,c3,......,c205
>         INTO p2,p3,.......,p205
>         FROM dept_new
>         WHERE c1 = p1;
> END;

Perhaps I'm confused, but I didn't think PostgreSQL had stored procedures. If the code you're actually running looks
likethis then I don't think you're using PostgreSQL.

Cheers, Steve

--
Sent via pgsql-performance mailing list (pgsql-performance@postgresql.org)
To make changes to your subscription:
http://www.postgresql.org/mailpref/pgsql-performance
The language used for stored procedures is EDBSPL. Even if we dont use EDBSPL, and instead use PLPgPSQL, the performance is still the same.
Thanks
On 24 October 2017 at 03:29, Steve Atkins <steve@blighty.com> wrote:
> On Oct 23, 2017, at 12:19 PM, Purav Chovatia <puravc@gmail.com> wrote:
>
> Hello Experts,
>
> We are trying to tune our postgresql DB using perf. We are running a C program that connects to postgres DB and calls very simple StoredProcs, one each for SELECT, INSERT & UPDATE.
>
> The SPs are very simple.
> SELECT_SP:
> CREATE OR REPLACE PROCEDURE query_dept_new(p1 IN numeric, p2 OUT numeric,p3 OUT numeric,.......,p205 OUT numeric) AS
> BEGIN
> SELECT c2,c3,......,c205
> INTO p2,p3,.......,p205
> FROM dept_new
> WHERE c1 = p1;
> END;
Perhaps I'm confused, but I didn't think PostgreSQL had stored procedures. If the code you're actually running looks like this then I don't think you're using PostgreSQL.
Cheers,
Steve
--
Sent via pgsql-performance mailing list (pgsql-performance@postgresql.org)
To make changes to your subscription:
http://www.postgresql.org/mailpref/pgsql-performance
Thanks Tomas.
And thanks again that you plan to reproduce it.
Would appreciate if somebody can help understand as to how does one go about troubleshooting performance in the postgresql world. In Oracle, I would look at statspack and the wait events and most likely we would get the root cause.
Table has PK on col c1 and the predicate of the SELECT & UPDATE includes c1.
Server is HP DL 380 dual cpu, each cpu with 6 cores with 36GB RAM. Table size including index is 1.7GB. Shared_buffers=8GB, so the table is fully cached. Effective_cache_size=26GB. CPU util is 5-6% while running the workload. EDB is processing ~1800 requests/sec whereas Oracle is processing ~3300 req/sec.
bmdb=# desc dept_new
Table "public.dept_new"
Column | Type | Modifiers
--------+---------------+-----
c1 | numeric(10,0) | not null
c2 | numeric(10,0) |
.
.
.
.
.
c205 | numeric(10,0) |
Indexes:
"dept_new_pkey" PRIMARY KEY, btree (c1)
bmdb=#
We queried pg_stat_activity thrice every sec like this:
bmdb# \o wait_events.lst
bmdb# SELECT wait_event_type, wait_event FROM pg_stat_activity WHERE pid != pg_backend_pid() and wait_event is not null;
bmdb# \watch 0.3
We see WALWriteLock events (and that too very few). However, with either fsync=off or sync_commit=off the time gain is only about 10-15%. So eliminating those waits does not give the expected benefit. Since we dont see any other waits, we believe its actually burning the cpu but we cant figure out why.
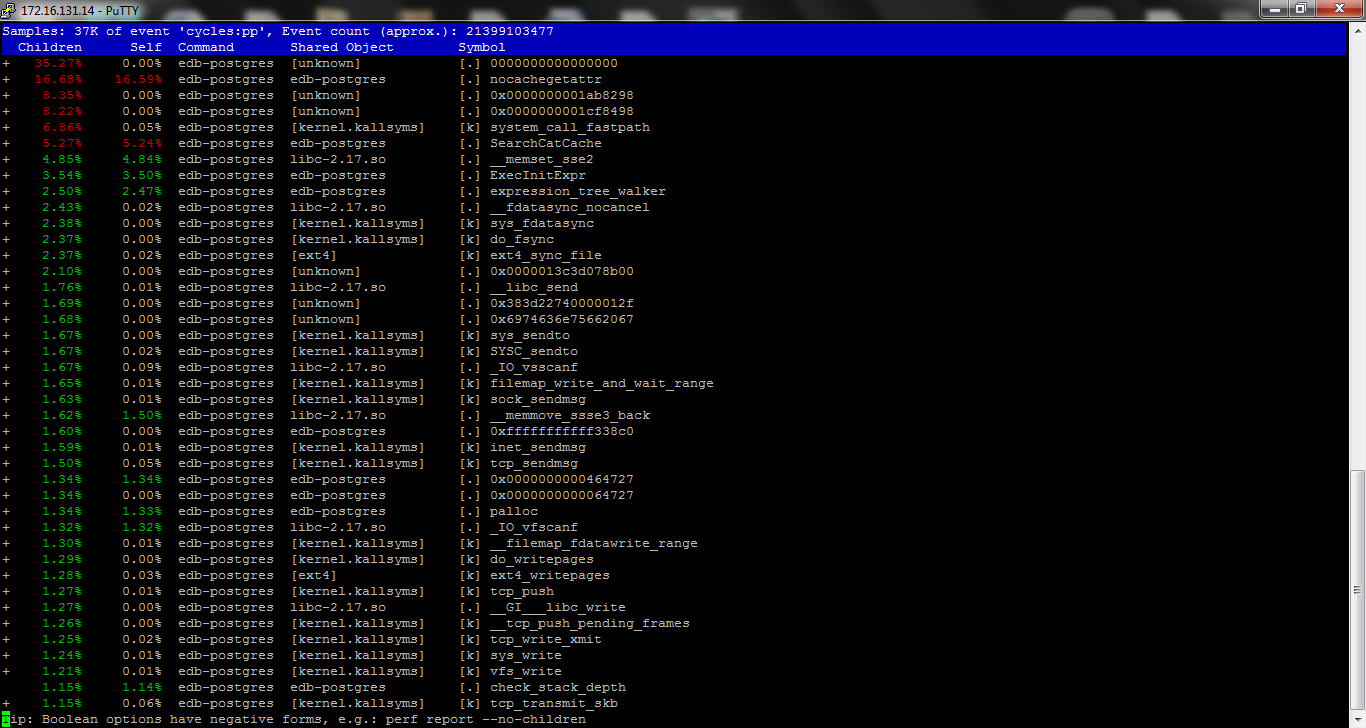
Attached herewith is the output of perf report -g -i perf.data redirected to perf_rep.lst. I am not too sure if this is how perf reports are shared, so pls let me know if the correct method. Also, given below is a snapshot of perf report.
Thanks & Regards
On 24 October 2017 at 02:25, Tomas Vondra <tomas.vondra@2ndquadrant.com> wrote:
On 10/23/2017 09:19 PM, Purav Chovatia wrote:
> Hello Experts,
>
> We are trying to tune our postgresql DB using perf.
Can you share some of the perf reports, then?
> We are running a C program that connects to postgres DB and calls
> very simple StoredProcs, one each for SELECT, INSERT & UPDATE.
>
> The SPs are very simple.
> *SELECT_SP*:
> CREATE OR REPLACE PROCEDURE query_dept_new(p1 IN numeric, p2 OUT
> numeric,p3 OUT numeric,.......,p205 OUT numeric) AS
> BEGIN
> SELECT c2,c3,......,c205
> INTO p2,p3,.......,p205
> FROM dept_new
> WHERE c1 = p1;
> END;
>
> *UPDATE_SP*:
> CREATE OR REPLACE PROCEDURE query_dept_update(p1 IN numeric, p2 IN
> numeric,........,p205 IN numeric) AS
> BEGIN
> update dept_new set c2 = p2,c3 = p3,.....,c205 = p205
> WHERE c1 = p1;
> commit;
> END;
>
> *INSERT_SP*:
> CREATE OR REPLACE PROCEDURE query_dept_insert(p1 IN numeric, p2 IN
> numeric,.....,p205 IN numeric) AS
> BEGIN
> insert into dept_new values(p1,p2,.....,p205);
> commit;
> END;
>
> As shown above, its all on a single table. Before every test, the table
> is truncated and loaded with 1m rows. WAL is on a separate disk.
>
It'd be nice if you could share more details about the structure of the
table, hardware and observed metrics (throughput, ...). Otherwise we
can't try reproducing it, for example.
> Its about 3x slower as compared to Oracle and major events are WAL
> related. With fsync=off or sync_commit=off it gets 10% better but still
> far from Oracle. Vacuuming the table does not help. Checkpoint too is
> not an issue.
So how do you know the major events are WAL related? Can you share how
you measure that and the measurements?
>
> Since we dont see any other way to find out what is slowing it down, we
> gathered data using the perf tool. Can somebody pls help on how do we go
> about reading the perf report.
Well, that's hard to do when you haven't shared the report.
regards
--
Tomas Vondra http://www.2ndQuadrant.com
PostgreSQL Development, 24x7 Support, Remote DBA, Training & Services
Вложения
Hi Pascal,
Do you mean the sample program that acts as the application, do you want me to share that? I can do that, but I guess my post will get blocked.
Yes, c1 is the PK. Pls see below:
bmdb=# desc dept_new
Table "public.dept_new"
Column | Type | Modifiers
--------+---------------+-----
c1 | numeric(10,0) | not null
c2 | numeric(10,0) |
.
.
.
.
.
c205 | numeric(10,0) |
Indexes:
"dept_new_pkey" PRIMARY KEY, btree (c1)
bmdb=#
We dont analyze after loading the table. But I guess thats required only if the query plan is in doubt, lets say its doing a full table scan or alike, isnt it? That is not the case. The query is using PK index but it just seems to be slow.
Thanks
On 24 October 2017 at 01:59, legrand legrand <legrand_legrand@hotmail.com> wrote:
Hi,
could you providence the code used with PG ?
Has table dept_new an index/pk on c1 ?
Do you analyze this table after loading it ?
Regards
PAscal
--
Sent from: http://www.postgresql-archive.org/PostgreSQL-performance- f2050081.html
--
Sent via pgsql-performance mailing list (pgsql-performance@postgresql.org)
To make changes to your subscription:
http://www.postgresql.org/mailpref/pgsql-performance
Please share how you monitor your perfs.

At less duration for each plpgsql proc / oracle proc.
Please share your plpgsql code, and commit strategy.

(for support with edb please check with your contract manager)


--
Sent from: http://www.postgresql-archive.org/PostgreSQL-performance-f2050081.html


--
Sent via pgsql-performance mailing list (pgsql-performance@postgresql.org)
To make changes to your subscription:
http://www.postgresql.org/mailpref/pgsql-performance
We record like this: perf record -g -u enterprisedb
We report like this: perf report -g -i perf.data
Is this what you were looking for? Sorry, we are new to perf so we might be sharing something different as compared to what you asked.
We already shared the SP code in the original post.
Thanks
On 24 October 2017 at 20:21, legrand legrand <legrand_legrand@hotmail.com> wrote:
Please share how you monitor your perfs.
At less duration for each plpgsql proc / oracle proc.
Please share your plpgsql code, and commit strategy.
(for support with edb please check with your contract manager)
--
Sent from: http://www.postgresql-archive.org/PostgreSQL-performance- f2050081.html
--
Sent via pgsql-performance mailing list (pgsql-performance@postgresql.org)
To make changes to your subscription:
http://www.postgresql.org/mailpref/pgsql-performance
Thanks Tomas.

And thanks again that you plan to reproduce it.
Would appreciate if somebody can help understand as to how does one go about troubleshooting performance in the postgresql world. In Oracle, I would look at statspack and the wait events and most likely we would get the root cause.
Table has PK on col c1 and the predicate of the SELECT & UPDATE includes c1.
Server is HP DL 380 dual cpu, each cpu with 6 cores with 36GB RAM. Table size including index is 1.7GB. Shared_buffers=8GB, so the table is fully cached. Effective_cache_size=26GB. CPU util is 5-6% while running the workload. EDB is processing ~1800 requests/sec whereas Oracle is processing ~3300 req/sec.
bmdb=# desc dept_new
Table "public.dept_new"
Column | Type | Modifiers
--------+---------------+-----
c1 | numeric(10,0) | not null
c2 | numeric(10,0) |
.
.
.
.
.
c205 | numeric(10,0) |
Indexes:
"dept_new_pkey" PRIMARY KEY, btree (c1)
bmdb=#
We queried pg_stat_activity thrice every sec like this:
bmdb# \o wait_events.lst
bmdb# SELECT wait_event_type, wait_event FROM pg_stat_activity WHERE pid != pg_backend_pid() and wait_event is not null;
bmdb# \watch 0.3
We see WALWriteLock events (and that too very few). However, with either fsync=off or sync_commit=off the time gain is only about 10-15%. So eliminating those waits does not give the expected benefit. Since we dont see any other waits, we believe its actually burning the cpu but we cant figure out why.
Attached herewith is the output of perf report -g -i perf.data redirected to perf_rep.lst. I am not too sure if this is how perf reports are shared, so pls let me know if the correct method. Also, given below is a snapshot of perf report.
Thanks & Regards
On 24 October 2017 at 02:25, Tomas Vondra <tomas.vondra@2ndquadrant.com> wrote:
On 10/23/2017 09:19 PM, Purav Chovatia wrote:
> Hello Experts,
>
> We are trying to tune our postgresql DB using perf.
Can you share some of the perf reports, then?
> We are running a C program that connects to postgres DB and calls
> very simple StoredProcs, one each for SELECT, INSERT & UPDATE.
>
> The SPs are very simple.
> *SELECT_SP*:
> CREATE OR REPLACE PROCEDURE query_dept_new(p1 IN numeric, p2 OUT
> numeric,p3 OUT numeric,.......,p205 OUT numeric) AS
> BEGIN
> SELECT c2,c3,......,c205
> INTO p2,p3,.......,p205
> FROM dept_new
> WHERE c1 = p1;
> END;
>
> *UPDATE_SP*:
> CREATE OR REPLACE PROCEDURE query_dept_update(p1 IN numeric, p2 IN
> numeric,........,p205 IN numeric) AS
> BEGIN
> update dept_new set c2 = p2,c3 = p3,.....,c205 = p205
> WHERE c1 = p1;
> commit;
> END;
>
> *INSERT_SP*:
> CREATE OR REPLACE PROCEDURE query_dept_insert(p1 IN numeric, p2 IN
> numeric,.....,p205 IN numeric) AS
> BEGIN
> insert into dept_new values(p1,p2,.....,p205);
> commit;
> END;
>
> As shown above, its all on a single table. Before every test, the table
> is truncated and loaded with 1m rows. WAL is on a separate disk.
>
It'd be nice if you could share more details about the structure of the
table, hardware and observed metrics (throughput, ...). Otherwise we
can't try reproducing it, for example.
> Its about 3x slower as compared to Oracle and major events are WAL
> related. With fsync=off or sync_commit=off it gets 10% better but still
> far from Oracle. Vacuuming the table does not help. Checkpoint too is
> not an issue.
So how do you know the major events are WAL related? Can you share how
you measure that and the measurements?
>
> Since we dont see any other way to find out what is slowing it down, we
> gathered data using the perf tool. Can somebody pls help on how do we go
> about reading the perf report.
Well, that's hard to do when you haven't shared the report.
regards
--
Tomas Vondra http://www.2ndQuadrant.com
PostgreSQL Development, 24x7 Support, Remote DBA, Training & Services
Once again you are speaking about edb port of postgresql. The edb pl sql code
is not public. This is not the good place to get support: please ask your
edb contract manager.
If you want support hère: please rewrite your oracle proc in pl pqsql, share
that code and commit strategy ... Postgres doesn't support commit in pl ...
This is a big difference


--
Sent from: http://www.postgresql-archive.org/PostgreSQL-performance-f2050081.html


--
Sent via pgsql-performance mailing list (pgsql-performance@postgresql.org)
To make changes to your subscription:
http://www.postgresql.org/mailpref/pgsql-performance