Обсуждение: Increased I/O / Writes
Вложения
From: pgsql-general-owner@postgresql.org [mailto:pgsql-general-owner@postgresql.org] On Behalf Of drum.lucas@gmail.com
Sent: Sunday, May 08, 2016 10:07 PM
To: Postgres General <pgsql-general@postgresql.org>
Subject: [GENERAL] Increased I/O / Writes
Hi all,
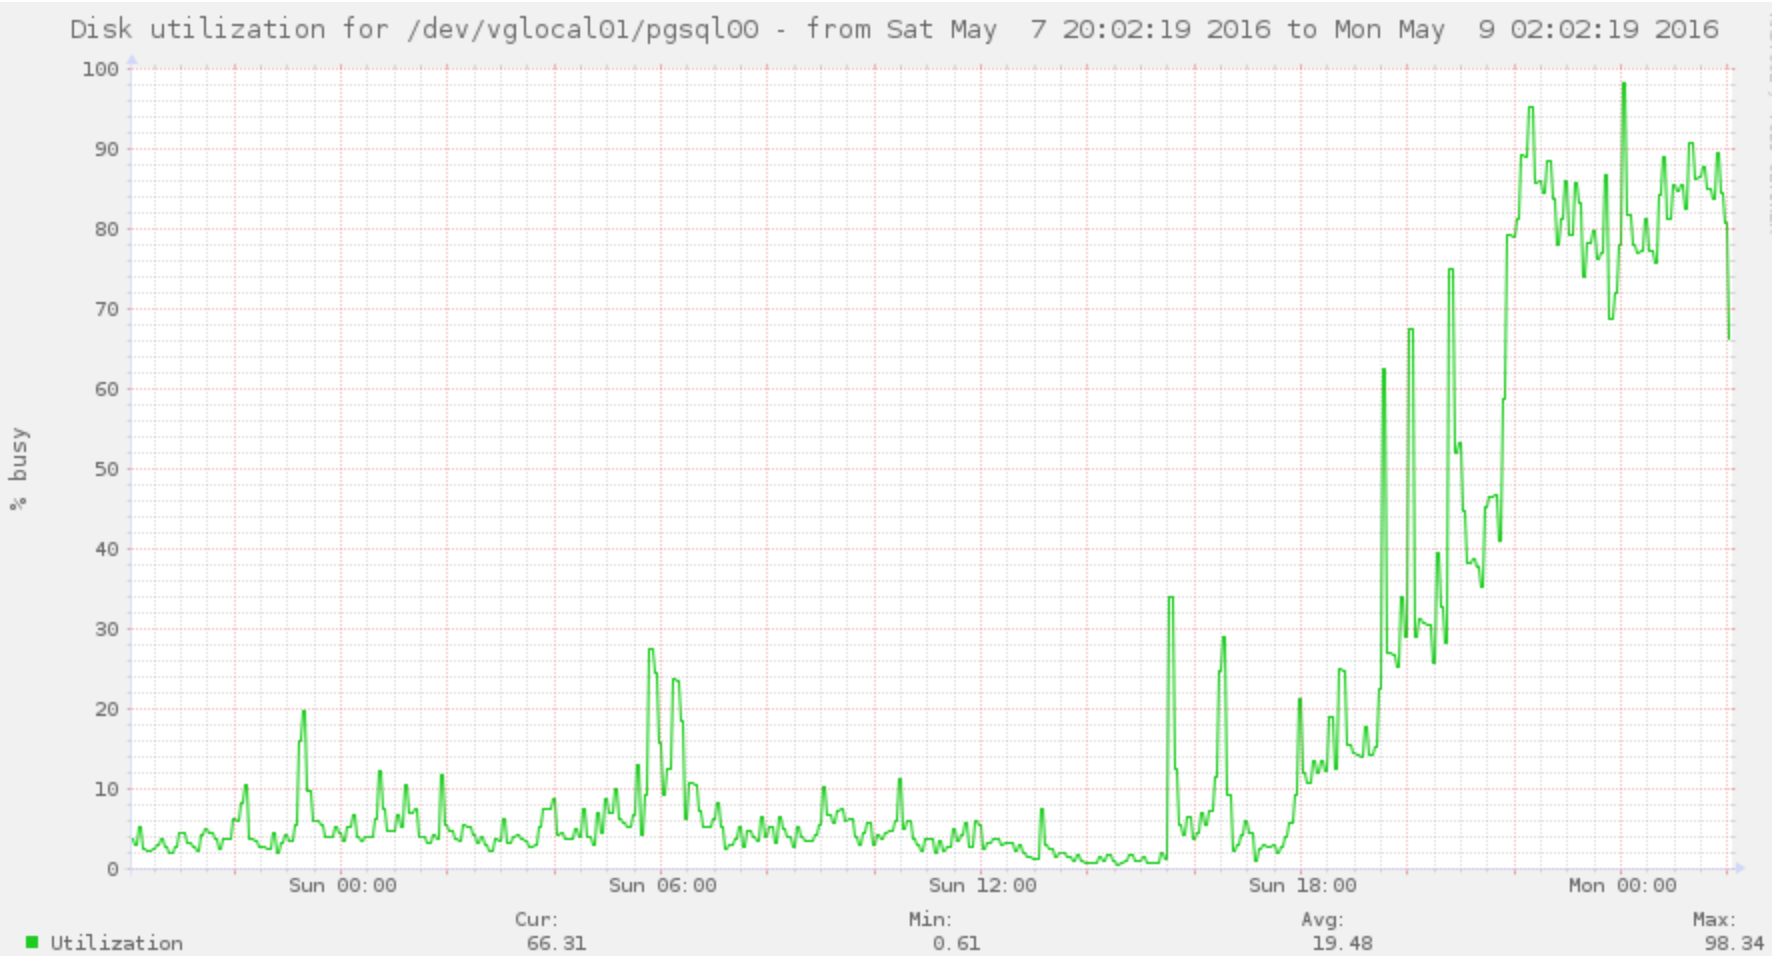
I've recently an increase IO for writes on my DB. I'm currently using PostgreSQL 9.2.
I know that much improvements can be done (as I'm using SATA disks), but my question is:
Is there a way to detect the queries that are causing that?
I can use pg_stat_statements to get the most usage queries, but I was wondering how can I find the queries that are causing that much IO?
Please, if anyone can share anything.. Thanks a lot!
Lucas
So, what’s wrong with using pg_stat_statements?
It has a set of columns pertaining to IO.
Regards,
Igor Neyman
Вложения
On 05/10/2016 09:50 AM, Igor Neyman wrote:

> Please, if anyone can share anything.. Thanks a lot!
>
> Lucas
>
> So, what’s wrong with using pg_stat_statements?
>
> It has a set of columns pertaining to IO.
>

You could use iotop to determine which postgres pid is eating the IO,
then use statement logging with PID (or pg_stat_activity/statement) to
see what the system is actually doing.

JD


> Regards,
>
> Igor Neyman
>


--
Command Prompt, Inc.                  http://the.postgres.company/
                         +1-503-667-4564
PostgreSQL Centered full stack support, consulting and development.
Everyone appreciates your honesty, until you are honest with them.
On 05/10/2016 09:50 AM, Igor Neyman wrote:Please, if anyone can share anything.. Thanks a lot!
Lucas
So, what’s wrong with using pg_stat_statements?
It has a set of columns pertaining to IO.
You could use iotop to determine which postgres pid is eating the IO, then use statement logging with PID (or pg_stat_activity/statement) to see what the system is actually doing.
JDRegards,
Igor Neyman
--
Command Prompt, Inc. http://the.postgres.company/
+1-503-667-4564
PostgreSQL Centered full stack support, consulting and development.
Everyone appreciates your honesty, until you are honest with them.
--
Sent via pgsql-general mailing list (pgsql-general@postgresql.org)
To make changes to your subscription:
http://www.postgresql.org/mailpref/pgsql-general
I highly recommend you look into using PgBadger. It gives you a great deal of info about your queries, including I/O, above and beyond pg_stats.
PgBadger info PgBadger download
--
I reserve the right to fantasize. Whether or not you
wish to share my fantasy is entirely up to you.

I had a similar problem few days ago.
Point is, I've (by mistaken), deleted a index, and this increased the table scan, increasing overall I/O.
Atenciosamente,

Edson Carlos Ericksson Richter
Hi all,I've recently an increase IO for writes on my DB. I'm currently using PostgreSQL 9.2.I know that much improvements can be done (as I'm using SATA disks), but my question is:Is there a way to detect the queries that are causing that?I can use pg_stat_statements to get the most usage queries, but I was wondering how can I find the queries that are causing that much IO?Please, if anyone can share anything.. Thanks a lot!Lucas

Вложения
On Sun, May 8, 2016 at 7:07 PM, drum.lucas@gmail.com
<drum.lucas@gmail.com> wrote:
> Is there a way to detect the queries that are causing that?
>
> I can use pg_stat_statements to get the most usage queries, but I was wondering how can I find the queries that are
causingthat much IO?

Take a look at this tool:

https://github.com/grayhemp/pgcookbook/blob/master/statement_statistics_collecting_and_reporting.md

--
Kind regards,
Sergey Konoplev
PostgreSQL Consultant and DBA

http://www.linkedin.com/in/grayhemp
https://github.com/grayhemp
+1 (415) 867-9984, +7 (499) 346-7196, +7 (988) 888-1979
gray.ru@gmail.com
Hi
Why not use https://www.keithf4.com/a-large-database-does-not-mean-large-shared_buffers/ to determine your optimal shared_buffers settings? ;-)
Cheers
Johnny
From: pgsql-general-owner@postgresql.org [mailto:pgsql-general-owner@postgresql.org] On Behalf Of Lucas Possamai
Sent: Dienstag, 17. Mai 2016 06:12
To: Sergey Konoplev
Cc: Postgres General
Subject: Re: [GENERAL] Increased I/O / Writes
This is my postgresql.conf at the moment:
shared_buffer(51605MB) +
effective_cache_size(96760MB) +
work_mem(32MB) +
max_connections(200)
= 148397.08 MB
My server has 128GB of RAM
So, I'm using more RAM that I have. (not good at all)
I'm glad that it wasn't me who put those confs in there :)
Anyway...
I was thinking about decrease the shared_buffer to something like 1/8 of total RAM = 16GB
What do u guys think about it?
Cheers
Lucas
On Tue, May 17, 2016 at 12:11 AM, Lucas Possamai <drum.lucas@gmail.com> wrote:
> This is my postgresql.conf at the moment:
>
> shared_buffer(51605MB) +
> effective_cache_size(96760MB) +
> work_mem(32MB) +
> max_connections(200)
>
> = 148397.08 MB

You are comparing some very dissimilar settings.  effective_cache_size
does not allocate memory, it tells the planner how much cache you have
allocated (i.e., the sum of shared_buffers and the OS cache).
work_mem can be allocated zero to a large number of times per active
query.  Every open connection will use some RAM, but the amount is
hard to predict exactly.

You might want to go over this page:

https://wiki.postgresql.org/wiki/Tuning_Your_PostgreSQL_Server

... and then read the documentation of any setting you are thinking of
adjusting.

--
Kevin Grittner
EDB: http://www.enterprisedb.com
The Enterprise PostgreSQL Company
FATAL: sorry, too many clients already
FATAL: sorry, too many clients already
I believe that error means you've exceeded max_connections. query pg_stat_activity and see how many connections are in the various 'states', like..
select state, count(*) from pg_stat_activity group by state;
--
john r pierce, recycling bits in santa cruz
On Mon, May 23, 2016 at 4:32 PM, Lucas Possamai <drum.lucas@gmail.com> wrote:

> The spikes were happening because, after the reboot, the HUGE PAGES were
> enabled.
>
> After disabling them, all got back to normal.

Since you said earlier you were on PostgreSQL version 9.2, you must
be talking about transparent huge pages.  Yeah, be sure those are
configured to be disabled in a way that "sticks" on your OS.  When
you get to version 9.4 you will notice that we support huge pages
directly.  That would be expected to work without problems even
though TRANSPARENT huge pages are debilitating.

--
Kevin Grittner
EDB: http://www.enterprisedb.com
The Enterprise PostgreSQL Company
On Mon, May 23, 2016 at 4:32 PM, Lucas Possamai <drum.lucas@gmail.com> wrote:
> The spikes were happening because, after the reboot, the HUGE PAGES were
> enabled.
>
> After disabling them, all got back to normal.
Since you said earlier you were on PostgreSQL version 9.2, you must
be talking about transparent huge pages. Yeah, be sure those are
configured to be disabled in a way that "sticks" on your OS. When
you get to version 9.4 you will notice that we support huge pages
directly. That would be expected to work without problems even
though TRANSPARENT huge pages are debilitating.