Обсуждение: Need some help on Performance 9.0.4
We have been running 4 of our applications on 9.0.4, which we are planning to update the database 9.2.2 by the year end. we have the streaming replication also running
We are running 32 bit 9.0.4 on solaris System Configuration: Sun Microsystems sun4u
Memory size: 65536 Megabytes
System Peripherals (Software Nodes):
SUNW,SPARC-Enterprise.
# -----------------------------
# PostgreSQL configuration file
# -----------------------------
#
# This file consists of lines of the form:
#
# name = value
#
# (The "=" is optional.) Whitespace may be used. Comments are introduced with
# "#" anywhere on a line. The complete list of parameter names and allowed
# values can be found in the PostgreSQL documentation.
#
# The commented-out settings shown in this file represent the default values.
# Re-commenting a setting is NOT sufficient to revert it to the default value;
# you need to reload the server.
#
# This file is read on server startup and when the server receives a SIGHUP
# signal. If you edit the file on a running system, you have to SIGHUP the
# server for the changes to take effect, or use "pg_ctl reload". Some
# parameters, which are marked below, require a server shutdown and restart to
# take effect.
#
# Any parameter can also be given as a command-line option to the server, e.g.,
# "postgres -c log_connections=on". Some parameters can be changed at run time
# with the "SET" SQL command.
#
# Memory units: kB = kilobytes Time units: ms = milliseconds
# MB = megabytes s = seconds
# GB = gigabytes min = minutes
# h = hours
# d = days
#------------------------------------------------------------------------------
# FILE LOCATIONS
#------------------------------------------------------------------------------
# The default values of these variables are driven from the -D command-line
# option or PGDATA environment variable, represented here as ConfigDir.
#data_directory = 'ConfigDir' # use data in another directory
# (change requires restart)
#hba_file = 'ConfigDir/pg_hba.conf' # host-based authentication file
# (change requires restart)
#ident_file = 'ConfigDir/pg_ident.conf' # ident configuration file
# (change requires restart)
# If external_pid_file is not explicitly set, no extra PID file is written.
#external_pid_file = '(none)' # write an extra PID file
# (change requires restart)
#------------------------------------------------------------------------------
# CONNECTIONS AND AUTHENTICATION
#------------------------------------------------------------------------------
# - Connection Settings -
listen_addresses = '*' # what IP address(es) to listen on;
# comma-separated list of addresses;
# defaults to 'localhost', '*' = all
# (change requires restart)
port = 5432 # (change requires restart)
max_connections = 300 # (change requires restart)
# Note: Increasing max_connections costs ~400 bytes of shared memory per
# connection slot, plus lock space (see max_locks_per_transaction).
#superuser_reserved_connections = 3 # (change requires restart)
#unix_socket_directory = '' # (change requires restart)
#unix_socket_group = '' # (change requires restart)
#unix_socket_permissions = 0777 # begin with 0 to use octal notation
# (change requires restart)
#bonjour = off # advertise server via Bonjour
# (change requires restart)
#bonjour_name = '' # defaults to the computer name
# (change requires restart)
# - Security and Authentication -
#authentication_timeout = 1min # 1s-600s
#ssl = off # (change requires restart)
#ssl_ciphers = 'ALL:!ADH:!LOW:!EXP:!MD5:@STRENGTH' # allowed SSL ciphers
# (change requires restart)
#ssl_renegotiation_limit = 512MB # amount of data between renegotiations
#password_encryption = on
#db_user_namespace = off
# Kerberos and GSSAPI
#krb_server_keyfile = ''
#krb_srvname = 'postgres' # (Kerberos only)
#krb_caseins_users = off
# - TCP Keepalives -
# see "man 7 tcp" for details
#tcp_keepalives_idle = 0 # TCP_KEEPIDLE, in seconds;
# 0 selects the system default
#tcp_keepalives_interval = 0 # TCP_KEEPINTVL, in seconds;
# 0 selects the system default
#tcp_keepalives_count = 0 # TCP_KEEPCNT;
# 0 selects the system default
#------------------------------------------------------------------------------
# RESOURCE USAGE (except WAL)
#------------------------------------------------------------------------------
# - Memory -
shared_buffers = 3GB # min 128kB
# (change requires restart)
temp_buffers = 250MB # min 800kB
#max_prepared_transactions = 0 # zero disables the feature
# (change requires restart)
# Note: Increasing max_prepared_transactions costs ~600 bytes of shared memory
# per transaction slot, plus lock space (see max_locks_per_transaction).
# It is not advisable to set max_prepared_transactions nonzero unless you
# actively intend to use prepared transactions.
work_mem = 60MB # min 64kB
maintenance_work_mem = 1GB # min 1MB
#maintenance_work_mem = 250MB # min 1MB
#max_stack_depth = 2MB # min 100kB
# - Kernel Resource Usage -
#max_files_per_process = 1000 # min 25
# (change requires restart)
#shared_preload_libraries = '' # (change requires restart)
# - Cost-Based Vacuum Delay -
vacuum_cost_delay = 20ms # 0-100 milliseconds
#vacuum_cost_page_hit = 1 # 0-10000 credits
#vacuum_cost_page_miss = 10 # 0-10000 credits
#vacuum_cost_page_dirty = 20 # 0-10000 credits
vacuum_cost_limit = 200 # 1-10000 credits
# - Background Writer -
#bgwriter_delay = 100ms # 10-10000ms between rounds
#bgwriter_lru_maxpages = 100 # 0-1000 max buffers written/round
#bgwriter_lru_multiplier = 2.0 # 0-10.0 multipler on buffers scanned/round
# - Asynchronous Behavior -
#effective_io_concurrency = 1 # 1-1000. 0 disables prefetching
#------------------------------------------------------------------------------
# WRITE AHEAD LOG
#------------------------------------------------------------------------------
# - Settings -
wal_level = hot_standby # minimal, archive, or hot_standby
# (change requires restart)
#fsync = on # turns forced synchronization on or off
#synchronous_commit = on # immediate fsync at commit
#wal_sync_method = fsync # the default is the first option
# supported by the operating system:
# open_datasync
# fdatasync (default on Linux)
# fsync
# fsync_writethrough
# open_sync
#full_page_writes = on # recover from partial page writes
wal_buffers = 16MB # min 32kB
# (change requires restart)
#wal_writer_delay = 100ms # 1-10000 milliseconds
#commit_delay = 0 # range 0-100000, in microseconds
#commit_siblings = 5 # range 1-1000
# - Checkpoints -
checkpoint_segments = 120 # in logfile segments, min 1, 16MB each
checkpoint_timeout = 1800s # range 30s-1h
#checkpoint_completion_target = 0.5 # checkpoint target duration, 0.0 - 1.0
#checkpoint_warning = 30s # 0 disables
# - Archiving -
archive_mode = on # allows archiving to be done
# (change requires restart)
archive_command = 'cp -i %p /fbackup/9.0.4/archive/%f < /dev/null' # command to use to archive a logfile segment
#archive_timeout = 0 # force a logfile segment switch after this
# number of seconds; 0 disables
# - Streaming Replication -
max_wal_senders = 5 # max number of walsender processes
# (change requires restart)
#wal_sender_delay = 200ms # walsender cycle time, 1-10000 milliseconds
wal_keep_segments = 5 # in logfile segments, 16MB each; 0 disables
#vacuum_defer_cleanup_age = 0 # number of xacts by which cleanup is delayed
# - Standby Servers -
hot_standby = on # "on" allows queries during recovery
# (change requires restart)
#max_standby_archive_delay = 30s # max delay before canceling queries
# when reading WAL from archive;
# -1 allows indefinite delay
#max_standby_streaming_delay = 30s # max delay before canceling queries
# when reading streaming WAL;
# -1 allows indefinite delay
#------------------------------------------------------------------------------
# QUERY TUNING
#------------------------------------------------------------------------------
# - Planner Method Configuration -
#enable_bitmapscan = on
#enable_hashagg = on
#enable_hashjoin = on
#enable_indexscan = on
#enable_material = on
#enable_mergejoin = on
#enable_nestloop = on
#enable_seqscan = on
#enable_sort = on
#enable_tidscan = on
# - Planner Cost Constants -
seq_page_cost = 1.0 # measured on an arbitrary scale
random_page_cost = 1.0 # same scale as above
#cpu_tuple_cost = 0.01 # same scale as above
#cpu_index_tuple_cost = 0.005 # same scale as above
#cpu_operator_cost = 0.0025 # same scale as above
effective_cache_size = 28GB
# - Genetic Query Optimizer -
#geqo = on
#geqo_threshold = 12
#geqo_effort = 5 # range 1-10
#geqo_pool_size = 0 # selects default based on effort
#geqo_generations = 0 # selects default based on effort
#geqo_selection_bias = 2.0 # range 1.5-2.0
#geqo_seed = 0.0 # range 0.0-1.0
# - Other Planner Options -
default_statistics_target = 1000 # range 1-10000
#constraint_exclusion = partition # on, off, or partition
#cursor_tuple_fraction = 0.1 # range 0.0-1.0
#from_collapse_limit = 8
#join_collapse_limit = 8 # 1 disables collapsing of explicit
# JOIN clauses
#------------------------------------------------------------------------------
# ERROR REPORTING AND LOGGING
#------------------------------------------------------------------------------
# - Where to Log -
log_destination = 'stderr' # Valid values are combinations of
# stderr, csvlog, syslog, and eventlog,
# depending on platform. csvlog
# requires logging_collector to be on.
# This is used when logging to stderr:
logging_collector = on # Enable capturing of stderr and csvlog
# into log files. Required to be on for
# csvlogs.
# (change requires restart)
# These are only used if logging_collector is on:
log_directory = '/fdata/9.0.4/logs' # directory where log files are written,
# can be absolute or relative to PGDATA
#log_filename = 'postgresql-%Y-%m-%d_%H%M%S.log' # log file name pattern,
log_filename = 'server_log.%a' # log file name pattern,
# can include strftime() escapes
log_truncate_on_rotation = on # If on, an existing log file of the
# same name as the new log file will be
# truncated rather than appended to.
# But such truncation only occurs on
# time-driven rotation, not on restarts
# or size-driven rotation. Default is
# off, meaning append to existing files
# in all cases.
log_rotation_age = 1440 # Automatic rotation of logfiles will
# happen after that time. 0 disables.
log_rotation_size = 100MB # Automatic rotation of logfiles will
# happen after that much log output.
# 0 disables.
# These are relevant when logging to syslog:
#syslog_facility = 'LOCAL0'
#syslog_ident = 'postgres'
#silent_mode = off # Run server silently.
# DO NOT USE without syslog or
# logging_collector
# (change requires restart)
# - When to Log -
client_min_messages = error # values in order of decreasing detail:
# debug5
# debug4
# debug3
# debug2
# debug1
# log
# notice
# warning
# error
log_min_messages = log # values in order of decreasing detail:
# debug5
# debug4
# debug3
# debug2
# debug1
# info
# notice
# warning
# error
# log
# fatal
# panic
log_min_error_statement = error # values in order of decreasing detail:
# debug5
# debug4
# debug3
# debug2
# debug1
# info
# notice
# warning
# error
# log
# fatal
# panic (effectively off)
log_min_duration_statement = 4000 # -1 is disabled, 0 logs all statements
# and their durations, > 0 logs only
# statements running at least this number
# of milliseconds
# - What to Log -
#debug_print_parse = off
#debug_print_rewritten = off
#debug_print_plan = off
#debug_pretty_print = on
#log_checkpoints = on
log_connections = on
#log_disconnections = on
log_duration = on
#log_error_verbosity = terse # terse, default, or verbose messages
log_hostname = on
#log_line_prefix = '%a %r %e %i %t %d' # special values:
log_line_prefix = '%t [%p]: [%l-1] user=%u,db=%d'
# %a = application name
# %u = user name
# %d = database name
# %r = remote host and port
# %h = remote host
# %p = process ID
# %t = timestamp without milliseconds
# %m = timestamp with milliseconds
# %i = command tag
# %e = SQL state
# %c = session ID
# %l = session line number
# %s = session start timestamp
# %v = virtual transaction ID
# %x = transaction ID (0 if none)
# %q = stop here in non-session
# processes
# %% = '%'
# e.g. '<%u%%%d> '
#log_lock_waits = off # log lock waits >= deadlock_timeout
log_statement = 'all' # none, ddl, mod, all
#log_temp_files = -1 # log temporary files equal or larger
# than the specified size in kilobytes;
# -1 disables, 0 logs all temp files
#log_timezone = unknown # actually, defaults to TZ environment
# setting
#------------------------------------------------------------------------------
# RUNTIME STATISTICS
#------------------------------------------------------------------------------
# - Query/Index Statistics Collector -
track_activities = on
track_counts = on
track_functions = all # none, pl, all
#track_activity_query_size = 1024 # (change requires restart)
#update_process_title = on
#stats_temp_directory = 'pg_stat_tmp'
# - Statistics Monitoring -
#log_parser_stats = off
#log_planner_stats = off
#log_executor_stats = off
#log_statement_stats = off
#------------------------------------------------------------------------------
# AUTOVACUUM PARAMETERS
#------------------------------------------------------------------------------
autovacuum = on # Enable autovacuum subprocess? 'on'
# requires track_counts to also be on.
log_autovacuum_min_duration = 0 # -1 disables, 0 logs all actions and
# their durations, > 0 logs only
# actions running at least this number
# of milliseconds.
autovacuum_max_workers = 5 # max number of autovacuum subprocesses
# (change requires restart)
autovacuum_naptime =3600min # time between autovacuum runs
#autovacuum_vacuum_threshold = 50 # min number of row updates before
# vacuum
#autovacuum_analyze_threshold = 50 # min number of row updates before
# analyze
#autovacuum_vacuum_scale_factor = 0.2 # fraction of table size before vacuum
#autovacuum_analyze_scale_factor = 0.1 # fraction of table size before analyze
#autovacuum_freeze_max_age = 200000000 # maximum XID age before forced vacuum
# (change requires restart)
autovacuum_vacuum_cost_delay = 100ms # default vacuum cost delay for
# autovacuum, in milliseconds;
# -1 means use vacuum_cost_delay
#autovacuum_vacuum_cost_limit = -1 # default vacuum cost limit for
# autovacuum, -1 means use
# vacuum_cost_limit
#------------------------------------------------------------------------------
# CLIENT CONNECTION DEFAULTS
#------------------------------------------------------------------------------
# - Statement Behavior -
search_path = 'dnotam,en2,atc,notamsub,notamsearch,baselinestaging,manager,activiti,scert,"$user",public'
#default_tablespace = '' # a tablespace name, '' uses the default
#temp_tablespaces = '' # a list of tablespace names, '' uses
# only default tablespace
#check_function_bodies = on
#default_transaction_isolation = 'read committed'
#default_transaction_read_only = off
#session_replication_role = 'origin'
#statement_timeout = 0 # in milliseconds, 0 is disabled
#vacuum_freeze_min_age = 50000000
#vacuum_freeze_table_age = 150000000
#bytea_output = 'hex' # hex, escape
#xmlbinary = 'base64'
#xmloption = 'content'
# - Locale and Formatting -
datestyle = 'iso, mdy'
#intervalstyle = 'postgres'
#timezone = unknown # actually, defaults to TZ environment
# setting
#timezone_abbreviations = 'Default' # Select the set of available time zone
# abbreviations. Currently, there are
# Default
# Australia
# India
# You can create your own file in
# share/timezonesets/.
#extra_float_digits = 0 # min -15, max 3
#client_encoding = sql_ascii # actually, defaults to database
# encoding
# These settings are initialized by initdb, but they can be changed.
#lc_messages = 'C' # locale for system error message
lc_messages = 'en_US' # locale for system error message
# strings
lc_monetary = 'C' # locale for monetary formatting
lc_numeric = 'C' # locale for number formatting
lc_time = 'C' # locale for time formatting
# default configuration for text search
default_text_search_config = 'pg_catalog.simple'
#default_text_search_config = 'pg_catalog.english'
# - Other Defaults -
#dynamic_library_path = '$libdir'
#local_preload_libraries = ''
#------------------------------------------------------------------------------
# LOCK MANAGEMENT
#------------------------------------------------------------------------------
#deadlock_timeout = 1s
#max_locks_per_transaction = 64 # min 10
# (change requires restart)
# Note: Each lock table slot uses ~270 bytes of shared memory, and there are
# max_locks_per_transaction * (max_connections + max_prepared_transactions)
# lock table slots.
#------------------------------------------------------------------------------
# VERSION/PLATFORM COMPATIBILITY
#------------------------------------------------------------------------------
# - Previous PostgreSQL Versions -
#array_nulls = on
#backslash_quote = safe_encoding # on, off, or safe_encoding
#default_with_oids = off
#escape_string_warning = on
#lo_compat_privileges = off
#sql_inheritance = on
#standard_conforming_strings = off
#synchronize_seqscans = on
# - Other Platforms and Clients -
#transform_null_equals = off
#------------------------------------------------------------------------------
# CUSTOMIZED OPTIONS
#------------------------------------------------------------------------------
#custom_variable_classes = '' # list of custom variable class names
Вложения
The top command gave us the following
pci, instance #5
pci, instance #5
load averages: 17.5, 18.1, 18.6; up 673+23:00:23 16:33:58
156 processes: 140 sleeping, 16 on cpu
CPU states: 76.5% idle, 22.8% user, 0.7% kernel, 0.0% iowait, 0.0% swap
Memory: 64G phys mem, 19G free mem, 63G total swap, 63G free swap
PID USERNAME LWP PRI NICE SIZE RES STATE TIME CPU COMMAND
7041 postgres 1 0 0 3180M 3174M cpu/26 113:08 1.59% postgres
22787 postgres 1 0 0 3181M 3174M cpu/32 185:09 1.59% postgres
28199 postgres 1 0 0 3178M 3172M cpu/11 41:52 1.59% postgres
20361 postgres 1 0 0 3180M 3174M cpu/46 201:25 1.59% postgres
3768 postgres 1 0 0 3179M 3172M cpu/51 42:47 1.59% postgres
5410 postgres 1 0 0 3180M 3174M cpu/19 129:45 1.58% postgres
8183 postgres 1 0 0 3181M 3175M cpu/63 397:59 1.58% postgres
20472 postgres 1 0 0 3181M 3174M cpu/38 191:32 1.57% postgres
22793 postgres 1 0 0 3181M 3175M sleep 155:57 1.54% postgres
27811 postgres 1 0 0 3179M 3173M cpu/7 61:28 1.50% postgres
3770 postgres 1 0 0 3176M 3170M cpu/59 26:25 1.29% postgres
9473 postgres 1 0 0 3167M 3162M cpu/14 6:44 1.16% postgres
19994 postgres 1 50 0 3179M 3173M sleep 81:53 1.10% postgres
2773 postgres 1 0 0 3162M 3157M cpu/1 32:07 1.08% postgres
6356 postgres 1 0 0 3180M 3174M cpu/2 130:16 0.64% postgres
thanks for the helppci, instance #5
pci, instance #5
load averages: 17.5, 18.1, 18.6; up 673+23:00:23 16:33:58
156 processes: 140 sleeping, 16 on cpu
CPU states: 76.5% idle, 22.8% user, 0.7% kernel, 0.0% iowait, 0.0% swap
Memory: 64G phys mem, 19G free mem, 63G total swap, 63G free swap
PID USERNAME LWP PRI NICE SIZE RES STATE TIME CPU COMMAND
7041 postgres 1 0 0 3180M 3174M cpu/26 113:08 1.59% postgres
22787 postgres 1 0 0 3181M 3174M cpu/32 185:09 1.59% postgres
28199 postgres 1 0 0 3178M 3172M cpu/11 41:52 1.59% postgres
20361 postgres 1 0 0 3180M 3174M cpu/46 201:25 1.59% postgres
3768 postgres 1 0 0 3179M 3172M cpu/51 42:47 1.59% postgres
5410 postgres 1 0 0 3180M 3174M cpu/19 129:45 1.58% postgres
8183 postgres 1 0 0 3181M 3175M cpu/63 397:59 1.58% postgres
20472 postgres 1 0 0 3181M 3174M cpu/38 191:32 1.57% postgres
22793 postgres 1 0 0 3181M 3175M sleep 155:57 1.54% postgres
27811 postgres 1 0 0 3179M 3173M cpu/7 61:28 1.50% postgres
3770 postgres 1 0 0 3176M 3170M cpu/59 26:25 1.29% postgres
9473 postgres 1 0 0 3167M 3162M cpu/14 6:44 1.16% postgres
19994 postgres 1 50 0 3179M 3173M sleep 81:53 1.10% postgres
2773 postgres 1 0 0 3162M 3157M cpu/1 32:07 1.08% postgres
6356 postgres 1 0 0 3180M 3174M cpu/2 130:16 0.64% postgres
On Fri, Oct 11, 2013 at 11:56 AM, akp geek <akpgeek@gmail.com> wrote:
This is the postgresql.confWe have been running 4 of our applications on 9.0.4, which we are planning to update the database 9.2.2 by the year end. we have the streaming replication also runningWe are running 32 bit 9.0.4 on solaris
System Configuration: Sun Microsystems sun4u
Memory size: 65536 Megabytes
System Peripherals (Software Nodes):
SUNW,SPARC-Enterprise.
# -----------------------------
# PostgreSQL configuration file
# -----------------------------
#
# This file consists of lines of the form:
#
# name = value
#
# (The "=" is optional.) Whitespace may be used. Comments are introduced with
# "#" anywhere on a line. The complete list of parameter names and allowed
# values can be found in the PostgreSQL documentation.
#
# The commented-out settings shown in this file represent the default values.
# Re-commenting a setting is NOT sufficient to revert it to the default value;
# you need to reload the server.
#
# This file is read on server startup and when the server receives a SIGHUP
# signal. If you edit the file on a running system, you have to SIGHUP the
# server for the changes to take effect, or use "pg_ctl reload". Some
# parameters, which are marked below, require a server shutdown and restart to
# take effect.
#
# Any parameter can also be given as a command-line option to the server, e.g.,
# "postgres -c log_connections=on". Some parameters can be changed at run time
# with the "SET" SQL command.
#
# Memory units: kB = kilobytes Time units: ms = milliseconds
# MB = megabytes s = seconds
# GB = gigabytes min = minutes
# h = hours
# d = days
#------------------------------------------------------------------------------
# FILE LOCATIONS
#------------------------------------------------------------------------------
# The default values of these variables are driven from the -D command-line
# option or PGDATA environment variable, represented here as ConfigDir.
#data_directory = 'ConfigDir' # use data in another directory
# (change requires restart)
#hba_file = 'ConfigDir/pg_hba.conf' # host-based authentication file
# (change requires restart)
#ident_file = 'ConfigDir/pg_ident.conf' # ident configuration file
# (change requires restart)
# If external_pid_file is not explicitly set, no extra PID file is written.
#external_pid_file = '(none)' # write an extra PID file
# (change requires restart)
#------------------------------------------------------------------------------
# CONNECTIONS AND AUTHENTICATION
#------------------------------------------------------------------------------
# - Connection Settings -
listen_addresses = '*' # what IP address(es) to listen on;
# comma-separated list of addresses;
# defaults to 'localhost', '*' = all
# (change requires restart)
port = 5432 # (change requires restart)
max_connections = 300 # (change requires restart)
# Note: Increasing max_connections costs ~400 bytes of shared memory per
# connection slot, plus lock space (see max_locks_per_transaction).
#superuser_reserved_connections = 3 # (change requires restart)
#unix_socket_directory = '' # (change requires restart)
#unix_socket_group = '' # (change requires restart)
#unix_socket_permissions = 0777 # begin with 0 to use octal notation
# (change requires restart)
#bonjour = off # advertise server via Bonjour
# (change requires restart)
#bonjour_name = '' # defaults to the computer name
# (change requires restart)
# - Security and Authentication -
#authentication_timeout = 1min # 1s-600s
#ssl = off # (change requires restart)
#ssl_ciphers = 'ALL:!ADH:!LOW:!EXP:!MD5:@STRENGTH' # allowed SSL ciphers
# (change requires restart)
#ssl_renegotiation_limit = 512MB # amount of data between renegotiations
#password_encryption = on
#db_user_namespace = off
# Kerberos and GSSAPI
#krb_server_keyfile = ''
#krb_srvname = 'postgres' # (Kerberos only)
#krb_caseins_users = off
# - TCP Keepalives -
# see "man 7 tcp" for details
#tcp_keepalives_idle = 0 # TCP_KEEPIDLE, in seconds;
# 0 selects the system default
#tcp_keepalives_interval = 0 # TCP_KEEPINTVL, in seconds;
# 0 selects the system default
#tcp_keepalives_count = 0 # TCP_KEEPCNT;
# 0 selects the system default
#------------------------------------------------------------------------------
# RESOURCE USAGE (except WAL)
#------------------------------------------------------------------------------
# - Memory -
shared_buffers = 3GB # min 128kB
# (change requires restart)
temp_buffers = 250MB # min 800kB
#max_prepared_transactions = 0 # zero disables the feature
# (change requires restart)
# Note: Increasing max_prepared_transactions costs ~600 bytes of shared memory
# per transaction slot, plus lock space (see max_locks_per_transaction).
# It is not advisable to set max_prepared_transactions nonzero unless you
# actively intend to use prepared transactions.
work_mem = 60MB # min 64kB
maintenance_work_mem = 1GB # min 1MB
#maintenance_work_mem = 250MB # min 1MB
#max_stack_depth = 2MB # min 100kB
# - Kernel Resource Usage -
#max_files_per_process = 1000 # min 25
# (change requires restart)
#shared_preload_libraries = '' # (change requires restart)
# - Cost-Based Vacuum Delay -
vacuum_cost_delay = 20ms # 0-100 milliseconds
#vacuum_cost_page_hit = 1 # 0-10000 credits
#vacuum_cost_page_miss = 10 # 0-10000 credits
#vacuum_cost_page_dirty = 20 # 0-10000 credits
vacuum_cost_limit = 200 # 1-10000 credits
# - Background Writer -
#bgwriter_delay = 100ms # 10-10000ms between rounds
#bgwriter_lru_maxpages = 100 # 0-1000 max buffers written/round
#bgwriter_lru_multiplier = 2.0 # 0-10.0 multipler on buffers scanned/round
# - Asynchronous Behavior -
#effective_io_concurrency = 1 # 1-1000. 0 disables prefetching
#------------------------------------------------------------------------------
# WRITE AHEAD LOG
#------------------------------------------------------------------------------
# - Settings -
wal_level = hot_standby # minimal, archive, or hot_standby
# (change requires restart)
#fsync = on # turns forced synchronization on or off
#synchronous_commit = on # immediate fsync at commit
#wal_sync_method = fsync # the default is the first option
# supported by the operating system:
# open_datasync
# fdatasync (default on Linux)
# fsync
# fsync_writethrough
# open_sync
#full_page_writes = on # recover from partial page writes
wal_buffers = 16MB # min 32kB
# (change requires restart)
#wal_writer_delay = 100ms # 1-10000 milliseconds
#commit_delay = 0 # range 0-100000, in microseconds
#commit_siblings = 5 # range 1-1000
# - Checkpoints -
checkpoint_segments = 120 # in logfile segments, min 1, 16MB each
checkpoint_timeout = 1800s # range 30s-1h
#checkpoint_completion_target = 0.5 # checkpoint target duration, 0.0 - 1.0
#checkpoint_warning = 30s # 0 disables
# - Archiving -
archive_mode = on # allows archiving to be done
# (change requires restart)
archive_command = 'cp -i %p /fbackup/9.0.4/archive/%f < /dev/null' # command to use to archive a logfile segment
#archive_timeout = 0 # force a logfile segment switch after this
# number of seconds; 0 disables
# - Streaming Replication -
max_wal_senders = 5 # max number of walsender processes
# (change requires restart)
#wal_sender_delay = 200ms # walsender cycle time, 1-10000 milliseconds
wal_keep_segments = 5 # in logfile segments, 16MB each; 0 disables
#vacuum_defer_cleanup_age = 0 # number of xacts by which cleanup is delayed
# - Standby Servers -
hot_standby = on # "on" allows queries during recovery
# (change requires restart)
#max_standby_archive_delay = 30s # max delay before canceling queries
# when reading WAL from archive;
# -1 allows indefinite delay
#max_standby_streaming_delay = 30s # max delay before canceling queries
# when reading streaming WAL;
# -1 allows indefinite delay
#------------------------------------------------------------------------------
# QUERY TUNING
#------------------------------------------------------------------------------
# - Planner Method Configuration -
#enable_bitmapscan = on
#enable_hashagg = on
#enable_hashjoin = on
#enable_indexscan = on
#enable_material = on
#enable_mergejoin = on
#enable_nestloop = on
#enable_seqscan = on
#enable_sort = on
#enable_tidscan = on
# - Planner Cost Constants -
seq_page_cost = 1.0 # measured on an arbitrary scale
random_page_cost = 1.0 # same scale as above
#cpu_tuple_cost = 0.01 # same scale as above
#cpu_index_tuple_cost = 0.005 # same scale as above
#cpu_operator_cost = 0.0025 # same scale as above
effective_cache_size = 28GB
# - Genetic Query Optimizer -
#geqo = on
#geqo_threshold = 12
#geqo_effort = 5 # range 1-10
#geqo_pool_size = 0 # selects default based on effort
#geqo_generations = 0 # selects default based on effort
#geqo_selection_bias = 2.0 # range 1.5-2.0
#geqo_seed = 0.0 # range 0.0-1.0
# - Other Planner Options -
default_statistics_target = 1000 # range 1-10000
#constraint_exclusion = partition # on, off, or partition
#cursor_tuple_fraction = 0.1 # range 0.0-1.0
#from_collapse_limit = 8
#join_collapse_limit = 8 # 1 disables collapsing of explicit
# JOIN clauses
#------------------------------------------------------------------------------
# ERROR REPORTING AND LOGGING
#------------------------------------------------------------------------------
# - Where to Log -
log_destination = 'stderr' # Valid values are combinations of
# stderr, csvlog, syslog, and eventlog,
# depending on platform. csvlog
# requires logging_collector to be on.
# This is used when logging to stderr:
logging_collector = on # Enable capturing of stderr and csvlog
# into log files. Required to be on for
# csvlogs.
# (change requires restart)
# These are only used if logging_collector is on:
log_directory = '/fdata/9.0.4/logs' # directory where log files are written,
# can be absolute or relative to PGDATA
#log_filename = 'postgresql-%Y-%m-%d_%H%M%S.log' # log file name pattern,
log_filename = 'server_log.%a' # log file name pattern,
# can include strftime() escapes
log_truncate_on_rotation = on # If on, an existing log file of the
# same name as the new log file will be
# truncated rather than appended to.
# But such truncation only occurs on
# time-driven rotation, not on restarts
# or size-driven rotation. Default is
# off, meaning append to existing files
# in all cases.
log_rotation_age = 1440 # Automatic rotation of logfiles will
# happen after that time. 0 disables.
log_rotation_size = 100MB # Automatic rotation of logfiles will
# happen after that much log output.
# 0 disables.
# These are relevant when logging to syslog:
#syslog_facility = 'LOCAL0'
#syslog_ident = 'postgres'
#silent_mode = off # Run server silently.
# DO NOT USE without syslog or
# logging_collector
# (change requires restart)
# - When to Log -
client_min_messages = error # values in order of decreasing detail:
# debug5
# debug4
# debug3
# debug2
# debug1
# log
# notice
# warning
# error
log_min_messages = log # values in order of decreasing detail:
# debug5
# debug4
# debug3
# debug2
# debug1
# info
# notice
# warning
# error
# log
# fatal
# panic
log_min_error_statement = error # values in order of decreasing detail:
# debug5
# debug4
# debug3
# debug2
# debug1
# info
# notice
# warning
# error
# log
# fatal
# panic (effectively off)
log_min_duration_statement = 4000 # -1 is disabled, 0 logs all statements
# and their durations, > 0 logs only
# statements running at least this number
# of milliseconds
# - What to Log -
#debug_print_parse = off
#debug_print_rewritten = off
#debug_print_plan = off
#debug_pretty_print = on
#log_checkpoints = on
log_connections = on
#log_disconnections = on
log_duration = on
#log_error_verbosity = terse # terse, default, or verbose messages
log_hostname = on
#log_line_prefix = '%a %r %e %i %t %d' # special values:
log_line_prefix = '%t [%p]: [%l-1] user=%u,db=%d'
# %a = application name
# %u = user name
# %d = database name
# %r = remote host and port
# %h = remote host
# %p = process ID
# %t = timestamp without milliseconds
# %m = timestamp with milliseconds
# %i = command tag
# %e = SQL state
# %c = session ID
# %l = session line number
# %s = session start timestamp
# %v = virtual transaction ID
# %x = transaction ID (0 if none)
# %q = stop here in non-session
# processes
# %% = '%'
# e.g. '<%u%%%d> '
#log_lock_waits = off # log lock waits >= deadlock_timeout
log_statement = 'all' # none, ddl, mod, all
#log_temp_files = -1 # log temporary files equal or larger
# than the specified size in kilobytes;
# -1 disables, 0 logs all temp files
#log_timezone = unknown # actually, defaults to TZ environment
# setting
#------------------------------------------------------------------------------
# RUNTIME STATISTICS
#------------------------------------------------------------------------------
# - Query/Index Statistics Collector -
track_activities = on
track_counts = on
track_functions = all # none, pl, all
#track_activity_query_size = 1024 # (change requires restart)
#update_process_title = on
#stats_temp_directory = 'pg_stat_tmp'
# - Statistics Monitoring -
#log_parser_stats = off
#log_planner_stats = off
#log_executor_stats = off
#log_statement_stats = off
#------------------------------------------------------------------------------
# AUTOVACUUM PARAMETERS
#------------------------------------------------------------------------------
autovacuum = on # Enable autovacuum subprocess? 'on'
# requires track_counts to also be on.
log_autovacuum_min_duration = 0 # -1 disables, 0 logs all actions and
# their durations, > 0 logs only
# actions running at least this number
# of milliseconds.
autovacuum_max_workers = 5 # max number of autovacuum subprocesses
# (change requires restart)
autovacuum_naptime =3600min # time between autovacuum runs
#autovacuum_vacuum_threshold = 50 # min number of row updates before
# vacuum
#autovacuum_analyze_threshold = 50 # min number of row updates before
# analyze
#autovacuum_vacuum_scale_factor = 0.2 # fraction of table size before vacuum
#autovacuum_analyze_scale_factor = 0.1 # fraction of table size before analyze
#autovacuum_freeze_max_age = 200000000 # maximum XID age before forced vacuum
# (change requires restart)
autovacuum_vacuum_cost_delay = 100ms # default vacuum cost delay for
# autovacuum, in milliseconds;
# -1 means use vacuum_cost_delay
#autovacuum_vacuum_cost_limit = -1 # default vacuum cost limit for
# autovacuum, -1 means use
# vacuum_cost_limit
#------------------------------------------------------------------------------
# CLIENT CONNECTION DEFAULTS
#------------------------------------------------------------------------------
# - Statement Behavior -
search_path = 'dnotam,en2,atc,notamsub,notamsearch,baselinestaging,manager,activiti,scert,"$user",public'
#default_tablespace = '' # a tablespace name, '' uses the default
#temp_tablespaces = '' # a list of tablespace names, '' uses
# only default tablespace
#check_function_bodies = on
#default_transaction_isolation = 'read committed'
#default_transaction_read_only = off
#session_replication_role = 'origin'
#statement_timeout = 0 # in milliseconds, 0 is disabled
#vacuum_freeze_min_age = 50000000
#vacuum_freeze_table_age = 150000000
#bytea_output = 'hex' # hex, escape
#xmlbinary = 'base64'
#xmloption = 'content'
# - Locale and Formatting -
datestyle = 'iso, mdy'
#intervalstyle = 'postgres'
#timezone = unknown # actually, defaults to TZ environment
# setting
#timezone_abbreviations = 'Default' # Select the set of available time zone
# abbreviations. Currently, there are
# Default
# Australia
# India
# You can create your own file in
# share/timezonesets/.
#extra_float_digits = 0 # min -15, max 3
#client_encoding = sql_ascii # actually, defaults to database
# encoding
# These settings are initialized by initdb, but they can be changed.
#lc_messages = 'C' # locale for system error message
lc_messages = 'en_US' # locale for system error message
# strings
lc_monetary = 'C' # locale for monetary formatting
lc_numeric = 'C' # locale for number formatting
lc_time = 'C' # locale for time formatting
# default configuration for text search
default_text_search_config = 'pg_catalog.simple'
#default_text_search_config = 'pg_catalog.english'
# - Other Defaults -
#dynamic_library_path = '$libdir'
#local_preload_libraries = ''
#------------------------------------------------------------------------------
# LOCK MANAGEMENT
#------------------------------------------------------------------------------
#deadlock_timeout = 1s
#max_locks_per_transaction = 64 # min 10
# (change requires restart)
# Note: Each lock table slot uses ~270 bytes of shared memory, and there are
# max_locks_per_transaction * (max_connections + max_prepared_transactions)
# lock table slots.
#------------------------------------------------------------------------------
# VERSION/PLATFORM COMPATIBILITY
#------------------------------------------------------------------------------
# - Previous PostgreSQL Versions -
#array_nulls = on
#backslash_quote = safe_encoding # on, off, or safe_encoding
#default_with_oids = off
#escape_string_warning = on
#lo_compat_privileges = off
#sql_inheritance = on
#standard_conforming_strings = off
#synchronize_seqscans = on
# - Other Platforms and Clients -
#transform_null_equals = off
#------------------------------------------------------------------------------
# CUSTOMIZED OPTIONS
#------------------------------------------------------------------------------
#custom_variable_classes = '' # list of custom variable class names
On 10/11/2013 08:56 AM, akp geek wrote:
> We have been running 4 of our applications on 9.0.4, which we are
> planning to update the database 9.2.2 by the year end....

Sorry if I missed it but I couldn't find a question or description of a
problem you are encountering.

Cheers,
Steve
On 10/11/2013 9:34 AM, akp geek wrote:
>
> thanks for the help

whats the question?    you list what you're doing, and give a snapshot
of your system state while doing some unspecified tasks.


--
john r pierce                                      37N 122W
somewhere on the middle of the left coast
On 10/11/2013 8:56 AM, akp geek wrote:
> We have been running 4 of our applications on 9.0.4, which we are
> planning to update the database 9.2.2

9.0 is currently at 9.0.14, and 9.2 is currently at 9.2.5.


--
john r pierce                                      37N 122W
somewhere on the middle of the left coast
On Sat, Oct 12, 2013 at 12:56 AM, akp geek <akpgeek@gmail.com> wrote:
> We have been running 4 of our applications on 9.0.4, which we are planning
> to update the database 9.2.2 by the year end. we have the streaming
> replication also running
9.2.4 has fixed a severe security problem. If you do not want to
expose your cluster to that, you should at least upgrade to this
version.
And posting a question would be better...
--
Michael
Sorry all not posting clear. I posted our postresql.conf file. What we are having is very slow response from the database.
would like to get some feedback about postgresql.conf file parameters that I posted are causing the issue for performance of the DB.pci, instance #5
pci, instance #5
load averages: 17.5, 18.1, 18.6; up 673+23:00:23
16:33:58
156 processes: 140 sleeping, 16 on cpu
CPU states: 76.5% idle, 22.8% user, 0.7% kernel, 0.0% iowait, 0.0% swap
Memory: 64G phys mem, 19G free mem, 63G total swap, 63G free swap
Regards156 processes: 140 sleeping, 16 on cpu
CPU states: 76.5% idle, 22.8% user, 0.7% kernel, 0.0% iowait, 0.0% swap
Memory: 64G phys mem, 19G free mem, 63G total swap, 63G free swap
On Sat, Oct 12, 2013 at 7:43 AM, Michael Paquier <michael.paquier@gmail.com> wrote:
On Sat, Oct 12, 2013 at 12:56 AM, akp geek <akpgeek@gmail.com> wrote:9.2.4 has fixed a severe security problem. If you do not want to
> We have been running 4 of our applications on 9.0.4, which we are planning
> to update the database 9.2.2 by the year end. we have the streaming
> replication also running
expose your cluster to that, you should at least upgrade to this
version.
And posting a question would be better...
--
Michael
On Sun, Oct 13, 2013 at 8:43 AM, akp geek <akpgeek@gmail.com> wrote:
You aren't going to get much help without some specific details about what is slow.
https://wiki.postgresql.org/wiki/Slow_Query_Questions
Our database is about 60GB and performance is very bad.Sorry all not posting clear. I posted our postresql.conf file. What we are having is very slow response from the database.would like to get some feedback about postgresql.conf file parameters that I posted are causing the issue for performance of the DB.
pci, instance #5
pci, instance #5
load averages: 17.5, 18.1, 18.6; up 673+23:00:2316:33:58
156 processes: 140 sleeping, 16 on cpu
CPU states: 76.5% idle, 22.8% user, 0.7% kernel, 0.0% iowait, 0.0% swap
Memory: 64G phys mem, 19G free mem, 63G total swap, 63G free swap
You aren't going to get much help without some specific details about what is slow.
https://wiki.postgresql.org/wiki/Slow_Query_Questions
Hi,

On 13.10.2013 17:43, akp geek wrote:
> Sorry all not posting clear.  I posted our postresql.conf file. What
> we are having is very slow response from the database.
>
> would like to get some feedback about postgresql.conf file
> parameters that I posted are causing the issue for performance of the
> DB.
>
> Our database is about 60GB and performance is very bad.

The postgresql.conf seems fine - at least I haven't noticed anything
obviously wrong there. But we know almost nothing about your HW (not
even what kind of CPU / how many cores, etc.) or  how you're using it.

For example you haven't even posted a complete top output, so we have no
idea what else is running on the box. OTOH the box seems to be rather
idle - there's plenty of CPU, RAM and the disks are rather idle.

Why exactly do you think it's the database that's slow?

We can't really help you unless you show us what exactly you consider
slow. The best thing you can probably do is to show us a slow query
along with it's EXPLAIN ANALYZE output (use explain.depesz.com to post it).

And it'd be nice to know the history around this - was it fast before,
did it get slow suddenly or over a longer period of time?

regards
Tomas
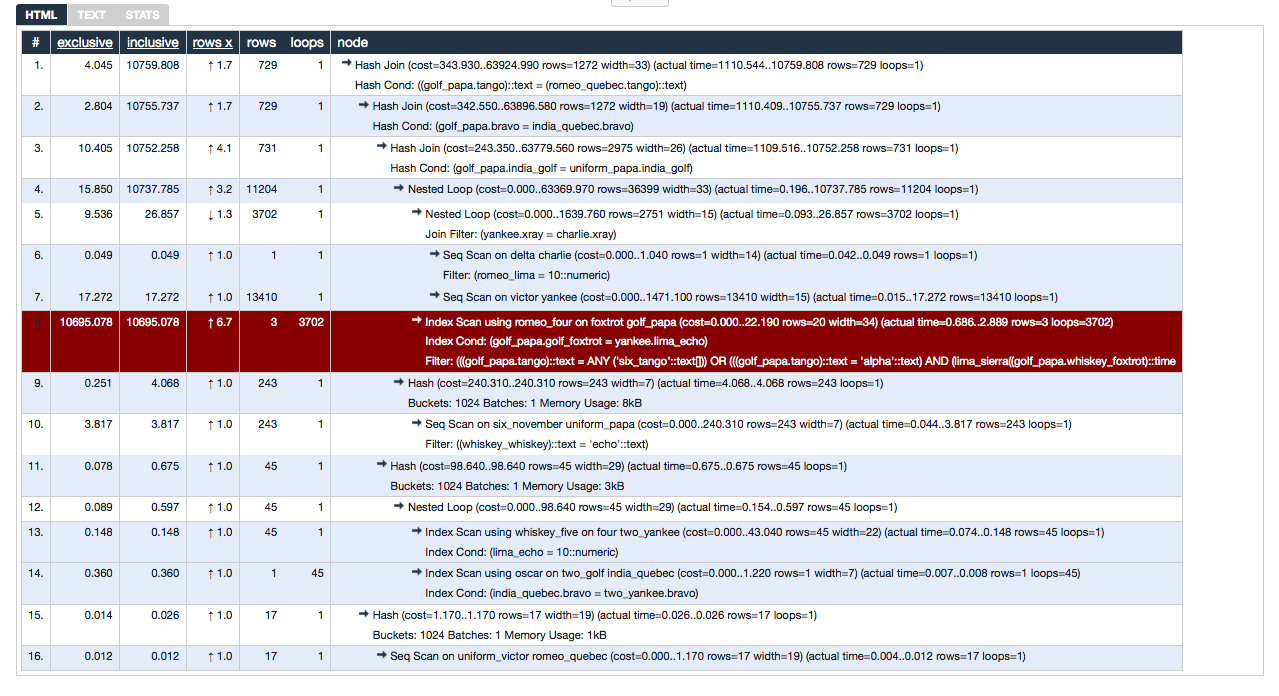
On 17.10.2013 20:56, akp geek wrote:
> got the output from depesz and this the top on the system.   thanks for
> the help ..

From depesz? That site works differently - you enter the explain plan
into the form, it does some formatting/highlighting and you're supposed
to submit the link to that page. E.g. http://explain.depesz.com/s/JwTB
is for your query.

However it seems you've done some anonymization on the query, e.g.
replacing the table/index/function names and string literals with some
random words.

Anyway, the plan shows the estimates are reasonably accurate, but the
index scan on romeo_four consumes ~99% of the query duration. Not sure
if it can be improved, because we don't know the original query and the
anonymization made it rather annoying to deal with.

>
> Regards
>
> load averages:  30.3,  28.8,  27.8;                    up
> 680+00:51:09
> 18:24:44
> 156 processes: 123 sleeping, 33 on cpu
> CPU states: 49.5% idle, 50.0% user,  0.4% kernel,  0.0% iowait,  0.0% swap
> Memory: 64G phys mem, 19G free mem, 63G total swap, 63G free swap
>
>    PID USERNAME LWP PRI NICE  SIZE   RES STATE    TIME    CPU COMMAND
>   7965 postgres   1  20    0 3178M 3171M cpu/7   78:21  1.58% postgres
>  20638 postgres   1  20    0 3181M 3175M cpu/28 187:01  1.58% postgres
>  22819 postgres   1  30    0 3181M 3175M cpu/33 264:06  1.57% postgres
>   3789 postgres   1  20    0 3183M 3176M cpu/9  626:11  1.57% postgres
>  10375 postgres   1  30    0 3182M 3175M cpu/50 293:55  1.57% postgres
>  27335 postgres   1  30    0 3175M 3169M cpu/29  27:27  1.57% postgres
>   7959 postgres   1  30    0 3178M 3171M cpu/41 104:07  1.57% postgres
>   8156 postgres   1  30    0 3180M 3173M cpu/43 124:18  1.56% postgres
>  20640 postgres   1   0    0 3182M 3176M cpu/58 207:49  1.56% postgres
>  10584 postgres   1  30    0 3179M 3173M cpu/35  76:32  1.56% postgres
>  13984 postgres   1  30    0 3181M 3174M cpu/30 207:04  1.56% postgres
>   3575 postgres   1  20    0 3283M 3261M cpu/19   1:48  1.56% postgres
>   7964 postgres   1  40    0 3177M 3170M cpu/62  82:56  1.56% postgres
>   1299 postgres   1  40    0 3166M 3161M cpu/52   5:11  1.56% postgres
>  27692 postgres   1   0    0 3181M 3174M cpu/46 260:58  1.56% postgres


Once again, this top output is incomplete - all it lists are postgres
processes (and it's unclear what they're doing), but there are certainly
some other processes running. Moreover, those 15 processes account for
only ~25% of CPU, but there's almost 50% CPU utilized. So where's the rest?

Tomas
got the output from depesz and this the top on the system. thanks for the help ..
Regardsload averages: 30.3, 28.8, 27.8; up 680+00:51:09 18:24:44
156 processes: 123 sleeping, 33 on cpu
CPU states: 49.5% idle, 50.0% user, 0.4% kernel, 0.0% iowait, 0.0% swap
Memory: 64G phys mem, 19G free mem, 63G total swap, 63G free swap
PID USERNAME LWP PRI NICE SIZE RES STATE TIME CPU COMMAND
7965 postgres 1 20 0 3178M 3171M cpu/7 78:21 1.58% postgres
20638 postgres 1 20 0 3181M 3175M cpu/28 187:01 1.58% postgres
22819 postgres 1 30 0 3181M 3175M cpu/33 264:06 1.57% postgres
3789 postgres 1 20 0 3183M 3176M cpu/9 626:11 1.57% postgres
10375 postgres 1 30 0 3182M 3175M cpu/50 293:55 1.57% postgres
27335 postgres 1 30 0 3175M 3169M cpu/29 27:27 1.57% postgres
7959 postgres 1 30 0 3178M 3171M cpu/41 104:07 1.57% postgres
8156 postgres 1 30 0 3180M 3173M cpu/43 124:18 1.56% postgres
20640 postgres 1 0 0 3182M 3176M cpu/58 207:49 1.56% postgres
10584 postgres 1 30 0 3179M 3173M cpu/35 76:32 1.56% postgres
13984 postgres 1 30 0 3181M 3174M cpu/30 207:04 1.56% postgres
3575 postgres 1 20 0 3283M 3261M cpu/19 1:48 1.56% postgres
7964 postgres 1 40 0 3177M 3170M cpu/62 82:56 1.56% postgres
1299 postgres 1 40 0 3166M 3161M cpu/52 5:11 1.56% postgres
27692 postgres 1 0 0 3181M 3174M cpu/46 260:58 1.56% postgres
Hash Join (cost=343.930..63924.990 rows=1272 width=33) (actual time=1110.544..10759.808 rows=729 loops=1) Hash Cond: ((golf_papa.tango)::text = (romeo_quebec.tango)::text) -> Hash Join (cost=342.550..63896.580 rows=1272 width=19) (actual time=1110.409..10755.737 rows=729 loops=1) Hash Cond: (golf_papa.bravo = india_quebec.bravo) -> Hash Join (cost=243.350..63779.560 rows=2975 width=26) (actual time=1109.516..10752.258 rows=731 loops=1) Hash Cond: (golf_papa.india_golf = uniform_papa.india_golf) -> Nested Loop (cost=0.000..63369.970 rows=36399 width=33) (actual time=0.196..10737.785 rows=11204 loops=1) -> Nested Loop (cost=0.000..1639.760 rows=2751 width=15) (actual time=0.093..26.857 rows=3702 loops=1) Join Filter: (yankee.xray = charlie.xray) -> Seq Scan on delta charlie (cost=0.000..1.040 rows=1 width=14) (actual time=0.042..0.049 rows=1 loops=1) Filter: (romeo_lima = 10::numeric) -> Seq Scan on victor yankee (cost=0.000..1471.100 rows=13410 width=15) (actual time=0.015..17.272 rows=13410 loops=1) -> Index Scan using romeo_four on foxtrot golf_papa (cost=0.000..22.190 rows=20 width=34) (actual time=0.686..2.889 rows=3 loops=3702) Index Cond: (golf_papa.golf_foxtrot = yankee.lima_echo) Filter: (((golf_papa.tango)::text = ANY ('six_tango'::text[])) OR (((golf_papa.tango)::text = 'alpha'::text) AND (lima_sierra((golf_papa.whiskey_foxtrot)::time -> Hash (cost=240.310..240.310 rows=243 width=7) (actual time=4.068..4.068 rows=243 loops=1) Buckets: 1024 Batches: 1 Memory Usage: 8kB -> Seq Scan on six_november uniform_papa (cost=0.000..240.310 rows=243 width=7) (actual time=0.044..3.817 rows=243 loops=1) Filter: ((whiskey_whiskey)::text = 'echo'::text) -> Hash (cost=98.640..98.640 rows=45 width=29) (actual time=0.675..0.675 rows=45 loops=1) Buckets: 1024 Batches: 1 Memory Usage: 3kB -> Nested Loop (cost=0.000..98.640 rows=45 width=29) (actual time=0.154..0.597 rows=45 loops=1) -> Index Scan using whiskey_five on four two_yankee (cost=0.000..43.040 rows=45 width=22) (actual time=0.074..0.148 rows=45 loops=1) Index Cond: (lima_echo = 10::numeric) -> Index Scan using oscar on two_golf india_quebec (cost=0.000..1.220 rows=1 width=7) (actual time=0.007..0.008 rows=1 loops=45) Index Cond: (india_quebec.bravo = two_yankee.bravo) -> Hash (cost=1.170..1.170 rows=17 width=19) (actual time=0.026..0.026 rows=17 loops=1) Buckets: 1024 Batches: 1 Memory Usage: 1kB -> Seq Scan on uniform_victor romeo_quebec (cost=0.000..1.170 rows=17 width=19) (actual time=0.004..0.012 rows=17 loops=1) On Sun, Oct 13, 2013 at 8:17 PM, Tomas Vondra <tv@fuzzy.cz> wrote:
Hi,The postgresql.conf seems fine - at least I haven't noticed anything
On 13.10.2013 17:43, akp geek wrote:
> Sorry all not posting clear. I posted our postresql.conf file. What
> we are having is very slow response from the database.
>
> would like to get some feedback about postgresql.conf file
> parameters that I posted are causing the issue for performance of the
> DB.
>
> Our database is about 60GB and performance is very bad.
obviously wrong there. But we know almost nothing about your HW (not
even what kind of CPU / how many cores, etc.) or how you're using it.
For example you haven't even posted a complete top output, so we have no
idea what else is running on the box. OTOH the box seems to be rather
idle - there's plenty of CPU, RAM and the disks are rather idle.
Why exactly do you think it's the database that's slow?
We can't really help you unless you show us what exactly you consider
slow. The best thing you can probably do is to show us a slow query
along with it's EXPLAIN ANALYZE output (use explain.depesz.com to post it).
And it'd be nice to know the history around this - was it fast before,
did it get slow suddenly or over a longer period of time?
regards
Tomas
--
Sent via pgsql-general mailing list (pgsql-general@postgresql.org)
To make changes to your subscription:
http://www.postgresql.org/mailpref/pgsql-general
Вложения
Hi,
On 18 Říjen 2013, 17:06, akp geek wrote:
> when I issue the top command on solaris, what ever I have posted is
> exactly
> getting.
>
> top -n
> load averages: 11.4, 10.8, 10.2; up 680+21:31:46
> 15:05:21
> 137 processes: 123 sleeping, 14 on cpu
> CPU states: 82.0% idle, 17.5% user, 0.5% kernel, 0.0% iowait, 0.0% swap
> Memory: 64G phys mem, 20G free mem, 63G total swap, 63G free swap
>
> PID USERNAME LWP PRI NICE SIZE RES STATE TIME CPU COMMAND
> 12185 postgres 1 50 0 3172M 3165M cpu/0 9:56 1.80% postgres
> 23338 postgres 1 50 0 3180M 3173M cpu/8 79:08 1.77% postgres
> 2446 postgres 1 0 0 3174M 3167M cpu/24 0:58 1.76% postgres
> 18359 postgres 1 0 0 3172M 3164M cpu/46 4:00 1.60% postgres
> 28428 postgres 1 0 0 3178M 3171M cpu/17 58:15 1.60% postgres
> 10698 postgres 1 0 0 3179M 3173M cpu/62 68:33 1.55% postgres
> 28374 postgres 1 0 0 3178M 3172M cpu/14 47:01 1.55% postgres
> 6145 postgres 1 0 0 3180M 3173M cpu/39 115:05 1.55% postgres
> 2380 postgres 1 0 0 3179M 3172M cpu/34 53:38 1.54% postgres
> 2088 postgres 1 0 0 3179M 3172M cpu/31 37:43 1.51% postgres
> 19360 postgres 1 50 0 3172M 3165M cpu/3 6:55 0.84% postgres
> 28426 postgres 1 19 0 3179M 3172M cpu/21 70:34 0.61% postgres
> 21196 postgres 1 52 0 3403M 3392M sleep 0:05 0.37% postgres
> 21237 root 1 49 0 5632K 4000K cpu/51 0:00 0.11% sshd
> 415 daemon 6 59 0 6312K 3208K sleep 107:52 0.02% kcfd
1) I'm not sure what options "top" has on solaris, but on Linux you can
hit "c" which will give you an extended info about the projects.
2) I seriously doubt there are just ssh+kscd+postgres processes running on
your box.
3) Are you sure the top output was collected while the slow queries were
running? Because to me it seems the top output was collected while the
system is relatively idle - there's 82% free CPU, no I/O activity at all.
Are you sure you have no zones/containers defines? I'm not familiar with
that so maybe this is how it looks when you hit zone limits?
>
>
> this is the plan that was generated again.. Thanks a lot.
>
> Hash Join (cost=343.96..41796.15 rows=751 width=33) (actual
> time=635.192..5799.477 rows=709 loops=1)
> Hash Cond: ((te.statuscode)::text = (tt.statuscode)::text)
> -> Hash Join (cost=342.58..41778.81 rows=751 width=19) (actual
> time=635.135..5797.003 rows=709 loops=1)
> Hash Cond: (te.scenarioid = ts.scenarioid)
> -> Hash Join (cost=243.38..41667.95 rows=1947 width=26)
> (actual time=634.564..5794.768 rows=711 loops=1)
> Hash Cond: (te.userid = tu.userid)
> -> Nested Loop (cost=0.00..41311.26 rows=25026
> width=33) (actual time=0.060..5782.882 rows=11223 loops=1)
> -> Nested Loop (cost=0.00..1639.76 rows=2751
> width=15) (actual time=0.023..20.904 rows=3702 loops=1)
> Join Filter: (td.occserviceareaid =
> tz.occserviceareaid)
> -> Seq Scan on t_occ tz (cost=0.00..1.04
> rows=1 width=14) (actual time=0.006..0.012 rows=1 loops=1)
> Filter: (occid = 10::numeric)
> -> Seq Scan on t_domesticnotamlocation td
> (cost=0.00..1471.10 rows=13410 width=15) (actual time=0.012..13.932
> rows=13410 loops=1)
> -> Index Scan using x_event_ix1 on t_event te
> (cost=0.00..14.26 rows=13 width=34) (actual time=0.339..1.553 rows=3
> loops=3702)
> Index Cond: (te.affectedlocationid = td.locid)
> Filter: (((te.statuscode)::text = ANY
> ('{CON,AERR,SERR,CERR,ACON}'::text[])) OR (((te.statuscode)::text =
> 'ACT'::text) AND (COALESCE((te.enddate)::time
> stamp with time zone, now()) >= (now() - '2 days'::interval))) OR
> (((te.statuscode)::text = 'CAN'::text) AND (te.canceldate >= (now() -
> '2 days'::interval))) OR (((te.statuscode)
> ::text = ANY ('{APEN,CINP,AINP}'::text[])) AND
> (COALESCE((te.enddate)::timestamp with time zone, now()) >= now())))
> -> Hash (cost=240.34..240.34 rows=243 width=7)
> (actual time=4.040..4.040 rows=243 loops=1)
> Buckets: 1024 Batches: 1 Memory Usage: 8kB
> -> Seq Scan on t_user tu (cost=0.00..240.34
> rows=243 width=7) (actual time=0.040..3.868 rows=243 loops=1)
> Filter: ((usertype)::text = 'OCC'::text)
> -> Hash (cost=98.64..98.64 rows=45 width=29) (actual
> time=0.549..0.549 rows=45 loops=1)
> Buckets: 1024 Batches: 1 Memory Usage: 3kB
> -> Nested Loop (cost=0.00..98.64 rows=45 width=29)
> (actual time=0.044..0.496 rows=45 loops=1)
> -> Index Scan using x_locscenario_pk on
> t_locscenariomap tc (cost=0.00..43.04 rows=45 width=22) (actual
> time=0.028..0.098 rows=45 loops=1)
> Index Cond: (locid = 10::numeric)
> -> Index Scan using c_scenariocatalog_pk on
> t_scenariocatalog ts (cost=0.00..1.22 rows=1 width=7) (actual
> time=0.006..0.007 rows=1 loops=45)
> Index Cond: (ts.scenarioid = tc.scenarioid)
> -> Hash (cost=1.17..1.17 rows=17 width=19) (actual
> time=0.026..0.026 rows=17 loops=1)
> Buckets: 1024 Batches: 1 Memory Usage: 1kB
> -> Seq Scan on t_eventstatus tt (cost=0.00..1.17 rows=17
> width=19) (actual time=0.004..0.010 rows=17 loops=1)
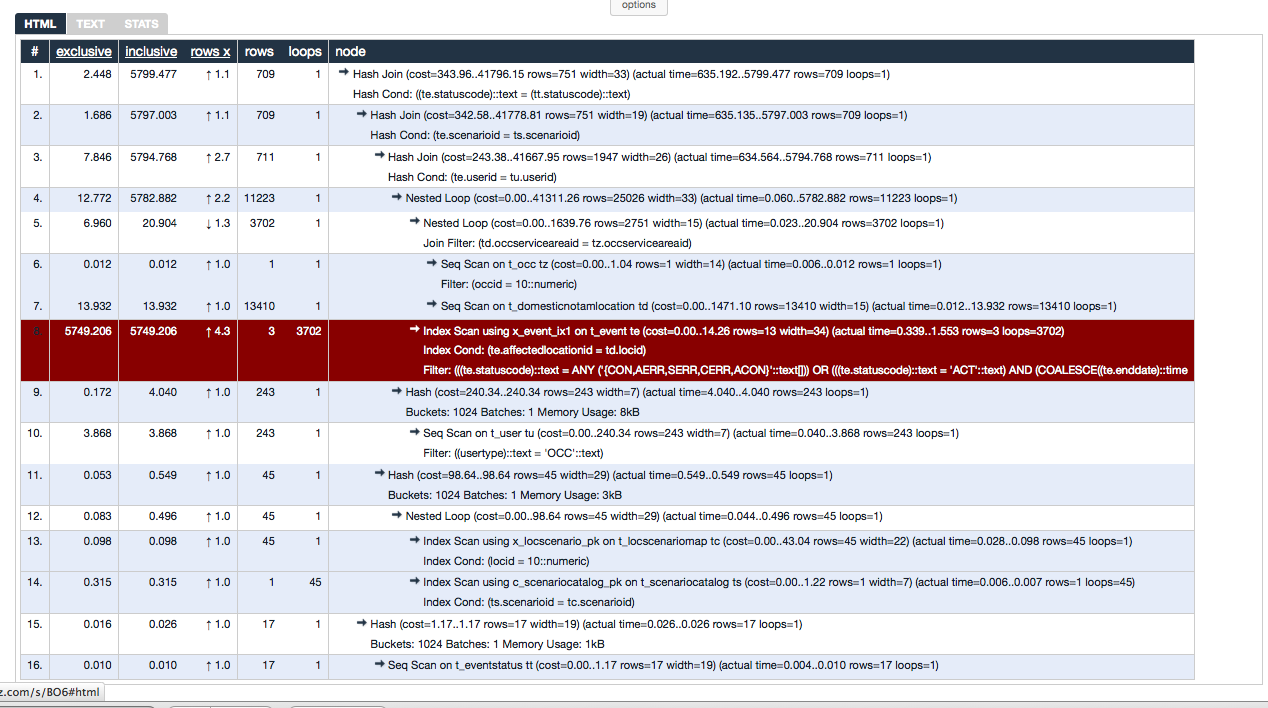
Please, don't send screenshots to the conference. The explain.depesz.com
gives you a unique URL for each submitted query, so just copy it into the
message. Like this: http://explain.depesz.com/s/SLj
Anyway, now the query took only 5 seconds, not 10 as before. If you run
the query without the EXPLAIN ANALYZE, how long it takes? (use \timing in
psql).
The slowest part of the query remains the index scan on t_event using
using x_event_ix1, repeated 3702x and consuming 99% of the query time.
What can you tell us about this table? What is the table definition
(columns, data types, ...) and stats (number of rows, size, live/dead
tuples)?
regards
Tomas
when I issue the top command on solaris, what ever I have posted is exactly getting.
top -n
load averages: 11.4, 10.8, 10.2; up 680+21:31:46 15:05:21
137 processes: 123 sleeping, 14 on cpu
CPU states: 82.0% idle, 17.5% user, 0.5% kernel, 0.0% iowait, 0.0% swap
Memory: 64G phys mem, 20G free mem, 63G total swap, 63G free swap
PID USERNAME LWP PRI NICE SIZE RES STATE TIME CPU COMMAND
12185 postgres 1 50 0 3172M 3165M cpu/0 9:56 1.80% postgres
23338 postgres 1 50 0 3180M 3173M cpu/8 79:08 1.77% postgres
2446 postgres 1 0 0 3174M 3167M cpu/24 0:58 1.76% postgres
18359 postgres 1 0 0 3172M 3164M cpu/46 4:00 1.60% postgres
28428 postgres 1 0 0 3178M 3171M cpu/17 58:15 1.60% postgres
10698 postgres 1 0 0 3179M 3173M cpu/62 68:33 1.55% postgres
28374 postgres 1 0 0 3178M 3172M cpu/14 47:01 1.55% postgres
6145 postgres 1 0 0 3180M 3173M cpu/39 115:05 1.55% postgres
2380 postgres 1 0 0 3179M 3172M cpu/34 53:38 1.54% postgres
2088 postgres 1 0 0 3179M 3172M cpu/31 37:43 1.51% postgres
19360 postgres 1 50 0 3172M 3165M cpu/3 6:55 0.84% postgres
28426 postgres 1 19 0 3179M 3172M cpu/21 70:34 0.61% postgres
21196 postgres 1 52 0 3403M 3392M sleep 0:05 0.37% postgres
21237 root 1 49 0 5632K 4000K cpu/51 0:00 0.11% sshd
415 daemon 6 59 0 6312K 3208K sleep 107:52 0.02% kcfd
this is the plan that was generated again.. Thanks a lot.top -n
load averages: 11.4, 10.8, 10.2; up 680+21:31:46 15:05:21
137 processes: 123 sleeping, 14 on cpu
CPU states: 82.0% idle, 17.5% user, 0.5% kernel, 0.0% iowait, 0.0% swap
Memory: 64G phys mem, 20G free mem, 63G total swap, 63G free swap
PID USERNAME LWP PRI NICE SIZE RES STATE TIME CPU COMMAND
12185 postgres 1 50 0 3172M 3165M cpu/0 9:56 1.80% postgres
23338 postgres 1 50 0 3180M 3173M cpu/8 79:08 1.77% postgres
2446 postgres 1 0 0 3174M 3167M cpu/24 0:58 1.76% postgres
18359 postgres 1 0 0 3172M 3164M cpu/46 4:00 1.60% postgres
28428 postgres 1 0 0 3178M 3171M cpu/17 58:15 1.60% postgres
10698 postgres 1 0 0 3179M 3173M cpu/62 68:33 1.55% postgres
28374 postgres 1 0 0 3178M 3172M cpu/14 47:01 1.55% postgres
6145 postgres 1 0 0 3180M 3173M cpu/39 115:05 1.55% postgres
2380 postgres 1 0 0 3179M 3172M cpu/34 53:38 1.54% postgres
2088 postgres 1 0 0 3179M 3172M cpu/31 37:43 1.51% postgres
19360 postgres 1 50 0 3172M 3165M cpu/3 6:55 0.84% postgres
28426 postgres 1 19 0 3179M 3172M cpu/21 70:34 0.61% postgres
21196 postgres 1 52 0 3403M 3392M sleep 0:05 0.37% postgres
21237 root 1 49 0 5632K 4000K cpu/51 0:00 0.11% sshd
415 daemon 6 59 0 6312K 3208K sleep 107:52 0.02% kcfd
Hash Join  (cost=343.96..41796.15 rows=751 width=33) (actual time=635.192..5799.477 rows=709 loops=1)   Hash Cond: ((te.statuscode)::text = (tt.statuscode)::text)   ->  Hash Join  (cost=342.58..41778.81 rows=751 width=19) (actual time=635.135..5797.003 rows=709 loops=1)         Hash Cond: (te.scenarioid = ts.scenarioid)         ->  Hash Join  (cost=243.38..41667.95 rows=1947 width=26) (actual time=634.564..5794.768 rows=711 loops=1)               Hash Cond: (te.userid = tu.userid)               ->  Nested Loop  (cost=0.00..41311.26 rows=25026 width=33) (actual time=0.060..5782.882 rows=11223 loops=1)                     ->  Nested Loop  (cost=0.00..1639.76 rows=2751 width=15) (actual time=0.023..20.904 rows=3702 loops=1)                           Join Filter: (td.occserviceareaid = tz.occserviceareaid)                           ->  Seq Scan on t_occ tz  (cost=0.00..1.04 rows=1 width=14) (actual time=0.006..0.012 rows=1 loops=1)                                 Filter: (occid = 10::numeric)                           ->  Seq Scan on t_domesticnotamlocation td  (cost=0.00..1471.10 rows=13410 width=15) (actual time=0.012..13.932 rows=13410 loops=1)                     ->  Index Scan using x_event_ix1 on t_event te  (cost=0.00..14.26 rows=13 width=34) (actual time=0.339..1.553 rows=3 loops=3702)                           Index Cond: (te.affectedlocationid = td.locid)                           Filter: (((te.statuscode)::text = ANY ('{CON,AERR,SERR,CERR,ACON}'::text[])) OR (((te.statuscode)::text = 'ACT'::text) AND (COALESCE((te.enddate)::time
stamp with time zone, now()) >= (now() - '2 days'::interval))) OR (((te.statuscode)::text = 'CAN'::text) AND (te.canceldate >= (now() - '2 days'::interval))) OR (((te.statuscode)
::text = ANY ('{APEN,CINP,AINP}'::text[])) AND (COALESCE((te.enddate)::timestamp with time zone, now()) >= now())))               ->  Hash  (cost=240.34..240.34 rows=243 width=7) (actual time=4.040..4.040 rows=243 loops=1)                     Buckets: 1024  Batches: 1  Memory Usage: 8kB                     ->  Seq Scan on t_user tu  (cost=0.00..240.34 rows=243 width=7) (actual time=0.040..3.868 rows=243 loops=1)                           Filter: ((usertype)::text = 'OCC'::text)         ->  Hash  (cost=98.64..98.64 rows=45 width=29) (actual time=0.549..0.549 rows=45 loops=1)               Buckets: 1024  Batches: 1  Memory Usage: 3kB               ->  Nested Loop  (cost=0.00..98.64 rows=45 width=29) (actual time=0.044..0.496 rows=45 loops=1)                     ->  Index Scan using x_locscenario_pk on t_locscenariomap tc  (cost=0.00..43.04 rows=45 width=22) (actual time=0.028..0.098 rows=45 loops=1)                           Index Cond: (locid = 10::numeric)                     ->  Index Scan using c_scenariocatalog_pk on t_scenariocatalog ts  (cost=0.00..1.22 rows=1 width=7) (actual time=0.006..0.007 rows=1 loops=45)                           Index Cond: (ts.scenarioid = tc.scenarioid)   ->  Hash  (cost=1.17..1.17 rows=17 width=19) (actual time=0.026..0.026 rows=17 loops=1)         Buckets: 1024  Batches: 1  Memory Usage: 1kB         ->  Seq Scan on t_eventstatus tt  (cost=0.00..1.17 rows=17 width=19) (actual time=0.004..0.010 rows=17 loops=1)
On Thu, Oct 17, 2013 at 4:40 PM, Tomas Vondra <tv@fuzzy.cz> wrote:
On 17.10.2013 20:56, akp geek wrote:From depesz? That site works differently - you enter the explain plan
> got the output from depesz and this the top on the system. thanks for
> the help ..
into the form, it does some formatting/highlighting and you're supposed
to submit the link to that page. E.g. http://explain.depesz.com/s/JwTB
is for your query.
However it seems you've done some anonymization on the query, e.g.
replacing the table/index/function names and string literals with some
random words.
Anyway, the plan shows the estimates are reasonably accurate, but the
index scan on romeo_four consumes ~99% of the query duration. Not sure
if it can be improved, because we don't know the original query and the
anonymization made it rather annoying to deal with.Once again, this top output is incomplete - all it lists are postgres
>
> Regards
>
> load averages: 30.3, 28.8, 27.8; up
> 680+00:51:09
> 18:24:44
> 156 processes: 123 sleeping, 33 on cpu
> CPU states: 49.5% idle, 50.0% user, 0.4% kernel, 0.0% iowait, 0.0% swap
> Memory: 64G phys mem, 19G free mem, 63G total swap, 63G free swap
>
> PID USERNAME LWP PRI NICE SIZE RES STATE TIME CPU COMMAND
> 7965 postgres 1 20 0 3178M 3171M cpu/7 78:21 1.58% postgres
> 20638 postgres 1 20 0 3181M 3175M cpu/28 187:01 1.58% postgres
> 22819 postgres 1 30 0 3181M 3175M cpu/33 264:06 1.57% postgres
> 3789 postgres 1 20 0 3183M 3176M cpu/9 626:11 1.57% postgres
> 10375 postgres 1 30 0 3182M 3175M cpu/50 293:55 1.57% postgres
> 27335 postgres 1 30 0 3175M 3169M cpu/29 27:27 1.57% postgres
> 7959 postgres 1 30 0 3178M 3171M cpu/41 104:07 1.57% postgres
> 8156 postgres 1 30 0 3180M 3173M cpu/43 124:18 1.56% postgres
> 20640 postgres 1 0 0 3182M 3176M cpu/58 207:49 1.56% postgres
> 10584 postgres 1 30 0 3179M 3173M cpu/35 76:32 1.56% postgres
> 13984 postgres 1 30 0 3181M 3174M cpu/30 207:04 1.56% postgres
> 3575 postgres 1 20 0 3283M 3261M cpu/19 1:48 1.56% postgres
> 7964 postgres 1 40 0 3177M 3170M cpu/62 82:56 1.56% postgres
> 1299 postgres 1 40 0 3166M 3161M cpu/52 5:11 1.56% postgres
> 27692 postgres 1 0 0 3181M 3174M cpu/46 260:58 1.56% postgres
processes (and it's unclear what they're doing), but there are certainly
some other processes running. Moreover, those 15 processes account for
only ~25% of CPU, but there's almost 50% CPU utilized. So where's the rest?
Tomas