Re: Need some help on Performance 9.0.4
| От | akp geek |
|---|---|
| Тема | Re: Need some help on Performance 9.0.4 |
| Дата | |
| Msg-id | CACnhOf+Wocd5s1X+fkRPL1pyXRPyFrJ-XW0EdccZ82LimGJksQ@mail.gmail.com обсуждение исходный текст |
| Ответ на | Re: Need some help on Performance 9.0.4 (Tomas Vondra <tv@fuzzy.cz>) |
| Список | pgsql-general |
when I issue the top command on solaris, what ever I have posted is exactly getting.
top -n
load averages: 11.4, 10.8, 10.2; up 680+21:31:46 15:05:21
137 processes: 123 sleeping, 14 on cpu
CPU states: 82.0% idle, 17.5% user, 0.5% kernel, 0.0% iowait, 0.0% swap
Memory: 64G phys mem, 20G free mem, 63G total swap, 63G free swap
PID USERNAME LWP PRI NICE SIZE RES STATE TIME CPU COMMAND
12185 postgres 1 50 0 3172M 3165M cpu/0 9:56 1.80% postgres
23338 postgres 1 50 0 3180M 3173M cpu/8 79:08 1.77% postgres
2446 postgres 1 0 0 3174M 3167M cpu/24 0:58 1.76% postgres
18359 postgres 1 0 0 3172M 3164M cpu/46 4:00 1.60% postgres
28428 postgres 1 0 0 3178M 3171M cpu/17 58:15 1.60% postgres
10698 postgres 1 0 0 3179M 3173M cpu/62 68:33 1.55% postgres
28374 postgres 1 0 0 3178M 3172M cpu/14 47:01 1.55% postgres
6145 postgres 1 0 0 3180M 3173M cpu/39 115:05 1.55% postgres
2380 postgres 1 0 0 3179M 3172M cpu/34 53:38 1.54% postgres
2088 postgres 1 0 0 3179M 3172M cpu/31 37:43 1.51% postgres
19360 postgres 1 50 0 3172M 3165M cpu/3 6:55 0.84% postgres
28426 postgres 1 19 0 3179M 3172M cpu/21 70:34 0.61% postgres
21196 postgres 1 52 0 3403M 3392M sleep 0:05 0.37% postgres
21237 root 1 49 0 5632K 4000K cpu/51 0:00 0.11% sshd
415 daemon 6 59 0 6312K 3208K sleep 107:52 0.02% kcfd
this is the plan that was generated again.. Thanks a lot.top -n
load averages: 11.4, 10.8, 10.2; up 680+21:31:46 15:05:21
137 processes: 123 sleeping, 14 on cpu
CPU states: 82.0% idle, 17.5% user, 0.5% kernel, 0.0% iowait, 0.0% swap
Memory: 64G phys mem, 20G free mem, 63G total swap, 63G free swap
PID USERNAME LWP PRI NICE SIZE RES STATE TIME CPU COMMAND
12185 postgres 1 50 0 3172M 3165M cpu/0 9:56 1.80% postgres
23338 postgres 1 50 0 3180M 3173M cpu/8 79:08 1.77% postgres
2446 postgres 1 0 0 3174M 3167M cpu/24 0:58 1.76% postgres
18359 postgres 1 0 0 3172M 3164M cpu/46 4:00 1.60% postgres
28428 postgres 1 0 0 3178M 3171M cpu/17 58:15 1.60% postgres
10698 postgres 1 0 0 3179M 3173M cpu/62 68:33 1.55% postgres
28374 postgres 1 0 0 3178M 3172M cpu/14 47:01 1.55% postgres
6145 postgres 1 0 0 3180M 3173M cpu/39 115:05 1.55% postgres
2380 postgres 1 0 0 3179M 3172M cpu/34 53:38 1.54% postgres
2088 postgres 1 0 0 3179M 3172M cpu/31 37:43 1.51% postgres
19360 postgres 1 50 0 3172M 3165M cpu/3 6:55 0.84% postgres
28426 postgres 1 19 0 3179M 3172M cpu/21 70:34 0.61% postgres
21196 postgres 1 52 0 3403M 3392M sleep 0:05 0.37% postgres
21237 root 1 49 0 5632K 4000K cpu/51 0:00 0.11% sshd
415 daemon 6 59 0 6312K 3208K sleep 107:52 0.02% kcfd
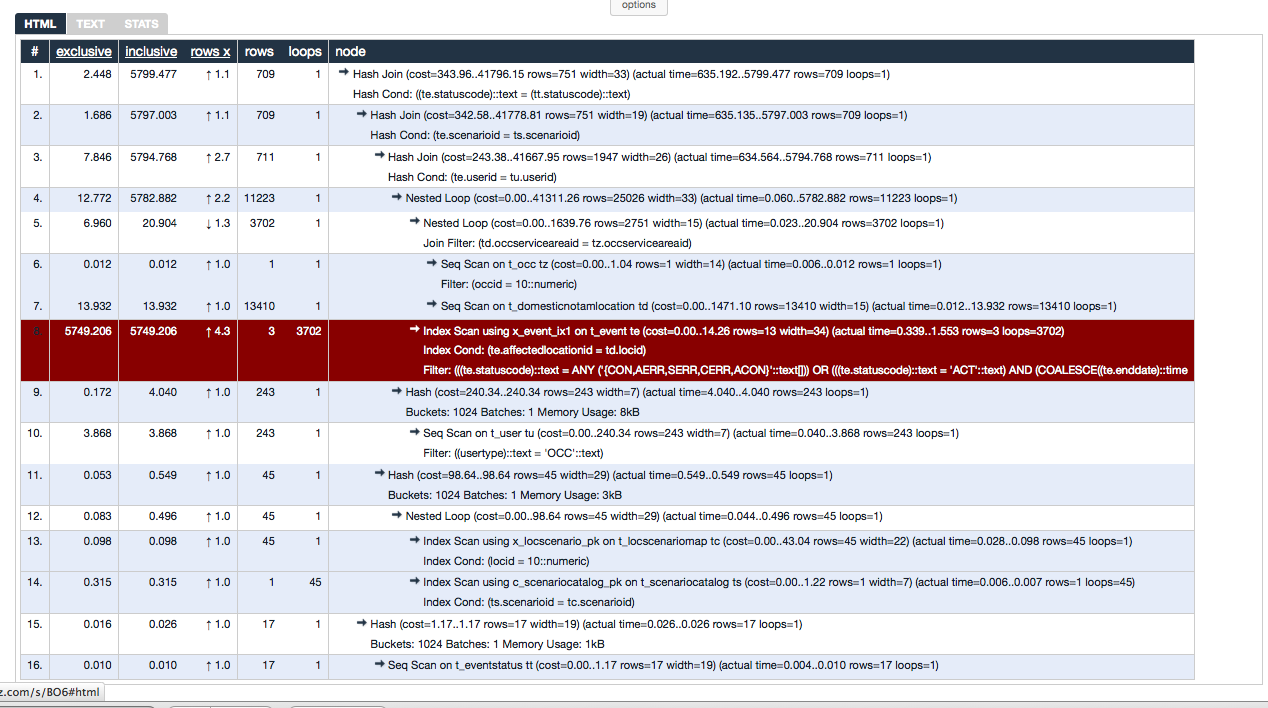
Hash Join  (cost=343.96..41796.15 rows=751 width=33) (actual time=635.192..5799.477 rows=709 loops=1)   Hash Cond: ((te.statuscode)::text = (tt.statuscode)::text)   ->  Hash Join  (cost=342.58..41778.81 rows=751 width=19) (actual time=635.135..5797.003 rows=709 loops=1)         Hash Cond: (te.scenarioid = ts.scenarioid)         ->  Hash Join  (cost=243.38..41667.95 rows=1947 width=26) (actual time=634.564..5794.768 rows=711 loops=1)               Hash Cond: (te.userid = tu.userid)               ->  Nested Loop  (cost=0.00..41311.26 rows=25026 width=33) (actual time=0.060..5782.882 rows=11223 loops=1)                     ->  Nested Loop  (cost=0.00..1639.76 rows=2751 width=15) (actual time=0.023..20.904 rows=3702 loops=1)                           Join Filter: (td.occserviceareaid = tz.occserviceareaid)                           ->  Seq Scan on t_occ tz  (cost=0.00..1.04 rows=1 width=14) (actual time=0.006..0.012 rows=1 loops=1)                                 Filter: (occid = 10::numeric)                           ->  Seq Scan on t_domesticnotamlocation td  (cost=0.00..1471.10 rows=13410 width=15) (actual time=0.012..13.932 rows=13410 loops=1)                     ->  Index Scan using x_event_ix1 on t_event te  (cost=0.00..14.26 rows=13 width=34) (actual time=0.339..1.553 rows=3 loops=3702)                           Index Cond: (te.affectedlocationid = td.locid)                           Filter: (((te.statuscode)::text = ANY ('{CON,AERR,SERR,CERR,ACON}'::text[])) OR (((te.statuscode)::text = 'ACT'::text) AND (COALESCE((te.enddate)::time
stamp with time zone, now()) >= (now() - '2 days'::interval))) OR (((te.statuscode)::text = 'CAN'::text) AND (te.canceldate >= (now() - '2 days'::interval))) OR (((te.statuscode)
::text = ANY ('{APEN,CINP,AINP}'::text[])) AND (COALESCE((te.enddate)::timestamp with time zone, now()) >= now())))               ->  Hash  (cost=240.34..240.34 rows=243 width=7) (actual time=4.040..4.040 rows=243 loops=1)                     Buckets: 1024  Batches: 1  Memory Usage: 8kB                     ->  Seq Scan on t_user tu  (cost=0.00..240.34 rows=243 width=7) (actual time=0.040..3.868 rows=243 loops=1)                           Filter: ((usertype)::text = 'OCC'::text)         ->  Hash  (cost=98.64..98.64 rows=45 width=29) (actual time=0.549..0.549 rows=45 loops=1)               Buckets: 1024  Batches: 1  Memory Usage: 3kB               ->  Nested Loop  (cost=0.00..98.64 rows=45 width=29) (actual time=0.044..0.496 rows=45 loops=1)                     ->  Index Scan using x_locscenario_pk on t_locscenariomap tc  (cost=0.00..43.04 rows=45 width=22) (actual time=0.028..0.098 rows=45 loops=1)                           Index Cond: (locid = 10::numeric)                     ->  Index Scan using c_scenariocatalog_pk on t_scenariocatalog ts  (cost=0.00..1.22 rows=1 width=7) (actual time=0.006..0.007 rows=1 loops=45)                           Index Cond: (ts.scenarioid = tc.scenarioid)   ->  Hash  (cost=1.17..1.17 rows=17 width=19) (actual time=0.026..0.026 rows=17 loops=1)         Buckets: 1024  Batches: 1  Memory Usage: 1kB         ->  Seq Scan on t_eventstatus tt  (cost=0.00..1.17 rows=17 width=19) (actual time=0.004..0.010 rows=17 loops=1)
On Thu, Oct 17, 2013 at 4:40 PM, Tomas Vondra <tv@fuzzy.cz> wrote:
On 17.10.2013 20:56, akp geek wrote:From depesz? That site works differently - you enter the explain plan
> got the output from depesz and this the top on the system. thanks for
> the help ..
into the form, it does some formatting/highlighting and you're supposed
to submit the link to that page. E.g. http://explain.depesz.com/s/JwTB
is for your query.
However it seems you've done some anonymization on the query, e.g.
replacing the table/index/function names and string literals with some
random words.
Anyway, the plan shows the estimates are reasonably accurate, but the
index scan on romeo_four consumes ~99% of the query duration. Not sure
if it can be improved, because we don't know the original query and the
anonymization made it rather annoying to deal with.Once again, this top output is incomplete - all it lists are postgres
>
> Regards
>
> load averages: 30.3, 28.8, 27.8; up
> 680+00:51:09
> 18:24:44
> 156 processes: 123 sleeping, 33 on cpu
> CPU states: 49.5% idle, 50.0% user, 0.4% kernel, 0.0% iowait, 0.0% swap
> Memory: 64G phys mem, 19G free mem, 63G total swap, 63G free swap
>
> PID USERNAME LWP PRI NICE SIZE RES STATE TIME CPU COMMAND
> 7965 postgres 1 20 0 3178M 3171M cpu/7 78:21 1.58% postgres
> 20638 postgres 1 20 0 3181M 3175M cpu/28 187:01 1.58% postgres
> 22819 postgres 1 30 0 3181M 3175M cpu/33 264:06 1.57% postgres
> 3789 postgres 1 20 0 3183M 3176M cpu/9 626:11 1.57% postgres
> 10375 postgres 1 30 0 3182M 3175M cpu/50 293:55 1.57% postgres
> 27335 postgres 1 30 0 3175M 3169M cpu/29 27:27 1.57% postgres
> 7959 postgres 1 30 0 3178M 3171M cpu/41 104:07 1.57% postgres
> 8156 postgres 1 30 0 3180M 3173M cpu/43 124:18 1.56% postgres
> 20640 postgres 1 0 0 3182M 3176M cpu/58 207:49 1.56% postgres
> 10584 postgres 1 30 0 3179M 3173M cpu/35 76:32 1.56% postgres
> 13984 postgres 1 30 0 3181M 3174M cpu/30 207:04 1.56% postgres
> 3575 postgres 1 20 0 3283M 3261M cpu/19 1:48 1.56% postgres
> 7964 postgres 1 40 0 3177M 3170M cpu/62 82:56 1.56% postgres
> 1299 postgres 1 40 0 3166M 3161M cpu/52 5:11 1.56% postgres
> 27692 postgres 1 0 0 3181M 3174M cpu/46 260:58 1.56% postgres
processes (and it's unclear what they're doing), but there are certainly
some other processes running. Moreover, those 15 processes account for
only ~25% of CPU, but there's almost 50% CPU utilized. So where's the rest?
Tomas
Вложения
В списке pgsql-general по дате отправления: