Обсуждение: Graphic to visualize data flow between processes, buffers and files
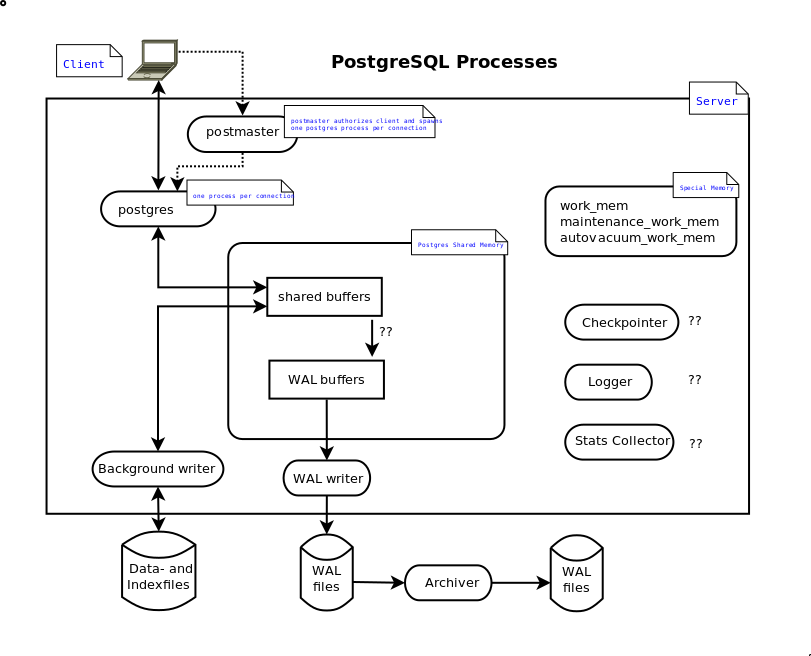
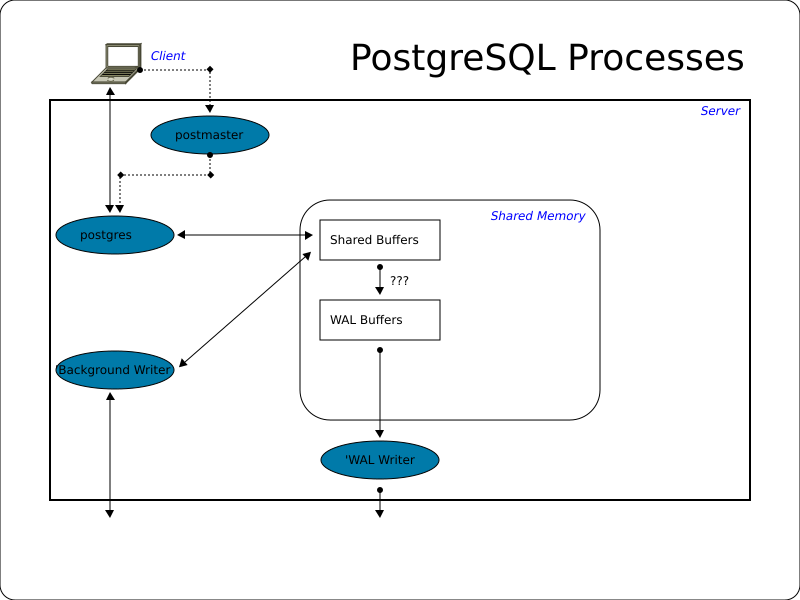
Hi,

I wonder whether we should have a graphic showing an overview of the
main backend processes and their interaction with memory and files -
something like figure 15-1 of:
https://docs.oracle.com/database/121/CNCPT/process.htm. Or is there a
general policy to avoid graphics in our documentation - or an advice to
use a special format for graphics?

I append a very first draft, which reflects my rudimentary knowledge
about the topic.

Regards

Jürgen Purtz
Вложения
=?UTF-8?Q?J=c3=bcrgen_Purtz?= <juergen@purtz.de> writes:
> I wonder whether we should have a graphic showing an overview of the
> main backend processes and their interaction with memory and files -
> something like figure 15-1 of:
> https://docs.oracle.com/database/121/CNCPT/process.htm. Or is there a
> general policy to avoid graphics in our documentation - or an advice to
> use a special format for graphics?

There have been discussions about how to incorporate graphics, which
have failed to come to any consensus.  Nobody is particularly willing
to put a badly-formatted batch of raw numbers into git though, because
it'd be impossible to do any incremental updates on it and still have
useful git history.  There are also a bunch of questions about whether
the graphics would work in all the output formats we try to support.

This particular example doesn't really seem compelling enough to
justify finding a way over those hurdles ...

            regards, tom lane
On 04.01.2016 16:46, Tom Lane wrote:
There have been discussions about how to incorporate graphics, which
have failed to come to any consensus.  Nobody is particularly willing
to put a badly-formatted batch of raw numbers into git though, because
it'd be impossible to do any incremental updates on it and still have
useful git history.  There are also a bunch of questions about whether
the graphics would work in all the output formats we try to support.

This particular example doesn't really seem compelling enough to
justify finding a way over those hurdles ...
In 2010/11 we had a discussion about SVG editors and SVG cleaner tools: http://www.postgresql.org/message-id/flat/201006302218.o5UMI7Y20379@momjian.us#201006302218.o5UMI7Y20379@momjian.us. 5 years later we should take a second chance to bring graphics to the documentation.
After some research I propose a collection of rules and hope that they will fulfill our needs. Please proof and extend the below-mentioned steps to a useful cookbook.
Principles:
- Use the tool (text editor, xml-editor, svg-editor) and SVG-cleaner of your choice.
- Produce pure standard compliant (xmlns:svg="http://www.w3.org/2000/svg") SVG text files without any additional XML-namespace.
Recommendations:
- We suggest the use of Inkscape. It creates the above mentioned format by performing the following steps
- File | Clean up document
- File | Save as | Plain SVG
- If you insist to use complex objects like connectors we suggest the use of Inkscape's SVG format for your working file and the two steps mentioned above to create the destination file. In the destination file complex objects are fragmented into simple objects but they are rendered in the same way as before.
- You can copy complex objects like UML shapes from any SVG tool to Inkscape by performing the following steps
- Create the object with the tool of your choice in an temporary file
- Export the graphic to SVG or Plain SVG format
- Open this SVG file in Inkscape
- Copy / Past the object to your working file
- If necessary group the fragments of the new object to one object
- Create the object with the tool of your choice in an temporary file
- Although other SVG editors support 'Plain SVG' format via their export-command as well as Inkscape, the results of Inkscape's approach seams to be nearly optimal.
- Nevertheless Inkscape's output in 'Plain SVG' format is not optimal. There are some superfluous objects which can be ignored or removed with a text editor:
- Within <metadata> the descriptions use the namespaces rdf, cc and dc instead of svg's elements.
- Within the style attribute sometimes there are '-inkscape-font-specification' instructions. They are redundant as they have the same contents as the also present and standard conform font-style instructions (Inkscape bug?).
- Some objects imported from other SVN tools fills the attribute 'class' with values like "com.sun.star.drawing.xxx". Test such objects and/or remove the values.
- Within <metadata> the descriptions use the namespaces rdf, cc and dc instead of svg's elements.
- Don't use "Objects | Symbols" as it creates an additional namespace 'xlink'.
- If you create a PNG file (File | Export PNG Image), you should previously set the background color of the image (File | Document Properties) to RGB ffffffff or any color of your choice. Otherwise some PNG viewer shows an odd background.
Advantages:
- Files in plain SVG format are text files and therefore diff-able. As they are also XML-files, it is a good idea to use an xml-diff tool (better granularity, ignoring of newlines and other white spaces, ignoring the different syntax for empty tags, ignoring xml-attribute sequence, ...).
- As fare as I have seen the plain SVG as well as the PNG leads to identical rendering in different viewers.
- Inkscape is able to produce PDF files out of its plain SVG files - as well as a lot of other tools.
- Inkscape offers a window where you can control (and partly modify) the xml representation of an object.
Disadvantages:
- There is no guaranty that the resulting plain SVG file will be rendered by every other SVG tool in the same way as it is done in Inkscape. In my opinion this is a failure of SVG tools - they have a different understanding of some SVG elements. Hopefully SVG 2 will bring some progress (in the far future).
- The proceeding is very time consumptive in comparison to the use of the sophisticated features of a single product.
Regards, Jürgen Purtz
Вложения
Jürgen Purtz wrote:

> Recommendations:
>
>  * We suggest the use of Inkscape. It creates the above mentioned
>    format by performing the following steps
>      o File | Clean up document
>      o File | Save as | Plain SVG

As in the original discussion, this is probably too fiddly and the
resulting SVG files are going to be really ugly anyway.  I think the
consensus was that we should use some toolchain that uses a source
format that looks like actual source code, such as the dot or xfig
formats, of stuff like that -- which is "compiled" into the target
graphic format.

As I recall, what we lacked was somebody with time and knowledge to
actually produce a useful image starting from such a source, produce
Makefile rules to run the transformation from the Makefiles, and to
inject the image into the SGML so that it works in the HTML and PDF
outputs.  With such a proof of concept we're much more likely to take
this idea seriously.

--
Álvaro Herrera                http://www.2ndQuadrant.com/
PostgreSQL Development, 24x7 Support, Remote DBA, Training & Services
On 05.01.2016 20:33, Alvaro Herrera wrote:
As in the original discussion, this is probably too fiddly and the resulting SVG files are going to be really ugly anyway. I think the consensus was that we should use some toolchain that uses a source format that looks like actual source code, such as the dot or xfig formats, of stuff like that -- which is "compiled" into the target graphic format. As I recall, what we lacked was somebody with time and knowledge to actually produce a useful image starting from such a source, produce Makefile rules to run the transformation from the Makefiles, and to inject the image into the SGML so that it works in the HTML and PDF outputs. With such a proof of concept we're much more likely to take this idea seriously.
I don't want to be intrusive, but obviously I didn't get the point at the first attempt. I hope that I now have understood the needs and concerns of the community: you are looking for tools and a source code format for SVN files which is easy to handle, diff-able and convertible into different graphic formats.
To achieve these objectives I composed a suite of tools and templates:
- The SVN file is edited with a text editor. This sounds a little crazy, as SVN editors are trendy and easy to handle. But in conjunction with a set of templates this job gets relative easy. Of course the developer needs some knowledge about SVN, but it is intended that only few and simple elements of SVN are used to keep the source clear. After a short period of familiarization and with a look at existing files everyone can work this way. Also the range of lines keeps small as there are predefined complex objects which can be included with one line of code.
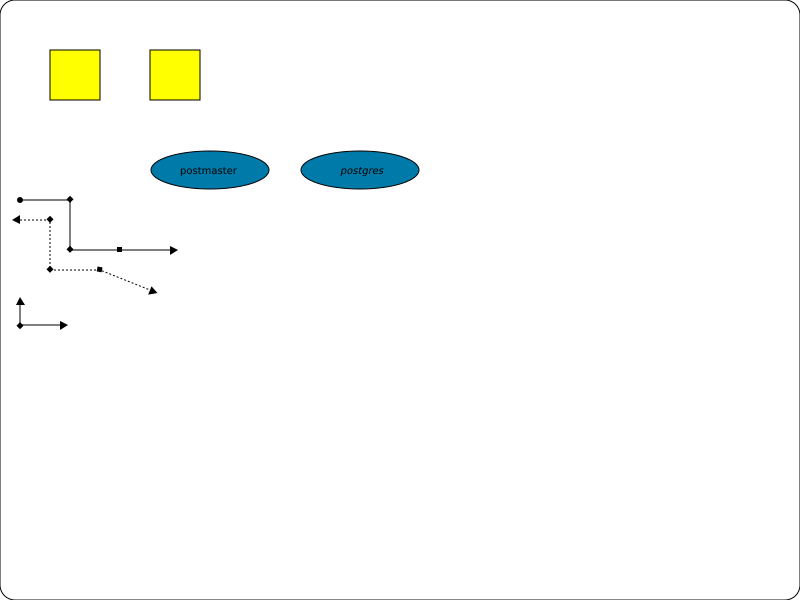
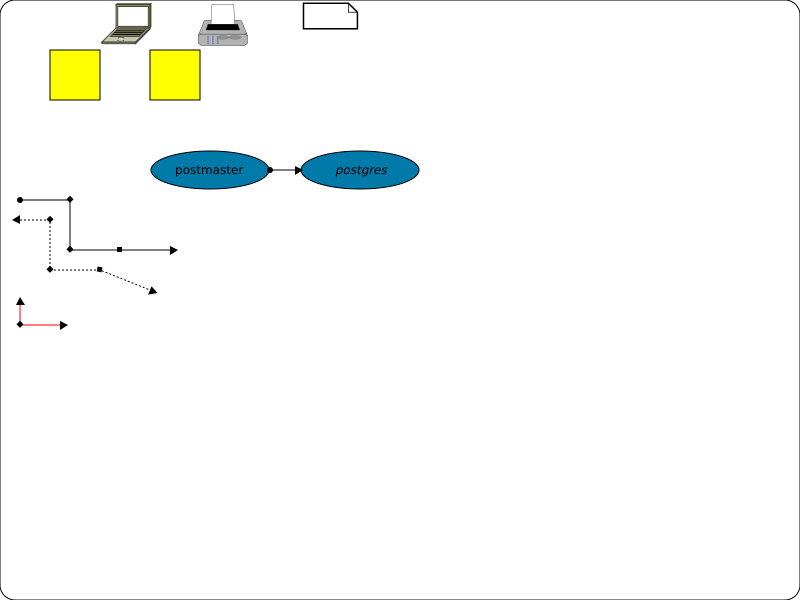
- Actually there are three files with predefined SVN objects and CSS definitions. This facilitates the work and leads to consistent use of graphic elements like fonts, colors, sizes. One file contains simple objects like text or ellipses with predefined attributes, the next one contains complex pictures like PCs, and the last one contains all CSS stuff.
- As fare as I have seen, the SVN files are rendered consistently by browsers and image viewers. Using Inkscape in batch-mode they can be converted to pdf, png and other formats without loss of elements or significant image sharpness.
- Using xmlling the SVN files can be validated against the SVN DTD.
- In the readme file there are examples of converting and XML validation.
- There is the problem, that Inscape does not consider external CSS files. I described a workaround in the CSS file.
Regards, Jürgen Purtz
Вложения
Hello,
I think, that SVG should be preferred format too, as it (beside other forementioned advantages):
1) Supported by DocBook (http://www.docbook.org/tdg/en/html/svg-svg.html) and you can just embed an image in the docbook.xml (http://www.docbook.org/tdg5/publishers/5.1b3/en/html/_any.svg.html).
2) xml-based so it can be translated to other languages with using well-known tools (xml2po/gettext)
I've tried to embed a sample SVG image into postgres.xml and generate PDF with xsltproc/fop and I've got the image in the PDF.
So we don't need to introduce some complex processes to support graphics, it's already supported by docbook.
I think we should move documentation to the XML format and then we could use SVG for free.
Best regards,
Alexander
08.01.2016 23:52, Jürgen Purtz пишет:
On 05.01.2016 20:33, Alvaro Herrera wrote:As in the original discussion, this is probably too fiddly and the resulting SVG files are going to be really ugly anyway. I think the consensus was that we should use some toolchain that uses a source format that looks like actual source code, such as the dot or xfig formats, of stuff like that -- which is "compiled" into the target graphic format. As I recall, what we lacked was somebody with time and knowledge to actually produce a useful image starting from such a source, produce Makefile rules to run the transformation from the Makefiles, and to inject the image into the SGML so that it works in the HTML and PDF outputs. With such a proof of concept we're much more likely to take this idea seriously.
I don't want to be intrusive, but obviously I didn't get the point at the first attempt. I hope that I now have understood the needs and concerns of the community: you are looking for tools and a source code format for SVN files which is easy to handle, diff-able and convertible into different graphic formats.
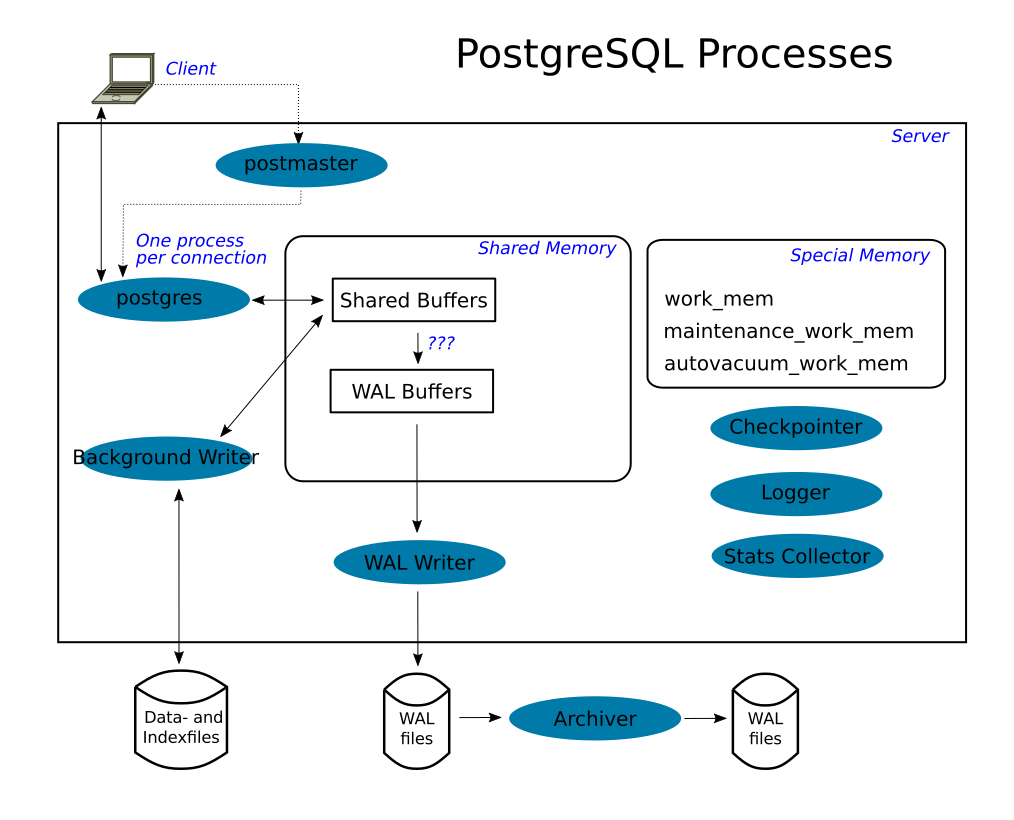
To achieve these objectives I composed a suite of tools and templates:Please study the attached three example files: simple.svn, simple_with_external_file.svn and pg_processes.svn. The last two make use of pg_lib_basic_objects.svn, pg_lib_external_objects.svn and pg_lib_css.svn.
- The SVN file is edited with a text editor. This sounds a little crazy, as SVN editors are trendy and easy to handle. But in conjunction with a set of templates this job gets relative easy. Of course the developer needs some knowledge about SVN, but it is intended that only few and simple elements of SVN are used to keep the source clear. After a short period of familiarization and with a look at existing files everyone can work this way. Also the range of lines keeps small as there are predefined complex objects which can be included with one line of code.
- Actually there are three files with predefined SVN objects and CSS definitions. This facilitates the work and leads to consistent use of graphic elements like fonts, colors, sizes. One file contains simple objects like text or ellipses with predefined attributes, the next one contains complex pictures like PCs, and the last one contains all CSS stuff.
- As fare as I have seen, the SVN files are rendered consistently by browsers and image viewers. Using Inkscape in batch-mode they can be converted to pdf, png and other formats without loss of elements or significant image sharpness.
- Using xmlling the SVN files can be validated against the SVN DTD.
- In the readme file there are examples of converting and XML validation.
- There is the problem, that Inscape does not consider external CSS files. I described a workaround in the CSS file.
Regards, Jürgen Purtz