Hi,
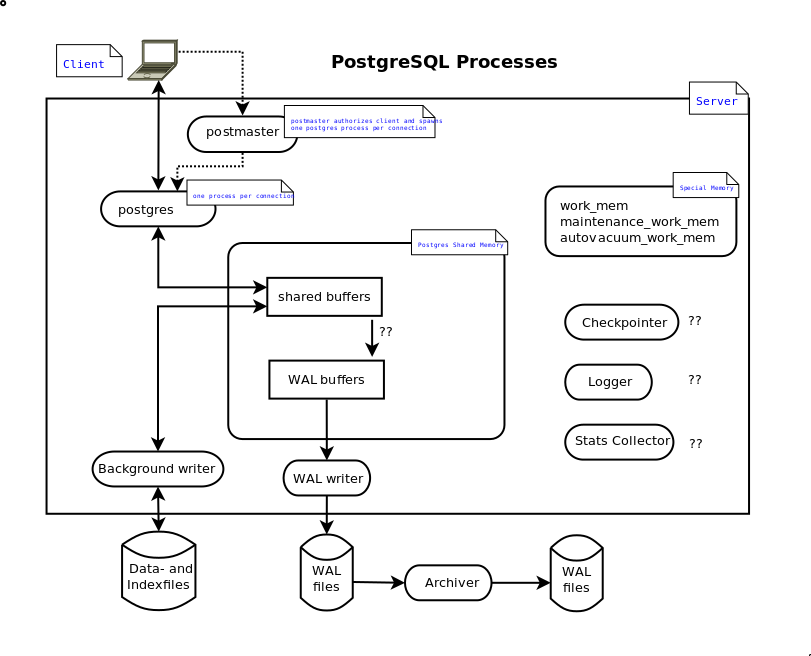
I wonder whether we should have a graphic showing an overview of the
main backend processes and their interaction with memory and files -
something like figure 15-1 of:
https://docs.oracle.com/database/121/CNCPT/process.htm. Or is there a
general policy to avoid graphics in our documentation - or an advice to
use a special format for graphics?
I append a very first draft, which reflects my rudimentary knowledge
about the topic.
Regards
Jürgen Purtz
Сайт использует файлы cookie для корректной работы и повышения удобства. Нажимая кнопку «Принять» или продолжая пользоваться сайтом, вы соглашаетесь на их использование в соответствии с Политикой в отношении обработки cookie ООО «ППГ», в том числе на передачу данных из файлов cookie сторонним статистическим и рекламным службам. Вы можете управлять настройками cookie через параметры вашего браузера