Re: what to revert
| От | Tomas Vondra |
|---|---|
| Тема | Re: what to revert |
| Дата | |
| Msg-id | e17a7535-09b8-2273-0f7c-2d368390b0ed@2ndquadrant.com обсуждение исходный текст |
| Ответ на | Re: what to revert (Tomas Vondra <tomas.vondra@2ndquadrant.com>) |
| Ответы |
Re: what to revert
(Kevin Grittner <kgrittn@gmail.com>)
|
| Список | pgsql-hackers |
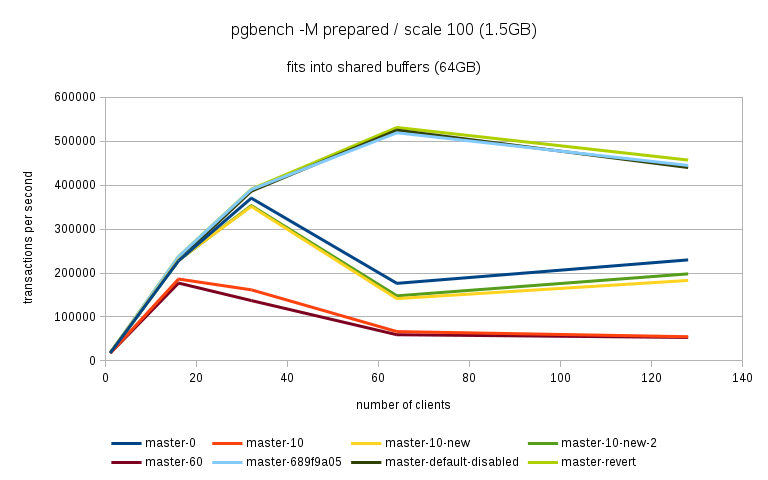
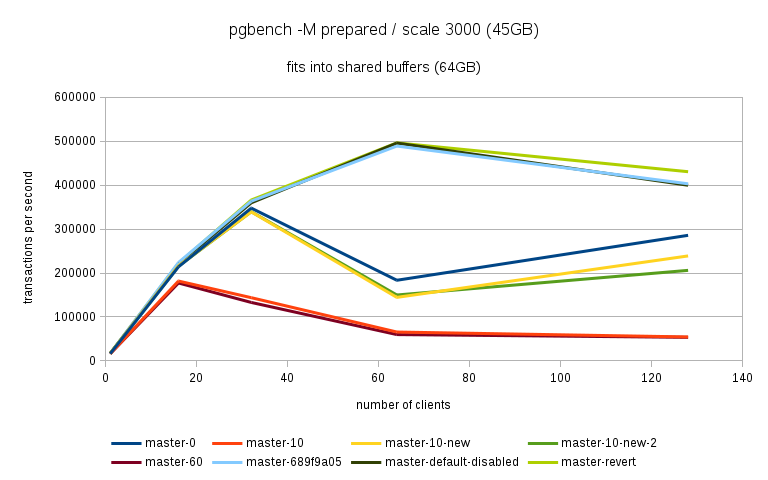
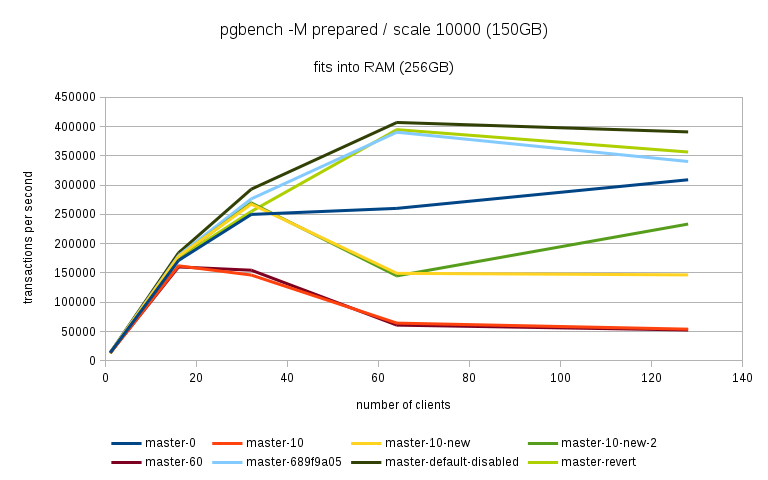
Hi,

Over the past few days I've been running benchmarks on a fairly large
NUMA box (4 sockets, 32 cores / 64 with HR, 256GB of RAM) to see the
impact of the 'snapshot too old' - both when disabled and enabled with
various values in the old_snapshot_threshold GUC.

The full results are available here:

   https://drive.google.com/folderview?id=0BzigUP2Fn0XbR1dyOFA3dUxRaUU

but let me explain how the benchmark was done and present a brief
summary of the results as I understand them.

The benchmark is a simple read-only pgbench with prepared statements,
i.e. doing something like this:

    pgbench -S -M prepared -j N -c N

This was done on three datasets with different scales - small (100),
medium (3000) and large (10000). All of this fits into RAM, the two
smaller data sets fit into shared_buffers.

For each scale, the benchmark was run for 1, 16, 32, 64 and 128 clients,
5 runs for each client count, 5 minutes each. But only after a 2-hour
warmup with 128 clients.

So essentially something like this:

     for s in 100 3000 10000; do

         ... init + warmup

         for r in 1 2 3 4 5; do
             for c in 1 16 32 64 128; do

                 pgbench -S -M prepared ...

             done
         done
     done

The full results are available in the .tgz archive (as produced by
run.sh included in it). The old_snap.csv contains just the extracted
results, and there's also an ODS with some charts.

The initial set of test was run on 4bbc1a7e which was the last commit in
master when the benchmark was started. Then I've tested with 689f9a05
which is the last commit before the 'snapshot too old' got introduced,
and 91fd1df4 which is the current master, including a commit that should
improve performance in some cases.

So in total there are data for these combinations

master-0 - 4bbc1a7e + old_snapshot_threshold=0
master-10 - 4bbc1a7e + old_snapshot_threshold=10
master-10-new - 91fd1df4 + old_snapshot_threshold=10
master-10-new-2 - 91fd1df4 + old_snapshot_threshold=10 (rerun)
master-60 - 4bbc1a7e + old_snapshot_threshold=60
master-689f9a05 - before the feature was added
master-default-disabled - 4bbc1a7e + old_snapshot_threshold=-1
master-revert - 4bbc1a7e + revert.patch (reverts the feature)


The results (average of the 5 runs) look like this (also see the charts
attached to this post):

     scale=100
     ---------

     dataset              1       16       32       64      128
     master-0         18118   227615   370336   176435   229796
     master-10        17741   186197   161655    66681    54977
     master-10-new    18572   229685   351378   141624   183029
     master-10-new-2  18366   228256   353420   148061   197953
     master-60        17691   177053   137311    59508    53325
     master-689f9a05  18630   237123   389782   519069   444732
     master-disabled  17727   230818   386112   524981   440043
     master-revert    18584   237383   390779   531075   457005

     scale=3000
     ----------

     dataset              1       16       32       64      128
     master-0         16480   214081   347689   183451   285729
     master-10        16390   181683   143847    65614    54499
     master-10-new    16821   216562   339106   144488   238851
     master-10-new-2  17121   215423   339424   149910   206001
     master-60        16372   177228   133013    59861    53599
     master-689f9a05  16945   223894   363393   488892   402938
     master-disabled  16635   220064   359686   495642   399728
     master-revert    16963   221884   366086   496107   430518

     scale=10000
     -----------

     dataset              1       16       32       64      128
     master-0         13954   171378   249923   260291   309065
     master-10        13513   162214   146458    64457    54159
     master-10-new    13776   178255   267475   149335   146706
     master-10-new-2  13188   176799   269629   145049   233515
     master-60        14102   160247   154704    61015    52711
     master-689f9a05  13896   179688   276487   390220   340206
     master-disabled  13939   184222   293032   406846   390739
     master-revert    12971   174562   254986   394569   356436


A few initial observations:

* The results are a bit noisy, but I think in general this shows that
for certain cases there's a clearly measurable difference (up to 5%)
between the "disabled" and "reverted" cases. This is particularly
visible on the smallest data set.

* What's fairly strange is that on the largest dataset (scale 10000),
the "disabled" case is actually consistently faster than "reverted" -
that seems a bit suspicious, I think. It's possible that I did the
revert wrong, though - the revert.patch is included in the tgz. This is
why I also tested 689f9a05, but that's also slower than "disabled".

* The performance impact with the feature enabled seems rather
significant, especially once you exceed the number of physical cores (32
in this case). Then the drop is pretty clear - often ~50% or more.

* 7e3da1c4 claims to bring the performance within 5% of the disabled
case, but that seems not to be the case. What it however does is
bringing the 'non-immediate' cases close to the immediate ones (before
the performance drop came much sooner in these cases - at 16 clients).

* It's also seems to me the feature greatly amplifies the variability of
the results, somehow. It's not uncommon to see results like this:

  master-10-new-2    235516     331976    133316    155563    133396

where after the first runs (already fairly variable) the performance
tanks to ~50%. This happens particularly with higher client counts,
otherwise the max-min is within ~5% of the max. There are a few cases
where this happens without the feature (i.e. old master, reverted or
disabled), but it's usually much smaller than with it enabled
(immediate, 10 or 60). See the 'summary' sheet in the ODS spreadsheet.

I don't know what's the problem here - at first I thought that maybe
something else was running on the machine, or that anti-wraparound
autovacuum kicked in, but that seems not to be the case. There's nothing
like that in the postgres log (also included in the .tgz).

And the shell script interleaves runs for different client counts, so
another process running on the system would affect the surrounding runs
too (but that's not the case).


regards

--
Tomas Vondra                  http://www.2ndQuadrant.com
PostgreSQL Development, 24x7 Support, Remote DBA, Training & Services
Вложения
В списке pgsql-hackers по дате отправления: