Обсуждение: Logical Replica ReorderBuffer Size Accounting Issues
Hi,
We've noticed an odd memory issue with walsenders for logical replication slots - They experience large spikes in memory usage up to ~10x over the baseline from ~500MiB to ~5GiB, exceeding the configured logical_decoding_work_mem. Since we have ~40 active subscriptions this produces a spike of ~200GiB on the sender, which is quite worrying.
The spikes in memory always slowly ramp up to ~5GB over ~10 minutes, then quickly drop back down to the ~500MB baseline.
logical_decoding_work_mem is configured to 256MB, and streaming is configured on the subscription side, so I would expect the slots to either stream to spill bytes to disk when they get to the 256MB limit, and not get close to 5GiB. However pg_stat_replication_slots shows 0 spilled or streamed bytes for any slots.
I used GDB to call MemoryContextStats on a walsender process with 5GB usage, which logged this large reorderbuffer context:
--- snip ---
ReorderBuffer: 65536 total in 4 blocks; 64624 free (169 chunks); 912 used ReorderBufferByXid: 32768 total in 3 blocks; 12600 free (6 chunks); 20168 used Tuples: 4311744512 total in 514 blocks (12858943 chunks); 6771224 free (12855411 chunks); 4304973288 used TXN: 16944 total in 2 blocks; 13984 free (46 chunks); 2960 used Change: 574944 total in 70 blocks; 214944 free (2239 chunks); 360000 used--- snip ---
It's my understanding that the reorder buffer context is the thing that logical_decoding_work_mem specifically constraints, so it's surprising to see that it's holding onto ~4GB of tuples instead of spooling them. I found the code for that here: https://github.com/postgres/postgres/blob/eb5ad4ff05fd382ac98cab60b82f7fd6ce4cfeb8/src/backend/replication/logical/reorderbuffer.c#L3557 which suggests it's checking rb->size against the configured work_mem.
I then used GDB to break into a high memory walsender and grab rb->size, which was only 73944. So it looks like the tuple memory isn't being properly accounted for in the total reorderbuffer size, so nothing is getting streamed/spooled?
Not super familiar with this so please let me know if there's something I've missed, otherwise it seems like the reorder buffer size accounting is a bit wrong.
Thanks,
- Alex.
On Thu, Jan 5, 2023 at 5:27 PM Alex Richman <alexrichman@onesignal.com> wrote:
>
> We've noticed an odd memory issue with walsenders for logical replication slots - They experience large spikes in
memoryusage up to ~10x over the baseline from ~500MiB to ~5GiB, exceeding the configured logical_decoding_work_mem.
Sincewe have ~40 active subscriptions this produces a spike of ~200GiB on the sender, which is quite worrying.
>
> The spikes in memory always slowly ramp up to ~5GB over ~10 minutes, then quickly drop back down to the ~500MB
baseline.
>
> logical_decoding_work_mem is configured to 256MB, and streaming is configured on the subscription side, so I would
expectthe slots to either stream to spill bytes to disk when they get to the 256MB limit, and not get close to 5GiB.
Howeverpg_stat_replication_slots shows 0 spilled or streamed bytes for any slots.
>
>
> I used GDB to call MemoryContextStats on a walsender process with 5GB usage, which logged this large reorderbuffer
context:
> --- snip ---
>         ReorderBuffer: 65536 total in 4 blocks; 64624 free (169 chunks); 912 used
>           ReorderBufferByXid: 32768 total in 3 blocks; 12600 free (6 chunks); 20168 used
>           Tuples: 4311744512 total in 514 blocks (12858943 chunks); 6771224 free (12855411 chunks); 4304973288 used
>           TXN: 16944 total in 2 blocks; 13984 free (46 chunks); 2960 used
>           Change: 574944 total in 70 blocks; 214944 free (2239 chunks); 360000 used
> --- snip ---
>
>
> It's my understanding that the reorder buffer context is the thing that logical_decoding_work_mem specifically
constraints,so it's surprising to see that it's holding onto ~4GB of tuples instead of spooling them.  I found the code
forthat here:
https://github.com/postgres/postgres/blob/eb5ad4ff05fd382ac98cab60b82f7fd6ce4cfeb8/src/backend/replication/logical/reorderbuffer.c#L3557
whichsuggests it's checking rb->size against the configured work_mem.
>
> I then used GDB to break into a high memory walsender and grab rb->size, which was only 73944.  So it looks like the
tuplememory isn't being properly accounted for in the total reorderbuffer size, so nothing is getting streamed/spooled?
>

One possible reason for this difference is that the memory allocated
to decode the tuple from WAL in the function
ReorderBufferGetTupleBuf() is different from the actual memory
required/accounted for the tuple in the function
ReorderBufferChangeSize(). Do you have any sample data to confirm
this? If you can't share sample data, can you let us know the average
tuple size?

--
With Regards,
Amit Kapila.
Do you have any sample data to confirm
this? If you can't share sample data, can you let us know the average
tuple size?
I suspect the writes are updates to jsonb columns. I can correlate bursts of writes of this form to the memory spikes:
UPDATE suspect_table
UPDATE suspect_table
SET jsonb_column = jsonb_column || $1,
updated_at = $2
WHERE ...
The update being added in $1 is typically a single new field. The jsonb column is flat string key/value pairs, e.g. lots of {"key": "value", ...}.
The average size of the whole tuple in the suspect table is ~800 bytes (based on 10000 random samples), of which the jsonb column is 80%.
I have been trying to break into a walsender to inspect some tuple bufs directly and compare the ChangeSize vs GetTupleBuf size as you suggest, but it's proving a little tricky - I'll let you know if I have any luck here.
Thanks,
- Alex.
On Sat, Jan 7, 2023 at 0:36 AM Alex Richman <alexrichman@onesignal.com> wrote:
> > Do you have any sample data to confirm
> > this? If you can't share sample data, can you let us know the average
> > tuple size?
>
> I suspect the writes are updates to jsonb columns.  I can correlate bursts of
> writes of this form to the memory spikes:
> UPDATE suspect_table
>   SET jsonb_column = jsonb_column || $1,
>          updated_at = $2
>   WHERE ...
> The update being added in $1 is typically a single new field.  The jsonb column is
> flat string key/value pairs, e.g. lots of {"key": "value", ...}.
>
> The average size of the whole tuple in the suspect table is ~800 bytes (based on
> 10000 random samples), of which the jsonb column is 80%.
>
> I have been trying to break into a walsender to inspect some tuple bufs directly
> and compare the ChangeSize vs GetTupleBuf size as you suggest, but it's proving
> a little tricky - I'll let you know if I have any luck here.

Hi,
Thanks for your report and Amit's analysis.

I tried to do some research with gdb. And I think the adjustment of the
parameter 'size' in the function GenerationAlloc() can cause the requested
memory to become larger for each change.
I tried to reproduce the problem with the table structure you mentioned, but
rb->size didn't get close to 5GB after setting 256MB limit.

I think that with the same logical_decoding_work_mem, the more the number of
changes, the more extra space will be allocated due to the adjustment in the
function GenerationAlloc(). So I resized my test tuple (reduce the tuple size),
and rb->size just exceeded the configured logical_decoding_work_mem a bit. (For
every additional 1MB configured, the additional 40+KB space will be allocated.)

I'm not sure if there is a problem with my reproduction approach, could you
please help to confirm? Here is my test details:
[Table info]
create table tab(a jsonb, b text, c int);
[Tuple info]
I use the pg_column_size() to select specific data.
The size of column 'a' in my test tuple is 27 bytes. (Before resizing it's 620 bytes.)
The size of column 'b' is 5 byte. (Before resizing it's 164 bytes.)
[Reproduce SQL]
UPDATE tab SET a = (a || '{"key0":"values0"}'), c = c*3 WHERE mod(c,2) = 1;

If you have a successfully reproduced use case, could you please provide more
detailed reproduction steps if possible?

Regards,
Wang Wei
Hi,
I have also been poking around with gdb, looking at ReorderBufferGetTupleBuf and ReorderBufferChangeSize. There's certainly a difference in how they calculate the size, but they only differ by a handful of bytes so I don't understand where the 2 orders of magnitude difference between the Tuples memory context and rb->size is coming from.
I am setting up a test environment to try and replicate this outside of prod. One oddity I can note already is that when I set up a logical replica chained off the current logical replica (primary -> LR 1 -> LR 2), the primary shows the memory spikes but the middle replica (LR 1) does not.
Thanks,
- Alex.
On Sat, Jan 7, 2023 at 0:36 AM Alex Richman <alexrichman@onesignal.com> wrote:
> > Do you have any sample data to confirm
> > this? If you can't share sample data, can you let us know the average
> > tuple size?
>
> I suspect the writes are updates to jsonb columns. I can correlate bursts of
> writes of this form to the memory spikes:
> UPDATE suspect_table
> SET jsonb_column = jsonb_column || $1,
> updated_at = $2
> WHERE ...
> The update being added in $1 is typically a single new field. The jsonb column is
> flat string key/value pairs, e.g. lots of {"key": "value", ...}.
>
> The average size of the whole tuple in the suspect table is ~800 bytes (based on
> 10000 random samples), of which the jsonb column is 80%.
>
> I have been trying to break into a walsender to inspect some tuple bufs directly
> and compare the ChangeSize vs GetTupleBuf size as you suggest, but it's proving
> a little tricky - I'll let you know if I have any luck here.
Hi,
Thanks for your report and Amit's analysis.
I tried to do some research with gdb. And I think the adjustment of the
parameter 'size' in the function GenerationAlloc() can cause the requested
memory to become larger for each change.
I tried to reproduce the problem with the table structure you mentioned, but
rb->size didn't get close to 5GB after setting 256MB limit.
I think that with the same logical_decoding_work_mem, the more the number of
changes, the more extra space will be allocated due to the adjustment in the
function GenerationAlloc(). So I resized my test tuple (reduce the tuple size),
and rb->size just exceeded the configured logical_decoding_work_mem a bit. (For
every additional 1MB configured, the additional 40+KB space will be allocated.)
I'm not sure if there is a problem with my reproduction approach, could you
please help to confirm? Here is my test details:
[Table info]
create table tab(a jsonb, b text, c int);
[Tuple info]
I use the pg_column_size() to select specific data.
The size of column 'a' in my test tuple is 27 bytes. (Before resizing it's 620 bytes.)
The size of column 'b' is 5 byte. (Before resizing it's 164 bytes.)
[Reproduce SQL]
UPDATE tab SET a = (a || '{"key0":"values0"}'), c = c*3 WHERE mod(c,2) = 1;
If you have a successfully reproduced use case, could you please provide more
detailed reproduction steps if possible?
Regards,
Wang Wei
On Tues, Jan 10, 2023 at 0:00 AM Alex Richman <alexrichman@onesignal.com> wrote:
> I have also been poking around with gdb, looking at ReorderBufferGetTupleBuf
> and ReorderBufferChangeSize.  There's certainly a difference in how they
> calculate the size, but they only differ by a handful of bytes so I don't
> understand where the 2 orders of magnitude difference between the Tuples
> memory context and rb->size is coming from.
>
> I am setting up a test environment to try and replicate this outside of prod.  One
> oddity I can note already is that when I set up a logical replica chained off the
> current logical replica (primary -> LR 1 -> LR 2), the primary shows the memory
> spikes but the middle replica (LR 1) does not.

Hi, Alex

I think the commit c6e0fe1f2a in master may have an impact on this issue
because this commit reduce overheads of memory management. So I did some tests
(same test environment in [1]) and compared the results as below:

Before c6e0fe1f2a, for every additional 1MB configured in
logical_decoding_work_mem, the additional 141KB space will be allocated. While
in the current master, for every additional 1MB configured, the additional 47KB
space will be allocated.

In summary, with the commit c6e0fe1f2a in master, the additional space
allocated in the context is reduced. But I think this size difference seems to
be inconsistent with what you meet. So I think the issues you meet seems not to
be caused by the problem improved by this commit on master. How do you think?

If possible, could you please share which version of PG the issue occurs on,
and could you please also try to reproduce the problem on master?

Regards,
Wang Wei

[1] -
https://www.postgresql.org/message-id/OS3PR01MB6275677D0DAEC1132FD0AC7F9EFE9%40OS3PR01MB6275.jpnprd01.prod.outlook.com
In summary, with the commit c6e0fe1f2a in master, the additional space
allocated in the context is reduced. But I think this size difference seems to
be inconsistent with what you meet. So I think the issues you meet seems not to
be caused by the problem improved by this commit on master. How do you think?
Agreed - I see a few different places where rb->size can disagree with the allocation size, but nothing that would produce a delta of 200KB vs 7GiB. I think the issue lies somewhere within the allocator itself (more below).
If possible, could you please share which version of PG the issue occurs on,
and could you please also try to reproduce the problem on master?
We run 15.1-1 in prod, I have been trying to replicate the issue on that also.
So far I have a partial replication of the issue by populating a table of schema (id UUID PRIMARY KEY, data JSONB) with some millions of rows, then doing some updates on them (I ran 16 of these concurrently each acting on 1/16th of the rows):
UPDATE test SET data = data || '{"test_0": "1", "test_1": "1", "test_2": "1", "test_3": "1", "test_4": "1", "test_5": "1", "test_6": "1", "test_7": "1", "test_8": "1", "test_9": "1", "test_a": "1", "test_b": "1", "test_c": "1", "test_d": "1", "test_e": "1", "test_f": "1"}' @- '{test_0}';
This does cause the walsender memory to grow to ~1GiB, even with a configured logical_decoding_work_mem of 256MB. However it is not a perfect replication of the issue we see in prod, because rb->size does eventually grow to 256MB and start streaming transactions so the walsender memory does not grow up to the level we see in prod.
I believe the updates in prod are large numbers of updates to single rows, which may be the relevant difference, but I am having trouble producing enough update volume on the test systems to simulate it. For some idea of the scale, those update statements in prod are producing ~6million WAL records per minute according to pg_stat_statements.
To tie off the reorder buffer size question, I built a custom 15.1 from source with a patch that passes the tuple alloc_size from ReorderBufferGetTupleBuf through to ReorderBufferChangeSize so it can account rb->size on that instead of t_len. This had no notable effect on rb->size relative to the process RSS, so I think I agree that the issue lies deeper within the Generation memory context, not within the reorder buffer accounting.
Suspicious of GenerationAlloc, I then patched it to log its decision making, and found that it was disproportionally failing to allocate space within the freeblock+keeper, such that almost every Tuple context allocation was mallocing a new block. I don't really understand the structure of the allocator, but based on the logging, freeblock was consistently NULL and keeper had GenerationBlockFreeBytes() = 0. I feel I lack the postgres codebase understanding to investigate further with this. Incidentally there is a fixup comment [1] which suggests the generation context sizes may be out of date.
Further to the memory allocation strangeness. I noticed that there is a lot of heap fragmentation within the walsender processes. After the spike in Tuples memory context has returned to normal, the RSS of the process itself remains at peak for ~10-20 minutes. Inspecting core dumps of these processes with core_analyzer shows all the memory is actually free and is not being reclaimed due to heap fragmentation. Perhaps fragmentation within the memory context due to the allocation sizes vs the chunk size in GenerationAlloc is also a factor.
Thanks,
- Alex.
On Wed, Jan 11, 2023 at 23:42 PM Alex Richman <alexrichman@onesignal.com> wrote:
>

Thanks for the details and analysis you shared.

> On Tue, 10 Jan 2023 at 11:22, wangw.fnst@fujitsu.com
> <wangw.fnst@fujitsu.com> wrote:
> > In summary, with the commit c6e0fe1f2a in master, the additional space
> > allocated in the context is reduced. But I think this size difference seems to
> > be inconsistent with what you meet. So I think the issues you meet seems not
> to
> > be caused by the problem improved by this commit on master. How do you
> think?
> Agreed - I see a few different places where rb->size can disagree with the
> allocation size, but nothing that would produce a delta of 200KB vs 7GiB.  I think
> the issue lies somewhere within the allocator itself (more below).
>
> > If possible, could you please share which version of PG the issue occurs on,
> > and could you please also try to reproduce the problem on master?
> We run 15.1-1 in prod, I have been trying to replicate the issue on that also.
>
> So far I have a partial replication of the issue by populating a table of schema (id
> UUID PRIMARY KEY, data JSONB) with some millions of rows, then doing some
> updates on them (I ran 16 of these concurrently each acting on 1/16th of the
> rows):
> UPDATE test SET data = data || '{"test_0": "1", "test_1": "1", "test_2": "1",
> "test_3": "1", "test_4": "1", "test_5": "1", "test_6": "1", "test_7": "1", "test_8":
> "1", "test_9": "1", "test_a": "1", "test_b": "1", "test_c": "1", "test_d": "1",
> "test_e": "1", "test_f": "1"}' @- '{test_0}';
> This does cause the walsender memory to grow to ~1GiB, even with a
> configured logical_decoding_work_mem of 256MB.  However it is not a perfect
> replication of the issue we see in prod, because rb->size does eventually grow
> to 256MB and start streaming transactions so the walsender memory does not
> grow up to the level we see in prod.

I think the result you said this time (the memory used in rb->tup_context
reaches 1GB) reproduces the same type of problem.

I think parallelism doesn't affect this problem. Because for a walsender, I
think it will always read the wal serially in order. Please let me know if I'm
missing something.

And I tried to use the table structure and UPDATE statement you said. But
unfortunately I didn't catch 1GB or unexpected (I mean a lot size beyond 256MB)
usage in rb->tup_context. Could you please help me to confirm my test? Here is
my test details:
```
[publisher-side]
    create table tab(id UUID PRIMARY KEY, data JSONB);
    create publication pub for table tab;

[subscriber-side]
    create table tab(id UUID PRIMARY KEY, data JSONB);
    CREATE SUBSCRIPTION sub CONNECTION 'xxx' PUBLICATION pub;

[Initial data in publisher-side]
    INSERT INTO tab SELECT gen_random_uuid(), '{"key1":"values1"}'::jsonb FROM generate_series(1, 2000000) s(i);
```

BTW, I'm not sure, what is the operator '@-' at the end of the UPDATE statement
you mentioned? Do you mean '#-'? I think JSONB seem not to have operator '@-'.
So I used '#-' instead of '@-' when testing.

Before the program serializes data to disk in the function
ReorderBufferCheckMemoryLimit (I mean before this line is executed: [1]), I
print rb->size and call MemoryContextStats(rb->context) to check context usage.

In addition, I think that in the function ReorderBufferIterTXNNext, the usage
in rb->tup_context may exceed rb->size a lot. But because of the limit
max_changes_in_memory in the function ReorderBufferRestoreChanges, and the size
of the tuple we mentioned is not very large, I think the usage in
rb->tup_context won't reach 1GB here.

Could you share one thing with me: When you print rb->size and call the
function MemoryContextStats(rb->context), which line of code is being executed
by the program?

Regards,
Wang Wei

[1] -
https://github.com/postgres/postgres/blob/c5dc80c1bc216f0e21a2f79f5e0415c2d4cfb35d/src/backend/replication/logical/reorderbuffer.c#L3497
On Thu, 12 Jan 2023 at 10:44, wangw.fnst@fujitsu.com <wangw.fnst@fujitsu.com> wrote:
I think parallelism doesn't affect this problem. Because for a walsender, I
think it will always read the wal serially in order. Please let me know if I'm
missing something.
I suspect it's more about getting enough changes into the WAL quickly enough for walsender to not spend any time idle. I suppose you could stack the deck towards this by first disabling the subscription, doing the updates to spool a bunch of changes in the WAL, then enabling the subscription again. Perhaps there is also some impact in the WAL records interleaving from the concurrent updates and making more work for the reorder buffer.
The servers I am testing on are quite beefy, so it might be a little harder to generate sufficient load if you're testing locally on a laptop or something.
And I tried to use the table structure and UPDATE statement you said. But
unfortunately I didn't catch 1GB or unexpected (I mean a lot size beyond 256MB)
usage in rb->tup_context. Could you please help me to confirm my test? Here is
my test details:
Here's test scripts that replicate it for me: [1]
This is on 15.1, installed on debian-11, running on GCP n2-highmem-80 (IceLake) /w 24x Local SSD in raid0.
BTW, I'm not sure, what is the operator '@-' at the end of the UPDATE statement
you mentioned? Do you mean '#-'? I think JSONB seem not to have operator '@-'.
So I used '#-' instead of '@-' when testing.
Not sure tbh, I pulled this out of our source control at the callsite generating the prod traffic I'm seeing. Seems to be doing the same thing as '-' though (deleting elements from the column matching keys in the array). Separately @ is "absolute value" [2] so maybe this is just @ and - in a weird mix that happens to work :shrug:.
Could you share one thing with me: When you print rb->size and call the
function MemoryContextStats(rb->context), which line of code is being executed
by the program?
While I was checking rb->size against the memory context I was logging in and around ReorderBufferGetTuple.
To go towards the theory on GenerationAlloc being the issue, I have a patch that replaces ReorderBuffer's usage of it with simple malloc/free: [3]. Naturally this would not be sensible as a long term fix, but does prove the issue.
This results in the walsender process RSS never exceeding 297MB, even under heavier load. If I have the opportunity I will also test this against our production traffic to double confirm that the issue does not replicate with it there.
Thanks,
- Alex.
On Thu, Jan 12, 2023 at 21:02 PM Alex Richman <alexrichman@onesignal.com> wrote:
> On Thu, 12 Jan 2023 at 10:44, wangw.fnst@fujitsu.com
> <wangw.fnst@fujitsu.com> wrote:
> > I think parallelism doesn't affect this problem. Because for a walsender, I
> > think it will always read the wal serially in order. Please let me know if I'm
> > missing something.
> I suspect it's more about getting enough changes into the WAL quickly enough
> for walsender to not spend any time idle.  I suppose you could stack the deck
> towards this by first disabling the subscription, doing the updates to spool a
> bunch of changes in the WAL, then enabling the subscription again.  Perhaps
> there is also some impact in the WAL records interleaving from the concurrent
> updates and making more work for the reorder buffer.
> The servers I am testing on are quite beefy, so it might be a little harder to
> generate sufficient load if you're testing locally on a laptop or something.
>
> > And I tried to use the table structure and UPDATE statement you said. But
> > unfortunately I didn't catch 1GB or unexpected (I mean a lot size beyond
> 256MB)
> > usage in rb->tup_context. Could you please help me to confirm my test? Here
> is
> > my test details:
> Here's test scripts that replicate it for me: [1]
> This is on 15.1, installed on debian-11, running on GCP n2-highmem-80 (IceLake)
> /w 24x Local SSD in raid0.

Thanks for the details you shared.

Yes, I think you are right. I think I reproduced this problem as you suggested
(Update the entire table in parallel). And I can reproduce this problem on both
current HEAD and REL_15_1. The memory used in rb->tup_context can reach 350M
in HEAD and reach 600MB in REL_15_1.

Here are my steps to reproduce:
1. Apply the attached diff patch to add some logs for confirmation.
2. Use the attached reproduction script to reproduce the problem.
3. Confirm the debug log that is output to the log file pub.log.

After doing some research, I agree with the idea you mentioned before. I think
this problem is caused by the implementation of 'Generational allocator' or the
way we uses the API of 'Generational allocator'.

Here is my analysis:
When we try to free the memory used in rb->tup_context in the function
GenerationFree(), I think it is because of this if-condition [1] that the
memory is not actually freed. So IIUC, in the function
ReorderBufferReturnChange, rb->size will be reduced in the function
ReorderBufferChangeMemoryUpdate, while the memory used in rb->tup_context may
not be freed in the function ReorderBufferReturnTupleBuf. I think this is why
the two counters don't match.

BTW, after debugging, I think that compared to updating the entire table
serially, if the entire table is updated in parallel, the frequency of meeting
this condition will increase a lot. So I think this is why updating the tables
in parallel is easier to reproduce this problem.

But there's one more thing I'm not sure about. You mentioned in [2] that
pg_stat_replication_slots shows 0 spilled or streamed bytes for any slots. I
think this may be due to the timing of viewing pg_stat_replication_slots. In
the function ReorderBufferCheckMemoryLimit , after invoking the function
ReorderBufferSerializeTXN, even without actually freeing any used memory in
rb->tup_context, I could see spilled-related record in
pg_stat_replication_slots. Could you please help to confirm this point if
possible?

Regards,
Wang Wei

[1] -
https://github.com/postgres/postgres/blob/c5dc80c1bc216f0e21a2f79f5e0415c2d4cfb35d/src/backend/utils/mmgr/generation.c#L702
[2] - https://www.postgresql.org/message-id/CAMnUB3oYugXCBLSkih%2BqNsWQPciEwos6g_AMbnz_peNoxfHwyw%40mail.gmail.com
Вложения
I think I reproduced this problem as you suggested
(Update the entire table in parallel). And I can reproduce this problem on both
current HEAD and REL_15_1. The memory used in rb->tup_context can reach 350M
in HEAD and reach 600MB in REL_15_1.
Great, thanks for your help in reproducing this.
But there's one more thing I'm not sure about. You mentioned in [2] that
pg_stat_replication_slots shows 0 spilled or streamed bytes for any slots. I
think this may be due to the timing of viewing pg_stat_replication_slots. In
the function ReorderBufferCheckMemoryLimit , after invoking the function
ReorderBufferSerializeTXN, even without actually freeing any used memory in
rb->tup_context, I could see spilled-related record in
pg_stat_replication_slots. Could you please help to confirm this point if
possible?
So on the local reproduction using the test scripts we have in the last two emails, I do see some streamed bytes on the test slot. However in production I still see 0 streamed or spilled bytes, and the walsenders there regularly reach some gigabytes of RSS. I think it is the same root bug but with a far greater scale in production (millions of tiny updates instead of 16 large ones). I should also note that in production we have ~40 subscriptions/walsenders rather than 1 in the test reproduction here, so there's a lot of extra CPU churning through the work.
Thanks for your continued analysis of the GenerationAlloc/Free stuff - I'm afraid I'm out of my depth there but let me know if you need any more information on reproducing the issue or testing patches etc.
Thanks,
- Alex.
On Fri, Jan 13, 2023 at 4:47 PM wangw.fnst@fujitsu.com
<wangw.fnst@fujitsu.com> wrote:
>
> On Thu, Jan 12, 2023 at 21:02 PM Alex Richman <alexrichman@onesignal.com> wrote:
> > On Thu, 12 Jan 2023 at 10:44, wangw.fnst@fujitsu.com
> > <wangw.fnst@fujitsu.com> wrote:
> > > I think parallelism doesn't affect this problem. Because for a walsender, I
> > > think it will always read the wal serially in order. Please let me know if I'm
> > > missing something.
> > I suspect it's more about getting enough changes into the WAL quickly enough
> > for walsender to not spend any time idle.  I suppose you could stack the deck
> > towards this by first disabling the subscription, doing the updates to spool a
> > bunch of changes in the WAL, then enabling the subscription again.  Perhaps
> > there is also some impact in the WAL records interleaving from the concurrent
> > updates and making more work for the reorder buffer.
> > The servers I am testing on are quite beefy, so it might be a little harder to
> > generate sufficient load if you're testing locally on a laptop or something.
> >
> > > And I tried to use the table structure and UPDATE statement you said. But
> > > unfortunately I didn't catch 1GB or unexpected (I mean a lot size beyond
> > 256MB)
> > > usage in rb->tup_context. Could you please help me to confirm my test? Here
> > is
> > > my test details:
> > Here's test scripts that replicate it for me: [1]
> > This is on 15.1, installed on debian-11, running on GCP n2-highmem-80 (IceLake)
> > /w 24x Local SSD in raid0.
>
> Thanks for the details you shared.
>
> Yes, I think you are right. I think I reproduced this problem as you suggested
> (Update the entire table in parallel). And I can reproduce this problem on both
> current HEAD and REL_15_1. The memory used in rb->tup_context can reach 350M
> in HEAD and reach 600MB in REL_15_1.
>
> Here are my steps to reproduce:
> 1. Apply the attached diff patch to add some logs for confirmation.
> 2. Use the attached reproduction script to reproduce the problem.
> 3. Confirm the debug log that is output to the log file pub.log.
>
> After doing some research, I agree with the idea you mentioned before. I think
> this problem is caused by the implementation of 'Generational allocator' or the
> way we uses the API of 'Generational allocator'.
>
> Here is my analysis:
> When we try to free the memory used in rb->tup_context in the function
> GenerationFree(), I think it is because of this if-condition [1] that the
> memory is not actually freed. So IIUC, in the function
> ReorderBufferReturnChange, rb->size will be reduced in the function
> ReorderBufferChangeMemoryUpdate, while the memory used in rb->tup_context may
> not be freed in the function ReorderBufferReturnTupleBuf. I think this is why
> the two counters don't match.
>
> BTW, after debugging, I think that compared to updating the entire table
> serially, if the entire table is updated in parallel, the frequency of meeting
> this condition will increase a lot. So I think this is why updating the tables
> in parallel is easier to reproduce this problem.
>

Yeah, this theory sounds like the cause of the problem because
normally we free all the tuples at the end of xact, however, in this
case as there are parallel txns, it may not get a chance to free it.
This should be less of a problem after the commit 1b0d9aa4 (which is
present in PG15) where we started to reuse the free chunks. I wonder
why you don't see the reuse in PG15? Is it because of large tuples, or
something that cause direct allocations, or something else?

Alex,
Do we see this problem with small tuples as well? I see from your
earlier email that tuple size is ~800 bytes in the production
environment. It is possible that after commit 1b0d9aa4 such kind of
problems are not there with small tuple sizes but that commit happened
in PG15 whereas your production environment might be on a prior
release.

--
With Regards,
Amit Kapila.
On Wed, 18 Jan 2023 at 10:10, Amit Kapila <amit.kapila16@gmail.com> wrote:
Alex,
Do we see this problem with small tuples as well? I see from your
earlier email that tuple size is ~800 bytes in the production
environment. It is possible that after commit 1b0d9aa4 such kind of
problems are not there with small tuple sizes but that commit happened
in PG15 whereas your production environment might be on a prior
release.
Hi Amit,
Our prod environment is also on 15.1, which is where we first saw the issue, so I'm afraid the issue still seems to be present here.
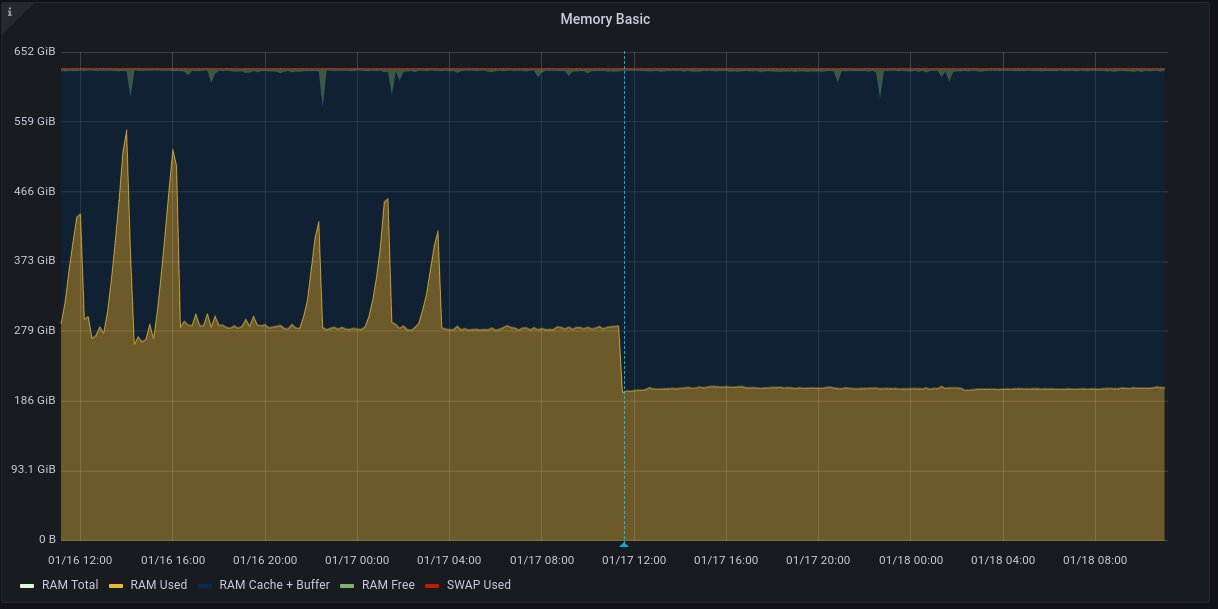
Looping back on the earlier discussion, we applied the malloc patch from [1] ([2]) to a prod server, which also fixes the issue there. Attached is a graph of the last 48 hours of memory usage, the ~200GB spikes are instances of the LR walsender memory issue.
After patch is applied (blue mark), baseline memory drops and we no longer see the spikes. Per-process memory stats corroborate that the LR walsender memory is now never more than a few MB RSS per process.
Thanks,
- Alex.
Вложения
Hi all,
Looping back to say we updated to 15.2 and are still seeing this issue, though it is less prevalent.
Thanks,
- Alex.
On Wed, 18 Jan 2023 at 11:16, Alex Richman <alexrichman@onesignal.com> wrote:
On Wed, 18 Jan 2023 at 10:10, Amit Kapila <amit.kapila16@gmail.com> wrote:Alex,
Do we see this problem with small tuples as well? I see from your
earlier email that tuple size is ~800 bytes in the production
environment. It is possible that after commit 1b0d9aa4 such kind of
problems are not there with small tuple sizes but that commit happened
in PG15 whereas your production environment might be on a prior
release.Hi Amit,Our prod environment is also on 15.1, which is where we first saw the issue, so I'm afraid the issue still seems to be present here.Looping back on the earlier discussion, we applied the malloc patch from [1] ([2]) to a prod server, which also fixes the issue there. Attached is a graph of the last 48 hours of memory usage, the ~200GB spikes are instances of the LR walsender memory issue.After patch is applied (blue mark), baseline memory drops and we no longer see the spikes. Per-process memory stats corroborate that the LR walsender memory is now never more than a few MB RSS per process.Thanks,- Alex.
Le 16/02/2023 à 19:08, Alex Richman a écrit :
Hi all,Looping back to say we updated to 15.2 and are still seeing this issue, though it is less prevalent.Thanks,- Alex.On Wed, 18 Jan 2023 at 11:16, Alex Richman <alexrichman@onesignal.com> wrote:On Wed, 18 Jan 2023 at 10:10, Amit Kapila <amit.kapila16@gmail.com> wrote:Alex,
Do we see this problem with small tuples as well? I see from your
earlier email that tuple size is ~800 bytes in the production
environment. It is possible that after commit 1b0d9aa4 such kind of
problems are not there with small tuple sizes but that commit happened
in PG15 whereas your production environment might be on a prior
release.Hi Amit,Our prod environment is also on 15.1, which is where we first saw the issue, so I'm afraid the issue still seems to be present here.Looping back on the earlier discussion, we applied the malloc patch from [1] ([2]) to a prod server, which also fixes the issue there. Attached is a graph of the last 48 hours of memory usage, the ~200GB spikes are instances of the LR walsender memory issue.After patch is applied (blue mark), baseline memory drops and we no longer see the spikes. Per-process memory stats corroborate that the LR walsender memory is now never more than a few MB RSS per process.Thanks,- Alex.
Hi,
Amit / Wang Wei do you have a better patch to fix this bug or should we use the one provided by Alex? I have tried some other fixes but it's a fail, you may have better understanding of the problem and the way to fix it.
Best regards
--
Gilles Darold
On Fri, Jan 13, 2023 at 8:17 PM wangw.fnst@fujitsu.com
<wangw.fnst@fujitsu.com> wrote:
>
> On Thu, Jan 12, 2023 at 21:02 PM Alex Richman <alexrichman@onesignal.com> wrote:
> > On Thu, 12 Jan 2023 at 10:44, wangw.fnst@fujitsu.com
> > <wangw.fnst@fujitsu.com> wrote:
> > > I think parallelism doesn't affect this problem. Because for a walsender, I
> > > think it will always read the wal serially in order. Please let me know if I'm
> > > missing something.
> > I suspect it's more about getting enough changes into the WAL quickly enough
> > for walsender to not spend any time idle.  I suppose you could stack the deck
> > towards this by first disabling the subscription, doing the updates to spool a
> > bunch of changes in the WAL, then enabling the subscription again.  Perhaps
> > there is also some impact in the WAL records interleaving from the concurrent
> > updates and making more work for the reorder buffer.
> > The servers I am testing on are quite beefy, so it might be a little harder to
> > generate sufficient load if you're testing locally on a laptop or something.
> >
> > > And I tried to use the table structure and UPDATE statement you said. But
> > > unfortunately I didn't catch 1GB or unexpected (I mean a lot size beyond
> > 256MB)
> > > usage in rb->tup_context. Could you please help me to confirm my test? Here
> > is
> > > my test details:
> > Here's test scripts that replicate it for me: [1]
> > This is on 15.1, installed on debian-11, running on GCP n2-highmem-80 (IceLake)
> > /w 24x Local SSD in raid0.
>
> Thanks for the details you shared.
>
> Yes, I think you are right. I think I reproduced this problem as you suggested
> (Update the entire table in parallel). And I can reproduce this problem on both
> current HEAD and REL_15_1. The memory used in rb->tup_context can reach 350M
> in HEAD and reach 600MB in REL_15_1.
>
> Here are my steps to reproduce:
> 1. Apply the attached diff patch to add some logs for confirmation.
> 2. Use the attached reproduction script to reproduce the problem.
> 3. Confirm the debug log that is output to the log file pub.log.
>
> After doing some research, I agree with the idea you mentioned before. I think
> this problem is caused by the implementation of 'Generational allocator' or the
> way we uses the API of 'Generational allocator'.

I think there are two separate issues. One is a pure memory accounting
issue: since the reorderbuffer accounts the memory usage by
calculating actual tuple size etc. it includes neither the chunk
header size nor fragmentations within blocks. So I can understand why
the output of MemoryContextStats(rb->context) could be two or three
times higher than logical_decoding_work_mem and doesn't match rb->size
in some cases.

However it cannot explain the original issue that the memory usage
(reported by MemoryContextStats(rb->context)) reached 5GB in spite of
logilca_decoding_work_mem being 256MB, which seems like a memory leak
bug or something we ignore the memory limit. My colleague Drew
Callahan helped me investigate this issue and we found out that in
ReorderBufferIterTXNInit() we restore all changes of the top
transaction as well as all subtransactions but we don't respect the
memory limit when restoring changes. It's normally not a problem since
each decoded change is not typically large and we restore up to 4096
changes. However, if the transaction has many subtransactions, we
restore 4096 changes for each subtransaction at once, temporarily
consuming much memory. This behavior can explain the symptoms of the
original issue but one thing I'm unsure is that Alex reported
replacing MemoryContextAlloc() in ReorderBufferGetChange() with
malloc() resolved the issue. I think it can resolve/mitigate the
former issue (memory accounting issue) but IIUC it cannot for the
latter problem. There might be other factors for this problem. Anyway,
I've attached a simple reproducer that works as a tap test for
test_decoding.

I think we need to discuss two things separately and should deal with
at least the latter problem.

Regards,

--
Masahiko Sawada
Amazon Web Services: https://aws.amazon.com
Вложения
On Thu, May 9, 2023 at 9:33 AM Masahiko Sawada <sawada.mshk@gmail.com> wrote:
> On Fri, Jan 13, 2023 at 8:17 PM wangw.fnst@fujitsu.com
> <wangw.fnst@fujitsu.com> wrote:
> >
> > On Thu, Jan 12, 2023 at 21:02 PM Alex Richman <alexrichman@onesignal.com>
> wrote:
> > > On Thu, 12 Jan 2023 at 10:44, wangw.fnst@fujitsu.com
> > > <wangw.fnst@fujitsu.com> wrote:
> > > > I think parallelism doesn't affect this problem. Because for a walsender, I
> > > > think it will always read the wal serially in order. Please let me know if I'm
> > > > missing something.
> > > I suspect it's more about getting enough changes into the WAL quickly
> enough
> > > for walsender to not spend any time idle.  I suppose you could stack the deck
> > > towards this by first disabling the subscription, doing the updates to spool a
> > > bunch of changes in the WAL, then enabling the subscription again.  Perhaps
> > > there is also some impact in the WAL records interleaving from the
> concurrent
> > > updates and making more work for the reorder buffer.
> > > The servers I am testing on are quite beefy, so it might be a little harder to
> > > generate sufficient load if you're testing locally on a laptop or something.
> > >
> > > > And I tried to use the table structure and UPDATE statement you said. But
> > > > unfortunately I didn't catch 1GB or unexpected (I mean a lot size beyond
> > > 256MB)
> > > > usage in rb->tup_context. Could you please help me to confirm my test?
> Here
> > > is
> > > > my test details:
> > > Here's test scripts that replicate it for me: [1]
> > > This is on 15.1, installed on debian-11, running on GCP n2-highmem-80
> (IceLake)
> > > /w 24x Local SSD in raid0.
> >
> > Thanks for the details you shared.
> >
> > Yes, I think you are right. I think I reproduced this problem as you suggested
> > (Update the entire table in parallel). And I can reproduce this problem on both
> > current HEAD and REL_15_1. The memory used in rb->tup_context can reach
> 350M
> > in HEAD and reach 600MB in REL_15_1.
> >
> > Here are my steps to reproduce:
> > 1. Apply the attached diff patch to add some logs for confirmation.
> > 2. Use the attached reproduction script to reproduce the problem.
> > 3. Confirm the debug log that is output to the log file pub.log.
> >
> > After doing some research, I agree with the idea you mentioned before. I think
> > this problem is caused by the implementation of 'Generational allocator' or the
> > way we uses the API of 'Generational allocator'.
>
> I think there are two separate issues. One is a pure memory accounting
> issue: since the reorderbuffer accounts the memory usage by
> calculating actual tuple size etc. it includes neither the chunk
> header size nor fragmentations within blocks. So I can understand why
> the output of MemoryContextStats(rb->context) could be two or three
> times higher than logical_decoding_work_mem and doesn't match rb->size
> in some cases.
>
> However it cannot explain the original issue that the memory usage
> (reported by MemoryContextStats(rb->context)) reached 5GB in spite of
> logilca_decoding_work_mem being 256MB, which seems like a memory leak
> bug or something we ignore the memory limit.

Yes, I agree that the chunk header size or fragmentations within blocks may
cause the allocated space to be larger than the accounted space. However, since
these spaces are very small (please refer to [1] and [2]), I also don't think
this is the cause of the original issue in this thread.

I think that the cause of the original issue in this thread is the
implementation of 'Generational allocator'.
Please consider the following user scenario:
The parallel execution of different transactions led to very fragmented and
mixed-up WAL records for those transactions. Later, when walsender serially
decodes the WAL, different transactions' chunks were stored on a single block
in rb->tup_context. However, when a transaction ends, the chunks related to
this transaction on the block will be marked as free instead of being actually
released. The block will only be released when all chunks in the block are
free. In other words, the block will only be released when all transactions
occupying the block have ended. As a result, the chunks allocated by some
ending transactions are not being released on many blocks for a long time. Then
this issue occurred. I think this also explains why parallel execution is more
likely to trigger this issue compared to serial execution of transactions.
Please also refer to the analysis details of code in [3].

> My colleague Drew
> Callahan helped me investigate this issue and we found out that in
> ReorderBufferIterTXNInit() we restore all changes of the top
> transaction as well as all subtransactions but we don't respect the
> memory limit when restoring changes. It's normally not a problem since
> each decoded change is not typically large and we restore up to 4096
> changes. However, if the transaction has many subtransactions, we
> restore 4096 changes for each subtransaction at once, temporarily
> consuming much memory. This behavior can explain the symptoms of the
> original issue but one thing I'm unsure is that Alex reported
> replacing MemoryContextAlloc() in ReorderBufferGetChange() with
> malloc() resolved the issue. I think it can resolve/mitigate the
> former issue (memory accounting issue) but IIUC it cannot for the
> latter problem. There might be other factors for this problem. Anyway,
> I've attached a simple reproducer that works as a tap test for
> test_decoding.
>
> I think we need to discuss two things separately and should deal with
> at least the latter problem.

Yes, I agree that this is another separate issue we need to discuss.

[1] -
https://www.postgresql.org/message-id/OS3PR01MB6275677D0DAEC1132FD0AC7F9EFE9%40OS3PR01MB6275.jpnprd01.prod.outlook.com
[2] - https://www.postgresql.org/message-id/CAMnUB3oSCM0BNK%3Do0_3PwHc1oJepgex_%3DmNAD5oY7rEjR8958w%40mail.gmail.com
[3] -
https://www.postgresql.org/message-id/OS3PR01MB6275A7E5323601D59D18DB979EC29%40OS3PR01MB6275.jpnprd01.prod.outlook.com

Regards,
Wang wei
On Tue, May 9, 2023 at 6:06 PM Wei Wang (Fujitsu)
<wangw.fnst@fujitsu.com> wrote:
>
> On Thu, May 9, 2023 at 9:33 AM Masahiko Sawada <sawada.mshk@gmail.com> wrote:
> > On Fri, Jan 13, 2023 at 8:17 PM wangw.fnst@fujitsu.com
> > <wangw.fnst@fujitsu.com> wrote:
> > >
> > > On Thu, Jan 12, 2023 at 21:02 PM Alex Richman <alexrichman@onesignal.com>
> > wrote:
> > > > On Thu, 12 Jan 2023 at 10:44, wangw.fnst@fujitsu.com
> > > > <wangw.fnst@fujitsu.com> wrote:
> > > > > I think parallelism doesn't affect this problem. Because for a walsender, I
> > > > > think it will always read the wal serially in order. Please let me know if I'm
> > > > > missing something.
> > > > I suspect it's more about getting enough changes into the WAL quickly
> > enough
> > > > for walsender to not spend any time idle.  I suppose you could stack the deck
> > > > towards this by first disabling the subscription, doing the updates to spool a
> > > > bunch of changes in the WAL, then enabling the subscription again.  Perhaps
> > > > there is also some impact in the WAL records interleaving from the
> > concurrent
> > > > updates and making more work for the reorder buffer.
> > > > The servers I am testing on are quite beefy, so it might be a little harder to
> > > > generate sufficient load if you're testing locally on a laptop or something.
> > > >
> > > > > And I tried to use the table structure and UPDATE statement you said. But
> > > > > unfortunately I didn't catch 1GB or unexpected (I mean a lot size beyond
> > > > 256MB)
> > > > > usage in rb->tup_context. Could you please help me to confirm my test?
> > Here
> > > > is
> > > > > my test details:
> > > > Here's test scripts that replicate it for me: [1]
> > > > This is on 15.1, installed on debian-11, running on GCP n2-highmem-80
> > (IceLake)
> > > > /w 24x Local SSD in raid0.
> > >
> > > Thanks for the details you shared.
> > >
> > > Yes, I think you are right. I think I reproduced this problem as you suggested
> > > (Update the entire table in parallel). And I can reproduce this problem on both
> > > current HEAD and REL_15_1. The memory used in rb->tup_context can reach
> > 350M
> > > in HEAD and reach 600MB in REL_15_1.
> > >
> > > Here are my steps to reproduce:
> > > 1. Apply the attached diff patch to add some logs for confirmation.
> > > 2. Use the attached reproduction script to reproduce the problem.
> > > 3. Confirm the debug log that is output to the log file pub.log.
> > >
> > > After doing some research, I agree with the idea you mentioned before. I think
> > > this problem is caused by the implementation of 'Generational allocator' or the
> > > way we uses the API of 'Generational allocator'.
> >
> > I think there are two separate issues. One is a pure memory accounting
> > issue: since the reorderbuffer accounts the memory usage by
> > calculating actual tuple size etc. it includes neither the chunk
> > header size nor fragmentations within blocks. So I can understand why
> > the output of MemoryContextStats(rb->context) could be two or three
> > times higher than logical_decoding_work_mem and doesn't match rb->size
> > in some cases.
> >
> > However it cannot explain the original issue that the memory usage
> > (reported by MemoryContextStats(rb->context)) reached 5GB in spite of
> > logilca_decoding_work_mem being 256MB, which seems like a memory leak
> > bug or something we ignore the memory limit.
>
> Yes, I agree that the chunk header size or fragmentations within blocks may
> cause the allocated space to be larger than the accounted space. However, since
> these spaces are very small (please refer to [1] and [2]), I also don't think
> this is the cause of the original issue in this thread.
>
> I think that the cause of the original issue in this thread is the
> implementation of 'Generational allocator'.
> Please consider the following user scenario:
> The parallel execution of different transactions led to very fragmented and
> mixed-up WAL records for those transactions. Later, when walsender serially
> decodes the WAL, different transactions' chunks were stored on a single block
> in rb->tup_context. However, when a transaction ends, the chunks related to
> this transaction on the block will be marked as free instead of being actually
> released. The block will only be released when all chunks in the block are
> free. In other words, the block will only be released when all transactions
> occupying the block have ended. As a result, the chunks allocated by some
> ending transactions are not being released on many blocks for a long time. Then
> this issue occurred. I think this also explains why parallel execution is more
> likely to trigger this issue compared to serial execution of transactions.
> Please also refer to the analysis details of code in [3].

After some investigation, I don't think the implementation of
generation allocator is problematic but I agree that your scenario is
likely to explain the original issue. Especially, the output of
MemoryContextStats() shows:

          Tuples: 4311744512 total in 514 blocks (12858943 chunks);
6771224 free (12855411 chunks); 4304973288 used

First, since the total memory allocation was 4311744512 bytes in 514
blocks we can see there were no special blocks in the context (8MB *
514 = 4311744512 bytes). Second, it shows that the most chunks were
free (12858943 chunks vs. 12855411 chunks) but most memory were used
(4311744512 bytes vs. 4304973288 bytes), which means that there were
some in-use chunks at the tail of each block, i.e. the most blocks
were fragmented. I've attached another test to reproduce this
behavior. In this test, the memory usage reaches up to almost 4GB.

One idea to deal with this issue is to choose the block sizes
carefully while measuring the performance as the comment shows:

    /*
     * XXX the allocation sizes used below pre-date generation context's block
     * growing code.  These values should likely be benchmarked and set to
     * more suitable values.
     */
    buffer->tup_context = GenerationContextCreate(new_ctx,
                                                  "Tuples",
                                                  SLAB_LARGE_BLOCK_SIZE,
                                                  SLAB_LARGE_BLOCK_SIZE,
                                                  SLAB_LARGE_BLOCK_SIZE);

For example, if I use SLAB_DEFAULT_BLOCK_SIZE, 8kB, the maximum memory
usage was about 17MB in the test.

>
> > My colleague Drew
> > Callahan helped me investigate this issue and we found out that in
> > ReorderBufferIterTXNInit() we restore all changes of the top
> > transaction as well as all subtransactions but we don't respect the
> > memory limit when restoring changes. It's normally not a problem since
> > each decoded change is not typically large and we restore up to 4096
> > changes. However, if the transaction has many subtransactions, we
> > restore 4096 changes for each subtransaction at once, temporarily
> > consuming much memory. This behavior can explain the symptoms of the
> > original issue but one thing I'm unsure is that Alex reported
> > replacing MemoryContextAlloc() in ReorderBufferGetChange() with
> > malloc() resolved the issue. I think it can resolve/mitigate the
> > former issue (memory accounting issue) but IIUC it cannot for the
> > latter problem. There might be other factors for this problem. Anyway,
> > I've attached a simple reproducer that works as a tap test for
> > test_decoding.
> >
> > I think we need to discuss two things separately and should deal with
> > at least the latter problem.
>
> Yes, I agree that this is another separate issue we need to discuss.

If this scenario had happened, MemoryContextStats() would have shown
that there were less free chunks compared to in-use chunks.

Regards,

--
Masahiko Sawada
Amazon Web Services: https://aws.amazon.com
Вложения
On Thu, May 9, 2023 at 22:58 PM Masahiko Sawada <sawada.mshk@gmail.com> wrote:
> On Tue, May 9, 2023 at 6:06 PM Wei Wang (Fujitsu)
> > > I think there are two separate issues. One is a pure memory accounting
> > > issue: since the reorderbuffer accounts the memory usage by
> > > calculating actual tuple size etc. it includes neither the chunk
> > > header size nor fragmentations within blocks. So I can understand why
> > > the output of MemoryContextStats(rb->context) could be two or three
> > > times higher than logical_decoding_work_mem and doesn't match rb->size
> > > in some cases.
> > >
> > > However it cannot explain the original issue that the memory usage
> > > (reported by MemoryContextStats(rb->context)) reached 5GB in spite of
> > > logilca_decoding_work_mem being 256MB, which seems like a memory leak
> > > bug or something we ignore the memory limit.
> >
> > Yes, I agree that the chunk header size or fragmentations within blocks may
> > cause the allocated space to be larger than the accounted space. However, since
> > these spaces are very small (please refer to [1] and [2]), I also don't think
> > this is the cause of the original issue in this thread.
> >
> > I think that the cause of the original issue in this thread is the
> > implementation of 'Generational allocator'.
> > Please consider the following user scenario:
> > The parallel execution of different transactions led to very fragmented and
> > mixed-up WAL records for those transactions. Later, when walsender serially
> > decodes the WAL, different transactions' chunks were stored on a single block
> > in rb->tup_context. However, when a transaction ends, the chunks related to
> > this transaction on the block will be marked as free instead of being actually
> > released. The block will only be released when all chunks in the block are
> > free. In other words, the block will only be released when all transactions
> > occupying the block have ended. As a result, the chunks allocated by some
> > ending transactions are not being released on many blocks for a long time.
> Then
> > this issue occurred. I think this also explains why parallel execution is more
> > likely to trigger this issue compared to serial execution of transactions.
> > Please also refer to the analysis details of code in [3].
>
> After some investigation, I don't think the implementation of
> generation allocator is problematic but I agree that your scenario is
> likely to explain the original issue. Especially, the output of
> MemoryContextStats() shows:
>
>           Tuples: 4311744512 total in 514 blocks (12858943 chunks);
> 6771224 free (12855411 chunks); 4304973288 used
>
> First, since the total memory allocation was 4311744512 bytes in 514
> blocks we can see there were no special blocks in the context (8MB *
> 514 = 4311744512 bytes). Second, it shows that the most chunks were
> free (12858943 chunks vs. 12855411 chunks) but most memory were used
> (4311744512 bytes vs. 4304973288 bytes), which means that there were
> some in-use chunks at the tail of each block, i.e. the most blocks
> were fragmented. I've attached another test to reproduce this
> behavior. In this test, the memory usage reaches up to almost 4GB.
>
> One idea to deal with this issue is to choose the block sizes
> carefully while measuring the performance as the comment shows:
>
>     /*
>      * XXX the allocation sizes used below pre-date generation context's block
>      * growing code.  These values should likely be benchmarked and set to
>      * more suitable values.
>      */
>     buffer->tup_context = GenerationContextCreate(new_ctx,
>                                                   "Tuples",
>                                                   SLAB_LARGE_BLOCK_SIZE,
>                                                   SLAB_LARGE_BLOCK_SIZE,
>                                                   SLAB_LARGE_BLOCK_SIZE);
>
> For example, if I use SLAB_DEFAULT_BLOCK_SIZE, 8kB, the maximum memory
> usage was about 17MB in the test.

Thanks for your idea.
I did some tests as you suggested. I think the modification mentioned above can
work around this issue in the test 002_rb_memory_2.pl on [1] (To reach the size
of large transactions, I set logical_decoding_work_mem to 1MB). But the test
repreduce.sh on [2] still reproduces this issue. It seems that this modification
will fix a subset of use cases, But the issue still occurs for other use cases.

I think that the size of a block may lead to differences in the number of
transactions stored on the block. For example, before the modification, a block
could store some changes of 10 transactions, but after the modification, a block
may only store some changes of 3 transactions. I think this means that once
these three transactions are committed, this block will be actually released.
As a result, the probability of the block being actually released is increased
after the modification. Additionally, I think that the parallelism of the test
repreduce.sh is higher than that of the test 002_rb_memory_2.pl, which is also
the reason why this modification only fixed the issue in the test
002_rb_memory_2.pl.

Please let me know if I'm missing something.

Attach the modification patch that I used (tmp-modification.patch), as well as
the two tests mentioned above.

[1] - https://www.postgresql.org/message-id/CAD21AoAa17DCruz4MuJ_5Q_-JOp5FmZGPLDa%3DM9d%2BQzzg8kiBw%40mail.gmail.com
[2] -
https://www.postgresql.org/message-id/OS3PR01MB6275A7E5323601D59D18DB979EC29%40OS3PR01MB6275.jpnprd01.prod.outlook.com

Regards,
Wang wei
Вложения
On Tue, May 23, 2023 at 1:11 PM Wei Wang (Fujitsu)
<wangw.fnst@fujitsu.com> wrote:
>
> On Thu, May 9, 2023 at 22:58 PM Masahiko Sawada <sawada.mshk@gmail.com> wrote:
> > On Tue, May 9, 2023 at 6:06 PM Wei Wang (Fujitsu)
> > > > I think there are two separate issues. One is a pure memory accounting
> > > > issue: since the reorderbuffer accounts the memory usage by
> > > > calculating actual tuple size etc. it includes neither the chunk
> > > > header size nor fragmentations within blocks. So I can understand why
> > > > the output of MemoryContextStats(rb->context) could be two or three
> > > > times higher than logical_decoding_work_mem and doesn't match rb->size
> > > > in some cases.
> > > >
> > > > However it cannot explain the original issue that the memory usage
> > > > (reported by MemoryContextStats(rb->context)) reached 5GB in spite of
> > > > logilca_decoding_work_mem being 256MB, which seems like a memory leak
> > > > bug or something we ignore the memory limit.
> > >
> > > Yes, I agree that the chunk header size or fragmentations within blocks may
> > > cause the allocated space to be larger than the accounted space. However, since
> > > these spaces are very small (please refer to [1] and [2]), I also don't think
> > > this is the cause of the original issue in this thread.
> > >
> > > I think that the cause of the original issue in this thread is the
> > > implementation of 'Generational allocator'.
> > > Please consider the following user scenario:
> > > The parallel execution of different transactions led to very fragmented and
> > > mixed-up WAL records for those transactions. Later, when walsender serially
> > > decodes the WAL, different transactions' chunks were stored on a single block
> > > in rb->tup_context. However, when a transaction ends, the chunks related to
> > > this transaction on the block will be marked as free instead of being actually
> > > released. The block will only be released when all chunks in the block are
> > > free. In other words, the block will only be released when all transactions
> > > occupying the block have ended. As a result, the chunks allocated by some
> > > ending transactions are not being released on many blocks for a long time.
> > Then
> > > this issue occurred. I think this also explains why parallel execution is more
> > > likely to trigger this issue compared to serial execution of transactions.
> > > Please also refer to the analysis details of code in [3].
> >
> > After some investigation, I don't think the implementation of
> > generation allocator is problematic but I agree that your scenario is
> > likely to explain the original issue. Especially, the output of
> > MemoryContextStats() shows:
> >
> >           Tuples: 4311744512 total in 514 blocks (12858943 chunks);
> > 6771224 free (12855411 chunks); 4304973288 used
> >
> > First, since the total memory allocation was 4311744512 bytes in 514
> > blocks we can see there were no special blocks in the context (8MB *
> > 514 = 4311744512 bytes). Second, it shows that the most chunks were
> > free (12858943 chunks vs. 12855411 chunks) but most memory were used
> > (4311744512 bytes vs. 4304973288 bytes), which means that there were
> > some in-use chunks at the tail of each block, i.e. the most blocks
> > were fragmented. I've attached another test to reproduce this
> > behavior. In this test, the memory usage reaches up to almost 4GB.
> >
> > One idea to deal with this issue is to choose the block sizes
> > carefully while measuring the performance as the comment shows:
> >
> >     /*
> >      * XXX the allocation sizes used below pre-date generation context's block
> >      * growing code.  These values should likely be benchmarked and set to
> >      * more suitable values.
> >      */
> >     buffer->tup_context = GenerationContextCreate(new_ctx,
> >                                                   "Tuples",
> >                                                   SLAB_LARGE_BLOCK_SIZE,
> >                                                   SLAB_LARGE_BLOCK_SIZE,
> >                                                   SLAB_LARGE_BLOCK_SIZE);
> >
> > For example, if I use SLAB_DEFAULT_BLOCK_SIZE, 8kB, the maximum memory
> > usage was about 17MB in the test.
>
> Thanks for your idea.
> I did some tests as you suggested. I think the modification mentioned above can
> work around this issue in the test 002_rb_memory_2.pl on [1] (To reach the size
> of large transactions, I set logical_decoding_work_mem to 1MB). But the test
> repreduce.sh on [2] still reproduces this issue.

Yes, it's because the above modification doesn't fix the memory
accounting issue but only reduces memory bloat in some (extremely bad)
cases. Without this modification, it was possible that the maximum
actual memory usage could easily reach several tens of times as
logical_decoding_work_mem (e.g. 4GB vs. 256MB as originally reported).
Since the fact that the reorderbuffer doesn't account for memory
fragmentation etc is still there, it's still possible that the actual
memory usage could reach several times as logical_decoding_work_mem.
In my environment, with reproducer.sh you shared, the total actual
memory usage reached up to about 430MB while logical_decoding_work_mem
being 256MB. Probably even if we use another type for memory allocator
such as AllocSet a similar issue will still happen. If we don't want
the reorderbuffer memory usage never to exceed
logical_decoding_work_mem, we would need to change how the
reorderbuffer uses and accounts for memory, which would require much
work, I guess.

> It seems that this modification
> will fix a subset of use cases, But the issue still occurs for other use cases.
>
> I think that the size of a block may lead to differences in the number of
> transactions stored on the block. For example, before the modification, a block
> could store some changes of 10 transactions, but after the modification, a block
> may only store some changes of 3 transactions. I think this means that once
> these three transactions are committed, this block will be actually released.
> As a result, the probability of the block being actually released is increased
> after the modification.

In addition to that, I think the size of a block may lead to
differences in the consequences of memory fragmentation. The larger
blocks, the larger fragmentation could happen within blocks.

> Additionally, I think that the parallelism of the test
> repreduce.sh is higher than that of the test 002_rb_memory_2.pl, which is also
> the reason why this modification only fixed the issue in the test
> 002_rb_memory_2.pl.

Could you elaborate on why higher parallelism could affect this memory
accounting issue more?

Regards,

--
Masahiko Sawada
Amazon Web Services: https://aws.amazon.com
On Wed, May 24, 2023 at 9:27 AMMasahiko Sawada <sawada.mshk@gmail.com> wrote:
> On Tue, May 23, 2023 at 1:11 PM Wei Wang (Fujitsu)
> <wangw.fnst@fujitsu.com> wrote:
> >
> > On Thu, May 9, 2023 at 22:58 PM Masahiko Sawada <sawada.mshk@gmail.com> wrote:
> > > On Tue, May 9, 2023 at 6:06 PM Wei Wang (Fujitsu)
> > > > > I think there are two separate issues. One is a pure memory accounting
> > > > > issue: since the reorderbuffer accounts the memory usage by
> > > > > calculating actual tuple size etc. it includes neither the chunk
> > > > > header size nor fragmentations within blocks. So I can understand why
> > > > > the output of MemoryContextStats(rb->context) could be two or three
> > > > > times higher than logical_decoding_work_mem and doesn't match rb->size
> > > > > in some cases.
> > > > >
> > > > > However it cannot explain the original issue that the memory usage
> > > > > (reported by MemoryContextStats(rb->context)) reached 5GB in spite of
> > > > > logilca_decoding_work_mem being 256MB, which seems like a memory leak
> > > > > bug or something we ignore the memory limit.
> > > >
> > > > Yes, I agree that the chunk header size or fragmentations within blocks may
> > > > cause the allocated space to be larger than the accounted space. However, since
> > > > these spaces are very small (please refer to [1] and [2]), I also don't think
> > > > this is the cause of the original issue in this thread.
> > > >
> > > > I think that the cause of the original issue in this thread is the
> > > > implementation of 'Generational allocator'.
> > > > Please consider the following user scenario:
> > > > The parallel execution of different transactions led to very fragmented and
> > > > mixed-up WAL records for those transactions. Later, when walsender serially
> > > > decodes the WAL, different transactions' chunks were stored on a single block
> > > > in rb->tup_context. However, when a transaction ends, the chunks related to
> > > > this transaction on the block will be marked as free instead of being actually
> > > > released. The block will only be released when all chunks in the block are
> > > > free. In other words, the block will only be released when all transactions
> > > > occupying the block have ended. As a result, the chunks allocated by some
> > > > ending transactions are not being released on many blocks for a long time.
> > > > Then this issue occurred. I think this also explains why parallel execution is more
> > > > likely to trigger this issue compared to serial execution of transactions.
> > > > Please also refer to the analysis details of code in [3].
> > >
> > > After some investigation, I don't think the implementation of
> > > generation allocator is problematic but I agree that your scenario is
> > > likely to explain the original issue. Especially, the output of
> > > MemoryContextStats() shows:
> > >
> > >           Tuples: 4311744512 total in 514 blocks (12858943 chunks);
> > > 6771224 free (12855411 chunks); 4304973288 used
> > >
> > > First, since the total memory allocation was 4311744512 bytes in 514
> > > blocks we can see there were no special blocks in the context (8MB *
> > > 514 = 4311744512 bytes). Second, it shows that the most chunks were
> > > free (12858943 chunks vs. 12855411 chunks) but most memory were used
> > > (4311744512 bytes vs. 4304973288 bytes), which means that there were
> > > some in-use chunks at the tail of each block, i.e. the most blocks
> > > were fragmented. I've attached another test to reproduce this
> > > behavior. In this test, the memory usage reaches up to almost 4GB.
> > >
> > > One idea to deal with this issue is to choose the block sizes
> > > carefully while measuring the performance as the comment shows:
> > >
> > >     /*
> > >      * XXX the allocation sizes used below pre-date generation context's block
> > >      * growing code.  These values should likely be benchmarked and set to
> > >      * more suitable values.
> > >      */
> > >     buffer->tup_context = GenerationContextCreate(new_ctx,
> > >                                                   "Tuples",
> > >                                                   SLAB_LARGE_BLOCK_SIZE,
> > >                                                   SLAB_LARGE_BLOCK_SIZE,
> > >                                                   SLAB_LARGE_BLOCK_SIZE);
> > >
> > > For example, if I use SLAB_DEFAULT_BLOCK_SIZE, 8kB, the maximum memory
> > > usage was about 17MB in the test.
> >
> > Thanks for your idea.
> > I did some tests as you suggested. I think the modification mentioned above can
> > work around this issue in the test 002_rb_memory_2.pl on [1] (To reach the size
> > of large transactions, I set logical_decoding_work_mem to 1MB). But the test
> > repreduce.sh on [2] still reproduces this issue.
>
> Yes, it's because the above modification doesn't fix the memory
> accounting issue but only reduces memory bloat in some (extremely bad)
> cases. Without this modification, it was possible that the maximum
> actual memory usage could easily reach several tens of times as
> logical_decoding_work_mem (e.g. 4GB vs. 256MB as originally reported).
> Since the fact that the reorderbuffer doesn't account for memory
> fragmentation etc is still there, it's still possible that the actual
> memory usage could reach several times as logical_decoding_work_mem.
> In my environment, with reproducer.sh you shared, the total actual
> memory usage reached up to about 430MB while logical_decoding_work_mem
> being 256MB. Probably even if we use another type for memory allocator
> such as AllocSet a similar issue will still happen. If we don't want
> the reorderbuffer memory usage never to exceed
> logical_decoding_work_mem, we would need to change how the
> reorderbuffer uses and accounts for memory, which would require much
> work, I guess.
>
> > It seems that this modification
> > will fix a subset of use cases, But the issue still occurs for other use cases.
> >
> > I think that the size of a block may lead to differences in the number of
> > transactions stored on the block. For example, before the modification, a block
> > could store some changes of 10 transactions, but after the modification, a block
> > may only store some changes of 3 transactions. I think this means that once
> > these three transactions are committed, this block will be actually released.
> > As a result, the probability of the block being actually released is increased
> > after the modification.
>
> In addition to that, I think the size of a block may lead to
> differences in the consequences of memory fragmentation. The larger
> blocks, the larger fragmentation could happen within blocks.
>
> > Additionally, I think that the parallelism of the test
> > repreduce.sh is higher than that of the test 002_rb_memory_2.pl, which is also
> > the reason why this modification only fixed the issue in the test
> > 002_rb_memory_2.pl.
>
> Could you elaborate on why higher parallelism could affect this memory
> accounting issue more?

I think higher parallelism leads to greater fragmentation and mixing of the WAL.
This means that walsender is processing more transactions at the same time. IOW,
although the number of changes stored on a block has not changed, the number of
transactions which these changes belong to has increased. So, in order to
actually release this block, the number of transactions that need to be
committed will also increase. What's more, I think the freed-chunks in the block
could not be reused (see functions GenerationAlloc and GenerationFree). As a
result, I think we need to wait longer before the block can actually be released
in some cases, and then, this issue is more likely to be reproduced. Therefore,
I think that higher parallelism will make it more likely for the issue on this
thread to be reproduced.

Regards,
Wang wei
Hi,

Thank you for working on this issue.
It seems that we have also faced the same one.

> On Wed, May 24, 2023 at 9:27 AMMasahiko Sawada <sawada.mshk@gmail.com>
> wrote:
>> Yes, it's because the above modification doesn't fix the memory
>> accounting issue but only reduces memory bloat in some (extremely bad)
>> cases. Without this modification, it was possible that the maximum
>> actual memory usage could easily reach several tens of times as
>> logical_decoding_work_mem (e.g. 4GB vs. 256MB as originally reported).
>> Since the fact that the reorderbuffer doesn't account for memory
>> fragmentation etc is still there, it's still possible that the actual
>> memory usage could reach several times as logical_decoding_work_mem.
>> In my environment, with reproducer.sh you shared, the total actual
>> memory usage reached up to about 430MB while logical_decoding_work_mem
>> being 256MB. Probably even if we use another type for memory allocator
>> such as AllocSet a similar issue will still happen. If we don't want
>> the reorderbuffer memory usage never to exceed
>> logical_decoding_work_mem, we would need to change how the
>> reorderbuffer uses and accounts for memory, which would require much
>> work, I guess.

Considering the manual says that logical_decoding_work_mem "specifies
the maximum amount of memory to be used by logical decoding" and this
would be easy for users to tune, it may be best to do this work.
However..

>>> One idea to deal with this issue is to choose the block sizes
>>> carefully while measuring the performance as the comment shows:
>>>
>>>
>>>
>>>     /*
>>>      * XXX the allocation sizes used below pre-date generation
>>> context's block
>>>      * growing code.  These values should likely be benchmarked and
>>> set to
>>>      * more suitable values.
>>>      */
>>>     buffer->tup_context = GenerationContextCreate(new_ctx,
>>>                                                   "Tuples",
>>>
>>> SLAB_LARGE_BLOCK_SIZE,
>>>
>>> SLAB_LARGE_BLOCK_SIZE,
>>>
>>> SLAB_LARGE_BLOCK_SIZE);

since this idea can prevent the issue in not all but some situations,
this may be good for mitigation measure.
One concern is this would cause more frequent malloc(), but it is better
than memory bloat, isn't it?


--
Regards,

--
Atsushi Torikoshi
NTT DATA Group Corporation
On Mon, May 20, 2024 at 12:02 AM torikoshia <torikoshia@oss.nttdata.com> wrote:
>
> Hi,
>
> Thank you for working on this issue.
> It seems that we have also faced the same one.
>
> > On Wed, May 24, 2023 at 9:27 AMMasahiko Sawada <sawada.mshk@gmail.com>
> > wrote:
> >> Yes, it's because the above modification doesn't fix the memory
> >> accounting issue but only reduces memory bloat in some (extremely bad)
> >> cases. Without this modification, it was possible that the maximum
> >> actual memory usage could easily reach several tens of times as
> >> logical_decoding_work_mem (e.g. 4GB vs. 256MB as originally reported).
> >> Since the fact that the reorderbuffer doesn't account for memory
> >> fragmentation etc is still there, it's still possible that the actual
> >> memory usage could reach several times as logical_decoding_work_mem.
> >> In my environment, with reproducer.sh you shared, the total actual
> >> memory usage reached up to about 430MB while logical_decoding_work_mem
> >> being 256MB. Probably even if we use another type for memory allocator
> >> such as AllocSet a similar issue will still happen. If we don't want
> >> the reorderbuffer memory usage never to exceed
> >> logical_decoding_work_mem, we would need to change how the
> >> reorderbuffer uses and accounts for memory, which would require much
> >> work, I guess.
>
> Considering the manual says that logical_decoding_work_mem "specifies
> the maximum amount of memory to be used by logical decoding" and this
> would be easy for users to tune, it may be best to do this work.
> However..
>
> >>> One idea to deal with this issue is to choose the block sizes
> >>> carefully while measuring the performance as the comment shows:
> >>>
> >>>
> >>>
> >>>     /*
> >>>      * XXX the allocation sizes used below pre-date generation
> >>> context's block
> >>>      * growing code.  These values should likely be benchmarked and
> >>> set to
> >>>      * more suitable values.
> >>>      */
> >>>     buffer->tup_context = GenerationContextCreate(new_ctx,
> >>>                                                   "Tuples",
> >>>
> >>> SLAB_LARGE_BLOCK_SIZE,
> >>>
> >>> SLAB_LARGE_BLOCK_SIZE,
> >>>
> >>> SLAB_LARGE_BLOCK_SIZE);
>
> since this idea can prevent the issue in not all but some situations,
> this may be good for mitigation measure.
> One concern is this would cause more frequent malloc(), but it is better
> than memory bloat, isn't it?

FYI I've just pushed the commit for fixing this memory issue to all
supported branches[1]. It's just to let people, including the
reporter, know the recent updates on this topic.

[1] https://git.postgresql.org/gitweb/?p=postgresql.git;a=commit;h=1b9b6cc3456be0f6ab929107293b31c333270bc1

Regards,

--
Masahiko Sawada
Amazon Web Services: https://aws.amazon.com
> FYI I've just pushed the commit for fixing this memory issue to all
supported branches[1]. It's just to let people, including the
supported branches[1]. It's just to let people, including the
reporter, know the recent updates on this topic.
Thanks for your efforts on this -- I've confirmed in a test environment that your patch applied against 15.2 fixes the issue.
We will probably wait for 17.2-3 before upgrading our production environments to confirm the issue is fully resolved there. I'll let you know how it looks after that.
Many thanks,
- Alex.