Обсуждение: Database Locks , Performance Issues and How to Resolve?
Hi Experts,
In our TEST database – PostgreSQL 10 - We are facing issue while executing SELECT queries from application concurrently.
Select statements taking long some time (almost ½ hr) and it goes into lock mode even after we have COMMIT in the updates.
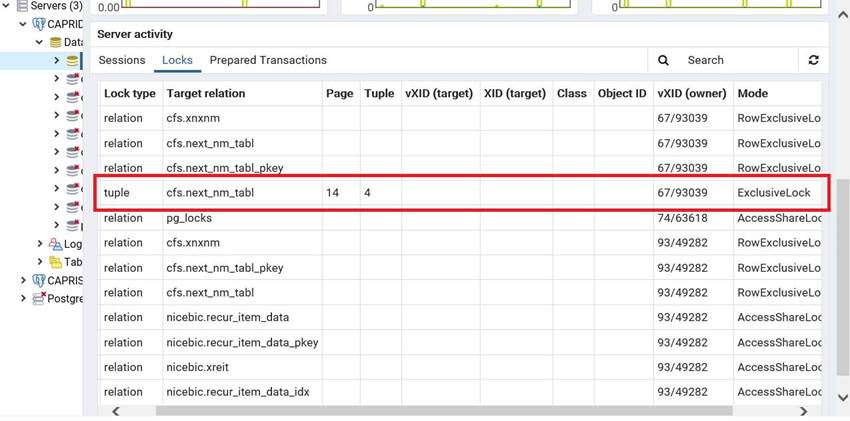
In PGADMIN dashboard, database applied exclusive lock on table cfs.next_nm_tabl.
This issue is major for us, and huge performance issue for applications.
Attached the spreadsheet with all details of LOCKS.
Please suggest how to handle this in PostgreSQL , as this never is an issue when we simulate the same in Oracle?
Query from application:
2019-12-28 20:00:17.185 DEBUG 25032 --- [pool-2-thread-1] org.hibernate.SQL :
update
cfs.next_nm_tabl
set
next_nm=?
where
nm_typ_ind=?
DB Locks details from PGADMIN:

Вложения
Hi Experts,
In our TEST database – PostgreSQL 10 - We are facing issue while executing SELECT queries from application concurrently.
Select statements taking long some time (almost ½ hr)
and it goes into lock mode even after we have COMMIT in the updates.
In PGADMIN dashboard, database applied exclusive lock on table cfs.next_nm_tabl.
This issue is major for us, and huge performance issue for applications.
Attached the spreadsheet with all details of LOCKS.
Please suggest how to handle this in PostgreSQL , as this never is an issue when we simulate the same in Oracle?
Вложения
From: Jeff Janes <jeff.janes@gmail.com>
Sent: maandag 30 december 2019 17:42
To: Bhattacharjee, Soumik <soumik.bhattacharjee@kpn.com>
Cc: pgsql-admin@lists.postgresql.org; pgsql-admin <pgsql-admin@postgresql.org>
Subject: Re: Database Locks , Performance Issues and How to Resolve?
On Mon, Dec 30, 2019 at 10:09 AM <soumik.bhattacharjee@kpn.com> wrote:
Hi Experts,
In our TEST database – PostgreSQL 10 - We are facing issue while executing SELECT queries from application concurrently.
Select statements taking long some time (almost ½ hr)
It is not inherently wrong for a select query to take 30 minutes. It depends on what the query is. How long do you think it should take instead? does it take less time under other circumstances? What is the query? Can you do an EXPLAIN (ANALYZE, BUFFERS) for it?
- The SELECT statements are based on index , and based on primary key values which is always done by all developers in team from different sources- JPA, pgadmin etc.
and it goes into lock mode even after we have COMMIT in the updates.
According to your spreadsheet, none of your select queries are being blocked by locks. A few update statements are. But I am quite certain those have not been committed.
- Yes its batch processing , so one file contains 10,000+ records and like this we have 50+ files which is processed by the Java Microservices.
In PGADMIN dashboard, database applied exclusive lock on table cfs.next_nm_tabl.
The exclusive lock is not on the table, it is on a row within the table.
This issue is major for us, and huge performance issue for applications.
Attached the spreadsheet with all details of LOCKS.
This spreadsheet has omitted some important columns, like locktype, which makes it rather hard to figure out what is going on. But it looks like pid 27196 has opened a transaction and then forgotten to close it. Is it a SELECT...FOR UPDATE? The text of the query is truncated, you could increase track_activity_query_size so it is large enough to hold the whole query.
Please suggest how to handle this in PostgreSQL , as this never is an issue when we simulate the same in Oracle?
Your first recourse should pg_stat_activity, not pg_locks. What is 27196 doing? Is it 'idle in transaction'?
- I want to know if below is true in case of Postgres ? Then it’s a problem as all coding needs to be done manually and not by JPA.
By default in Java Spring boot autocommit set to true. It means all the SQL statements consider as a transactions (include Select statement).
Automatically Begin and commit will execute only successful execution of each statement.
Cheers,
Jeff
- I want to know if below is true in case of Postgres ? Then it’s a problem as all coding needs to be done manually and not by JPA.
By default in Java Spring boot autocommit set to true. It means all the SQL statements consider as a transactions (include Select statement).
Automatically Begin and commit will execute only successful execution of each statement.