Обсуждение: [HACKERS] measuring the impact of increasing WAL segment size
Hi,

A few months ago there was a discussion about increasing the default WAL
segment size [1]. For various reasons we ended up only allowing values
up to 1GB for --with-wal-segsize in configure, one of them being the
absence of sufficient data about how the performance impact.

I've promised to do some benchmarking to provide us some hard data in
that thread, and that's what this post is about. The benchmarks I ended
up doing are not as extensive as I originally proposed, though.

What I have tested:

* 4 different hardware configurations (both spinning rust and flash)
* 2 workloads (tpcb-like and simple-update from pgbench)
* 3 scales (50, 300 and 2000)
* flushing enabled/disabled

I was interested in the impact of the flushing added in PostgreSQL 9.5,
so the flushing refers to *_flush_after GUCs. Enabled means "default"
while "disabled" means everything set to 0.

For each combination of parameters I've done a single 4-hour pgbench
run, which means about 30 days of runtime (22 days is just "clean"
runtime without initialization etc.). This somewhat explains why I
scaled down the range of workloads to test, etc.

I've been collecting various database/system metrics (sar, pg_stat_*,
...), in total it's about 10GB of data compressed, and likely more than
100GB uncompressed. This post only presents some basic summary and
charts, let me know if you're interested in the raw data. Additional
charts are available at [2].

I've mentioned I've done the same tests on 4 different configurations,
so here are some basic details:

1) i5-2500k-ssd-raid

     CPU: Intel i5-2500k (4 cores, released 2011)
     RAM: 8GB
     storage: 6 x Intel S3700 100GB SSD (RAID0, swraid)
     kernel: 4.10

2) xeon-e5-2620v4-nvme

     CPU: 2x Intel Xeon e5-2620 v4 (8/16 cores, released 2016)
     RAM: 32GB
     storage: Intel 750 SSD (NVMe, 400GB)
     kernel: 4.10

3) xeon-e5-2620v4-sata-raid

     CPU: 2x Intel Xeon e5-2620 v4 (8/16 cores, released 2016)
     RAM: 32GB
     storage: 3 x 7.2k SATA drives
     kernel: 4.10

4) xeon-e5450-sas-raid

     CPU: 2x Intel Xeon E5450 (4 cores, released 2006)
     RAM: 16GB
     storage: 6x 10k 146GB SAS (RAID 10, HP P400 with 512MB BBWC)
     kernel: 4.10

For all configuration everything (WAL, data) was placed on a single
filesystem. Mostly for simplicity, but also because it shows the "worst
case" impact.


Most of the charts is uninteresting, as there is almost no impact of
either WAL segment size changes or (disabling the) flushing. The changes
in average tps are typically within 1-2%, and if there's a trend it
usually shows tiny improvement for larger WAL segments.

This is true in particular for all tests on configurations with flash
storage, simple-update-50-xeon-e5-2620v4-nvme.eps is a nice example of
such boring chart.


Now, let's look at the interesting charts ...

1) scales 300/2000 on SAS RAID (RAID controller with 512MB write cache)

     * simple-update-2000-xeon-e5450-sas-raid.eps
     * simple-update-300-xeon-e5450-sas-raid.eps
     * tpcb-like-2000-xeon-e5450-sas-raid.eps

I'm not sure what's happening on those two charts, but I suspect it's
mostly a case of overloaded storage, as the machine has only 16GB of
RAM, so scale 2000 does not fit into RAM (and the smaller scales do
behave much more reasonably on this hardware).

2) pretty much everything on the software SATA RAID

     * simple-update-2000-xeon-e5-2620v4-sata-raid.eps
     * simple-update-300-xeon-e5-2620v4-sata-raid.eps
     * simple-update-50-xeon-e5-2620v4-sata-raid.eps
     * tpcb-like-2000-xeon-e5-2620v4-sata-raid.eps
     * tpcb-like-300-xeon-e5-2620v4-sata-raid.eps
     * tpcb-like-50-xeon-e5-2620v4-sata-raid.eps

I don't dare to make absolute judgments based on just one pgbench run,
but the basic trends seem to be fairly clear:

a) The flushing has significant impact on average tps, in some cases
reducing the throughput by 30-40%.

The primary reason for this is of course that the regular flushing
significantly increases the number of fsyncs, which on SATA RAID has
serious impact.

Granted - this chart does not show latency, so it's not a complete
picture. Also, if you care about raw OLTP performance you're probably
already running on flash, where this does not seem to be an issue. It's
also not an issue if you have RAID controller with write cache, which
can absorb those writes. And of course, those machines have reasonable
dirty_background_bytes values (like 64MB or less).

But it's something to be aware of, watch for, and perhaps consider
disabling the flushing (and instead tuning page cache eviction).

b) The "flushing enabled" case seems to be much more sensitive to WAL
segment size increases. It seems the throughput drops a bit (by 10-20%),
for some segment sizes, and then recovers. The behavior seems to be
smooth (not just a sudden drop for one segment size) but the value
varies depending on the scale, test type (tpc-b /simple-update).

There is almost no such impact in the "flushing disabled" cases.

Similarly to the SAS RAID config (with 512MB write cache on the RAID
controller), the largest scale behaves a bit unpredictably. I assume the
reasons are the same - overloaded spinning rust.

regards


[1]
https://www.postgresql.org/message-id/flat/CA%2BTgmoZctR8Sqvgxp2-_fncsgvQSCaYZJ7e%2BoF8XnNLnJwOQ8Q%40mail.gmail.com

[2] https://github.com/tvondra/wal-segment-size-tests

--
Tomas Vondra                  http://www.2ndQuadrant.com
PostgreSQL Development, 24x7 Support, Remote DBA, Training & Services

--
Sent via pgsql-hackers mailing list (pgsql-hackers@postgresql.org)
To make changes to your subscription:
http://www.postgresql.org/mailpref/pgsql-hackers
Вложения
- simple-update-50-i5-2500k-ssd-raid.eps
- simple-update-50-xeon-e5-2620v4-nvme.eps
- simple-update-50-xeon-e5-2620v4-sata-raid.eps
- simple-update-50-xeon-e5450-sas-raid.eps
- simple-update-300-i5-2500k-ssd-raid.eps
- simple-update-300-xeon-e5-2620v4-nvme.eps
- simple-update-300-xeon-e5-2620v4-sata-raid.eps
- simple-update-300-xeon-e5450-sas-raid.eps
- simple-update-2000-i5-2500k-ssd-raid.eps
- simple-update-2000-xeon-e5-2620v4-nvme.eps
- simple-update-2000-xeon-e5-2620v4-sata-raid.eps
- simple-update-2000-xeon-e5450-sas-raid.eps
- tpcb-like-50-i5-2500k-ssd-raid.eps
- tpcb-like-50-xeon-e5-2620v4-nvme.eps
- tpcb-like-50-xeon-e5-2620v4-sata-raid.eps
- tpcb-like-50-xeon-e5450-sas-raid.eps
- tpcb-like-300-i5-2500k-ssd-raid.eps
- tpcb-like-300-xeon-e5-2620v4-nvme.eps
- tpcb-like-300-xeon-e5-2620v4-sata-raid.eps
- tpcb-like-300-xeon-e5450-sas-raid.eps
- tpcb-like-2000-i5-2500k-ssd-raid.eps
- tpcb-like-2000-xeon-e5-2620v4-nvme.eps
- tpcb-like-2000-xeon-e5-2620v4-sata-raid.eps
- tpcb-like-2000-xeon-e5450-sas-raid.eps
Hi,

Thanks for running this!

On 2017-08-15 03:27:00 +0200, Tomas Vondra wrote:
> Granted - this chart does not show latency, so it's not a complete
> picture.

That'd be quite useful to see here, too.


> Also, if you care about raw OLTP performance you're probably already running
> on flash, where this does not seem to be an issue. It's also not an issue if
> you have RAID controller with write cache, which can absorb those writes.
> And of course, those machines have reasonable dirty_background_bytes values
> (like 64MB or less).

The problem is that dirty_background_bytes = 64MB is *not* actually a
generally reasonable config, because it makes temp table, disk sort, etc
operations flush way too aggressively.


> b) The "flushing enabled" case seems to be much more sensitive to WAL
> segment size increases. It seems the throughput drops a bit (by 10-20%), for
> some segment sizes, and then recovers. The behavior seems to be smooth (not
> just a sudden drop for one segment size) but the value varies depending on
> the scale, test type (tpc-b /simple-update).

That's interesting.  I presume you've not tested with separate data /
xlog disks?


Greetings,

Andres Freund
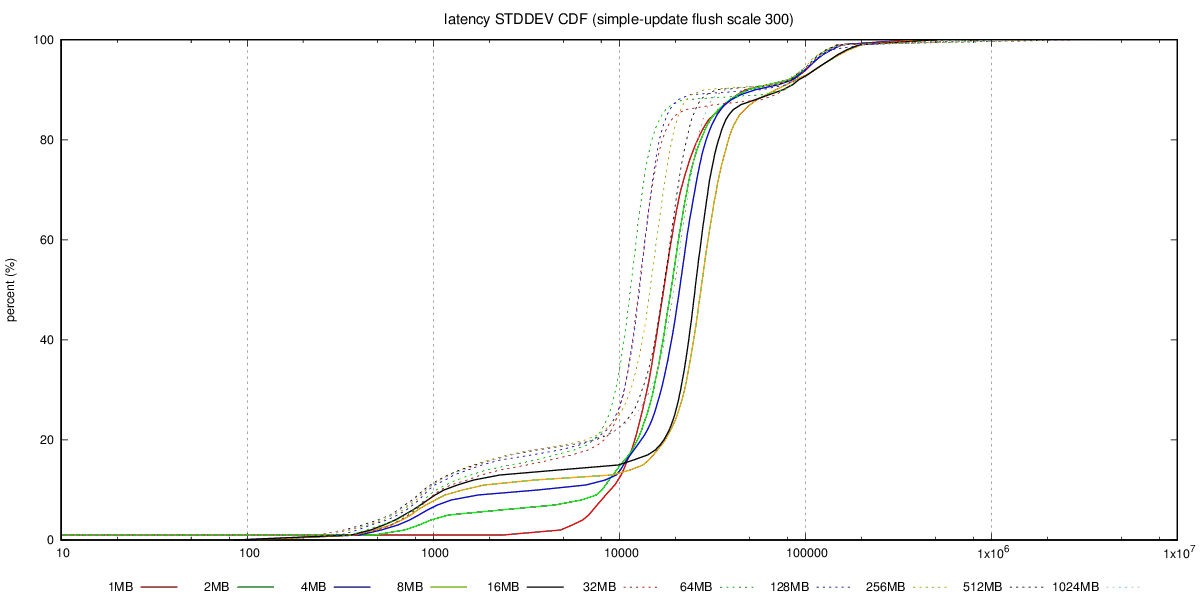
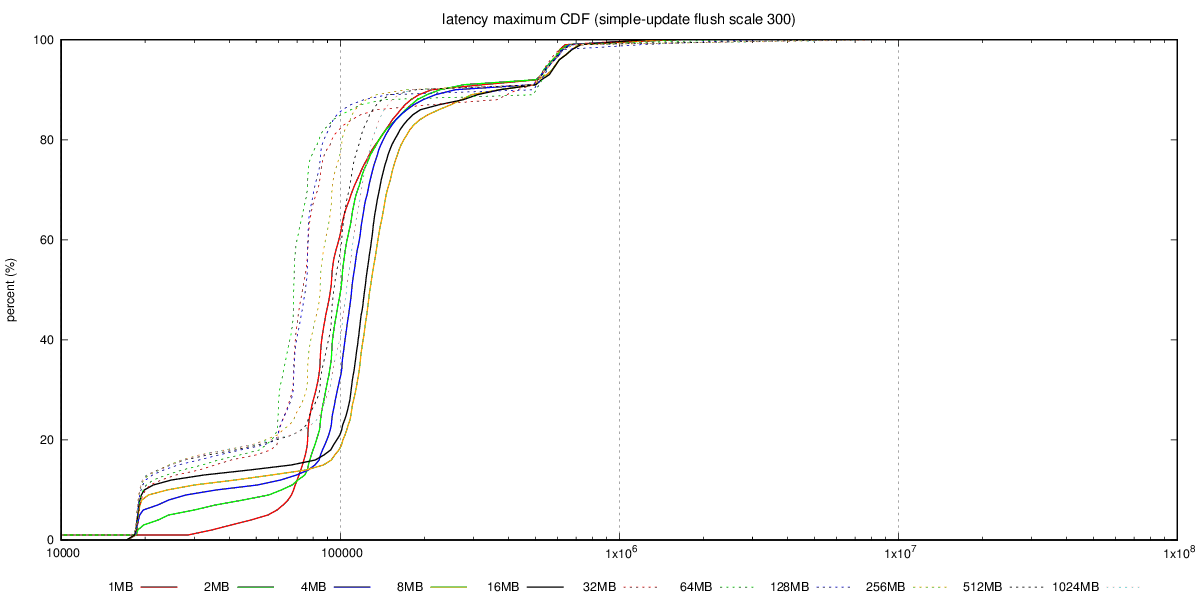
Hi,

On 08/15/2017 03:37 AM, Andres Freund wrote:
> Hi,
>
> Thanks for running this!
>
> On 2017-08-15 03:27:00 +0200, Tomas Vondra wrote:
>> Granted - this chart does not show latency, so it's not a complete
>> picture.
>
> That'd be quite useful to see here, too.
>

Unfortunately I don't have the detailed transaction log, with latencies
for individual transactions - that would be an order of magnitude more
of data, so I decided not to collect that for the initial tests. I'm
willing to collect that info for a smaller subset of the tests, though,
so if you can pick a few combinations that you find interesting, I'll
get that running.

What I have collected is the aggregated transaction log, with 1-second
resolution, i.e. for each second we have TPS, min/max latency, sum(lat)
and sum(lat*lat), etc. The best way to summarize this is CDF chart, I
think, and I have already generated those into the git repository.

See for example this, with charts for the SATA RAID case:

https://github.com/tvondra/wal-segment-size-tests/tree/master/xeon-e5-2620v4-sata-raid/simple-update/300/flush

The latency-max-cdf.png shows max(latency) for the 14400 samples (each
second of the 4-hour run), latency-stddev-cdf.png shows STDDEV(latency).
It's not perfect, but better than nothing.

Reading CDF charts is not difficult - essentially lines 'above' other
lines are better, as it shows most values are lower (which is what we
want both for latency and stddev).

>
>> Also, if you care about raw OLTP performance you're probably
>> already running on flash, where this does not seem to be an issue.
>> It's also not an issue if you have RAID controller with write
>> cache, which can absorb those writes. And of course, those
>> machines have reasonable dirty_background_bytes values (like 64MB
>> or less).
>
> The problem is that dirty_background_bytes = 64MB is *not* actually
> a generally reasonable config, because it makes temp table, disk
> sort, etc operations flush way too aggressively.
>

That is a good point. I with we could set amount of dirty data per
filesystem, that would make configuring this so much simpler ...

>
>> b) The "flushing enabled" case seems to be much more sensitive to
>> WAL segment size increases. It seems the throughput drops a bit (by
>> 10-20%), for some segment sizes, and then recovers. The behavior
>> seems to be smooth (not just a sudden drop for one segment size)
>> but the value varies depending on the scale, test type (tpc-b
>> /simple-update).
>
> That's interesting.  I presume you've not tested with separate data /
> xlog disks?
>

No, mostly because of lack of time / additional complexity. But I'm
willing to repeat some of the tests in a more complex setup. Perhaps you
can recommend which test to rerun?

regards

--
Tomas Vondra                  http://www.2ndQuadrant.com
PostgreSQL Development, 24x7 Support, Remote DBA, Training & Services

--
Sent via pgsql-hackers mailing list (pgsql-hackers@postgresql.org)
To make changes to your subscription:
http://www.postgresql.org/mailpref/pgsql-hackers