Re: [HACKERS] measuring the impact of increasing WAL segment size
| От | Tomas Vondra |
|---|---|
| Тема | Re: [HACKERS] measuring the impact of increasing WAL segment size |
| Дата | |
| Msg-id | c543aacb-5205-e88a-9275-360baf764930@2ndquadrant.com обсуждение |
| Ответ на | Re: [HACKERS] measuring the impact of increasing WAL segment size (Andres Freund <andres@anarazel.de>) |
| Список | pgsql-hackers |
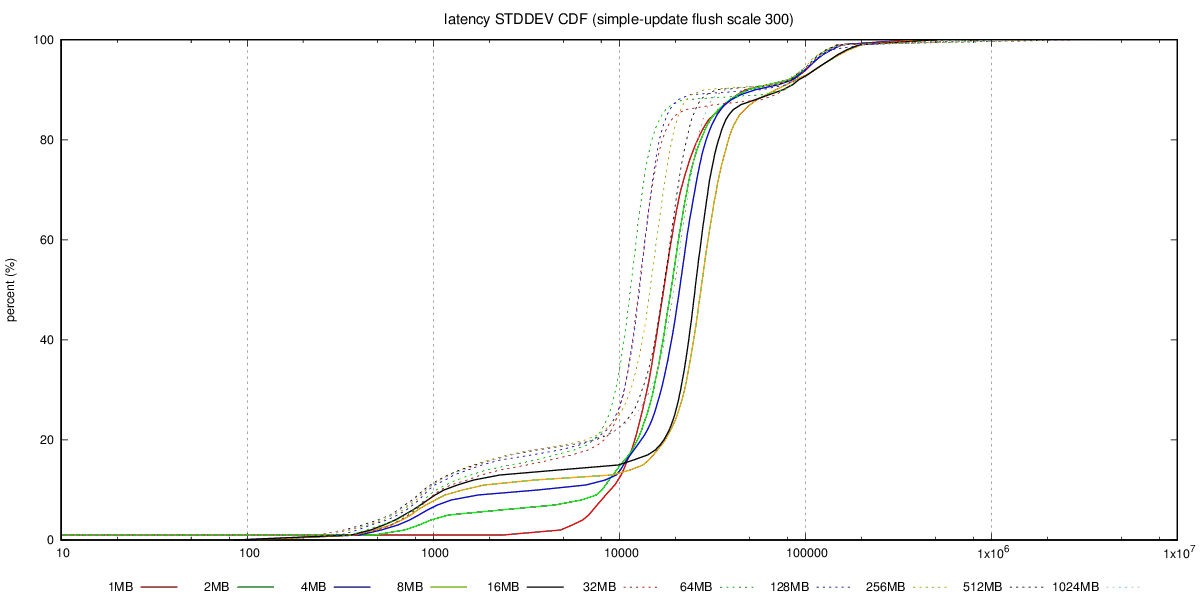
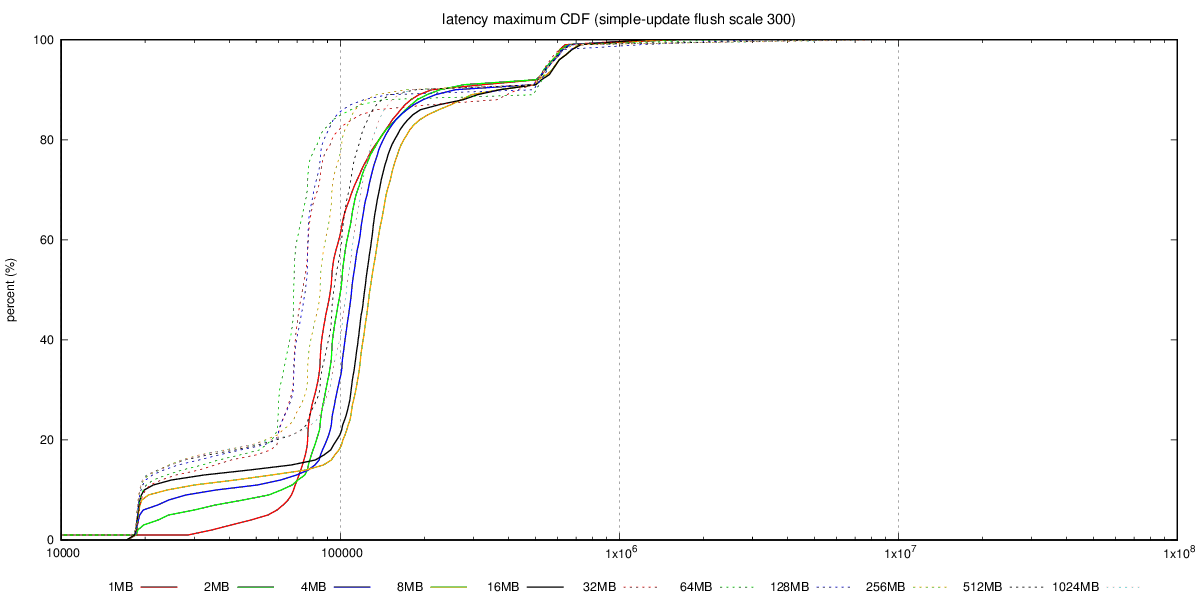
Hi,

On 08/15/2017 03:37 AM, Andres Freund wrote:
> Hi,
>
> Thanks for running this!
>
> On 2017-08-15 03:27:00 +0200, Tomas Vondra wrote:
>> Granted - this chart does not show latency, so it's not a complete
>> picture.
>
> That'd be quite useful to see here, too.
>

Unfortunately I don't have the detailed transaction log, with latencies
for individual transactions - that would be an order of magnitude more
of data, so I decided not to collect that for the initial tests. I'm
willing to collect that info for a smaller subset of the tests, though,
so if you can pick a few combinations that you find interesting, I'll
get that running.

What I have collected is the aggregated transaction log, with 1-second
resolution, i.e. for each second we have TPS, min/max latency, sum(lat)
and sum(lat*lat), etc. The best way to summarize this is CDF chart, I
think, and I have already generated those into the git repository.

See for example this, with charts for the SATA RAID case:

https://github.com/tvondra/wal-segment-size-tests/tree/master/xeon-e5-2620v4-sata-raid/simple-update/300/flush

The latency-max-cdf.png shows max(latency) for the 14400 samples (each
second of the 4-hour run), latency-stddev-cdf.png shows STDDEV(latency).
It's not perfect, but better than nothing.

Reading CDF charts is not difficult - essentially lines 'above' other
lines are better, as it shows most values are lower (which is what we
want both for latency and stddev).

>
>> Also, if you care about raw OLTP performance you're probably
>> already running on flash, where this does not seem to be an issue.
>> It's also not an issue if you have RAID controller with write
>> cache, which can absorb those writes. And of course, those
>> machines have reasonable dirty_background_bytes values (like 64MB
>> or less).
>
> The problem is that dirty_background_bytes = 64MB is *not* actually
> a generally reasonable config, because it makes temp table, disk
> sort, etc operations flush way too aggressively.
>

That is a good point. I with we could set amount of dirty data per
filesystem, that would make configuring this so much simpler ...

>
>> b) The "flushing enabled" case seems to be much more sensitive to
>> WAL segment size increases. It seems the throughput drops a bit (by
>> 10-20%), for some segment sizes, and then recovers. The behavior
>> seems to be smooth (not just a sudden drop for one segment size)
>> but the value varies depending on the scale, test type (tpc-b
>> /simple-update).
>
> That's interesting.  I presume you've not tested with separate data /
> xlog disks?
>

No, mostly because of lack of time / additional complexity. But I'm
willing to repeat some of the tests in a more complex setup. Perhaps you
can recommend which test to rerun?

regards

--
Tomas Vondra                  http://www.2ndQuadrant.com
PostgreSQL Development, 24x7 Support, Remote DBA, Training & Services

--
Sent via pgsql-hackers mailing list (pgsql-hackers@postgresql.org)
To make changes to your subscription:
http://www.postgresql.org/mailpref/pgsql-hackers
Вложения
В списке pgsql-hackers по дате отправления: