Обсуждение: Searching for the cause of a bad plan
Hi all,

Postgres version: 8.2.4

Tables:

table_a(a bigint, b bigint, primary key(a, b) );

table_b1(b bigint primary key, more columns...);

table_b2(b bigint primary key references table_b1(b), more columns...);

table_b1:
 ~ 27M rows;
 ~25 more columns;
 width=309 (as reported by explain select *);

table_a:
 ~400M rows;
 - column "b" should reference table_b1, but it does not for performance
reasons (it is an insert only table);
 - column "a" distinct values: 1148
 - has (a, b) as primary key;
 - has no additional columns;

table_b1:
 ~40K rows;
 ~70 more columns;
 width=1788 (as reported by explain select *);

Statistics for the involved columns for each table are attached in files
(to preserve the spacing). They were taken after analyzing the relevant
table (except for table_b2 where I added the "fiddled" statistics first
and then remembered to analyze fresh, resulting in the "non_fiddled"
version, which gives the same result as the fiddled one).

The problem query is:

prepare test_001(bigint) as
SELECT tb.*
FROM table_a ta
JOIN table_b2 tb ON ta.b=tb.b
WHERE ta.a = $1
ORDER BY ta.a, ta.b
limit 10;

Explain gives Plan 1 (see attached plans.txt)

If I set enable_hashjoin=off and enable_mergejoin=off, I get Plan 2
(again, see plans.txt).

The difference is a 30x improvement in the second case...
(I actually forgot to account for cache effects, but later rerun the
queries multiple times and the timings are proportional).

Additionally, if I replace table_b2 with table_b1 in the query, I get
Plan 3 (with reasonable execution time) with both enable_hashjoin and
enable_mergejoin on. So there is something which makes table_b2
different from table_b1 for planning purposes, but I could not identify
what that is... they have differences in statistics, but fiddling with
the stats gave me no difference in the plan.

Looking at Plan 2, it looks like the "limit" step is estimating wrongly
it's cost. I guessed that it does that because it thinks the "b" values
selected from table_a for a given "a" span a larger range than the "b"
values in table_b2, because the "b" values in table_b2 are a (relatively
small) subset of the "b" values in table_a. But this is not the case,
the query only gets "a" values for which all the "b" values in table_a
will be found in table_b2. Of course the planner has no way to know
this, but then I think it is not the case, as I tried to copy the
histogram statistics in pg_statistic for the column "b" from the entry
for table_b1 (which contains the whole span of "b" values) to the entry
for table_b2, with no change in the plan.

Just for the record, this query is just a part of a more complex one,
which joins in bigger tables, resulting in even worse performance, but I
tracked it down to refusing the nested loop to be the problem.

Is there anything I could do to convince the planner to use here the
nested loop plan ?

Thanks,
Csaba.
Вложения
On Fri, 2007-09-21 at 12:03 +0200, Csaba Nagy wrote:
> prepare test_001(bigint) as
> SELECT tb.*
> FROM table_a ta
> JOIN table_b2 tb ON ta.b=tb.b
> WHERE ta.a = $1
> ORDER BY ta.a, ta.b
> limit 10;

Please re-run everything on clean tables without frigging the stats. We
need to be able to trust what is happening is normal.

Plan2 sees that b1 is wider, which will require more heap blocks to be
retrieved. It also sees b1 is less correlated than b2, so again will
require more database blocks to retrieve. Try increasing
effective_cache_size.

Can you plans with/without LIMIT and with/without cursor, for both b1
and b2?

--
  Simon Riggs
  2ndQuadrant  http://www.2ndQuadrant.com
On Fri, 2007-09-21 at 11:59 +0100, Simon Riggs wrote:
> Please re-run everything on clean tables without frigging the stats. We
> need to be able to trust what is happening is normal.

I did, the plan fiddling happened after getting the plans after a fresh
analyze, and I did run the plan again with fresh analyze just before
sending the mail and the plan was the same. In fact I spent almost 2
days playing with the query which is triggering this behavior, until I
tracked it down to this join. Thing is that we have many queries which
rely on this join, so it is fairly important that we understand what
happens there.

> Plan2 sees that b1 is wider, which will require more heap blocks to be
> retrieved. It also sees b1 is less correlated than b2, so again will
> require more database blocks to retrieve. Try increasing
> effective_cache_size.

effective_cach_size is set to ~2.7G, the box has 4G memory. I increased
it now to 3,5G but it makes no difference. I increased it further to 4G,
no difference again.

> Can you plans with/without LIMIT and with/without cursor, for both b1
> and b2?

The limit is unfortunately absolutely needed part of the query, it makes
no sense to try without. If it would be acceptable to do it without the
limit, then it is entirely possible that the plan I get now would be
indeed better... but it is not acceptable.

Thanks,
Csaba.
On Fri, 2007-09-21 at 13:29 +0200, Csaba Nagy wrote:

> > Can you plans with/without LIMIT and with/without cursor, for both b1
> > and b2?
>
> The limit is unfortunately absolutely needed part of the query

Understood, but not why I asked...

--
  Simon Riggs
  2ndQuadrant  http://www.2ndQuadrant.com
On Fri, 2007-09-21 at 12:34 +0100, Simon Riggs wrote:
> On Fri, 2007-09-21 at 13:29 +0200, Csaba Nagy wrote:
>
> > > Can you plans with/without LIMIT and with/without cursor, for both b1
> > > and b2?
> >
> > The limit is unfortunately absolutely needed part of the query
>
> Understood, but not why I asked...
>
Well, the same query without limit goes:

dbdop=# explain execute test_001(31855344);
                                                 QUERY
PLAN
------------------------------------------------------------------------------------------------------------
 Sort  (cost=322831.85..322831.94 rows=36 width=1804)
   Sort Key: ta.a, ta.b
   ->  Hash Join  (cost=3365.60..322830.92 rows=36 width=1804)
         Hash Cond: (ta.b = tb.b)
         ->  Index Scan using pk_table_a on table_a ta
(cost=0.00..314541.78 rows=389648 width=16)
               Index Cond: (a = $1)
         ->  Hash  (cost=524.71..524.71 rows=41671 width=1788)
               ->  Seq Scan on table_b2 tb  (cost=0.00..524.71
rows=41671 width=1788)


I'm not sure what you mean without cursor, maybe not using prepare ?
Well we set up the JDBC driver to always prepare the queries, as this
gives us much better worst case plans than when letting postgres see the
parameter values, especially in queries with limit. So I simulate that
when explaining the behavior we see. All our limit queries are for
interactive display, so the worst case is of much higher importance for
us than the mean execution time... unfortunately postgres has a tendency
to take the best mean performance path than avoid worst case, and it is
not easy to convince it otherwise.

Cheers,
Csaba.
On Fri, 2007-09-21 at 14:12 +0200, Csaba Nagy wrote:
> On Fri, 2007-09-21 at 12:34 +0100, Simon Riggs wrote:
> > On Fri, 2007-09-21 at 13:29 +0200, Csaba Nagy wrote:
> >
> > > > Can you plans with/without LIMIT and with/without cursor, for both b1
> > > > and b2?
> > >
> > > The limit is unfortunately absolutely needed part of the query
> >
> > Understood, but not why I asked...
> >
> Well, the same query without limit goes:

OK, thanks.

> I'm not sure what you mean without cursor, maybe not using prepare ?

Sorry, misread that.

=======================

I think I understand now: The cost of the LIMIT is being applied, but in
slightly the wrong way. The cost of the Nested Loop node is reduced by
the fraction of LIMIT/(number of expected rows), which is only an
approximation of what we're doing. In Plan 2 this leads to the wildly
wrong estimate that each row costs 49,851 cost units to retrieve, which
is about x50 wrong. In Plan 3 that approximation leads to a more
reasonable cost, so this works in Plan 3, but doesn't in Plan 2.

What we should do is push down the effect of the LIMIT so that the cost
of the Index Scan on ta reflects the fact that it returns only 10 rows.
It correctly expects 388638 rows that match the value requested, but it
is not retrieving all of them. The executor handles the query
efficiently but the cost model doesn't reflect what the executor
actually does and so we pick the wrong plan. Pushing down the LIMIT
would only be possible when LIMIT has a constant value at plan time, but
that seems like most of the time to my eyes.

The plan estimates should look like this for Plan 2 (marked **)

 Limit  (cost=0.00..XXXX rows=10 width=1804)
   ->  Nested Loop  (cost=0.00..XXXXX rows=10 width=1804)
         ->  Index Scan using pk_table_a on table_a ta
(cost=0.00..**11.96** rows=**10** width=16)
               Index Cond: (a = $1)
         ->  Index Scan using pk_table_b2 on table_b2 tb
(cost=0.00..3.77 rows=1 width=1788)
               Index Cond: (ta.b = tb.b)

Incidentally, the way out of this is to improve the stats by setting
stats target = 1000 on column a of ta. That will allow the optimizer to
have a better estimate of the tail of the distribution of a, which
should then be more sensibly reflected in the cost of the Index Scan.
That doesn't solve the actual problem, but should help in your case.

Plans copied below for better clarity:


Plan 2:

db> explain analyze execute test_001(31855344);

QUERY
PLAN

------------------------------------------------------------------------------------------------------------------------------------------------------
 Limit  (cost=0.00..498511.80 rows=10 width=1804) (actual
time=17.729..21.672 rows=2 loops=1)
   ->  Nested Loop  (cost=0.00..1794642.48 rows=36 width=1804) (actual
time=17.729..21.671 rows=2 loops=1)
         ->  Index Scan using pk_table_a on table_a ta
(cost=0.00..324880.88 rows=388638 width=16) (actual time=0.146..0.198
rows=2 loops=1)
               Index Cond: (a = $1)
         ->  Index Scan using pk_table_b2 on table_b2 tb
(cost=0.00..3.77 rows=1 width=1788) (actual time=10.729..10.731 rows=1
loops=2)
               Index Cond: (ta.b = tb.b)
 Total runtime: 21.876 ms


Plan 3:

db> explain analyze execute test_001(31855344);

QUERY
PLAN

------------------------------------------------------------------------------------------------------------------------------------------------------
 Limit  (cost=0.00..853.14 rows=10 width=325) (actual
time=20.117..28.104 rows=2 loops=1)
   ->  Nested Loop  (cost=0.00..2024323.48 rows=23728 width=325) (actual
time=20.116..28.101 rows=2 loops=1)
         ->  Index Scan using pk_table_a on table_a ta
(cost=0.00..327561.01 rows=388684 width=16) (actual time=0.023..0.027
rows=2 loops=1)
               Index Cond: (a = $1)
         ->  Index Scan using pk_table_b1 on table_b1 tb
(cost=0.00..4.35 rows=1 width=309) (actual time=14.032..14.034 rows=1
loops=2)
               Index Cond: (ta.b = tb.b)
 Total runtime: 28.200 ms


--
  Simon Riggs
  2ndQuadrant  http://www.2ndQuadrant.com
[snip]

Ok, I was not able to follow your explanation, it's too deep for me into
what the planner does...

> Incidentally, the way out of this is to improve the stats by setting
> stats target = 1000 on column a of ta. That will allow the optimizer to
> have a better estimate of the tail of the distribution of a, which
> should then be more sensibly reflected in the cost of the Index Scan.
> That doesn't solve the actual problem, but should help in your case.

OK, I can confirm that. I set the statistics target for column "a" on
table_a to 1000, analyzed, and got the plan below. The only downside is
that analyze became quite expensive on table_a, it took 15 minutes and
touched half of the pages... I will experiment with lower settings,
maybe it will work with less than 1000 too.

db> explain analyze execute test_001(31855344);

QUERY
PLAN

------------------------------------------------------------------------------------------------------------------------------------------------------
 Limit  (cost=0.00..4499.10 rows=10 width=1804) (actual
time=103.566..120.363 rows=2 loops=1)
   ->  Nested Loop  (cost=0.00..344630.97 rows=766 width=1804) (actual
time=103.563..120.359 rows=2 loops=1)
         ->  Index Scan using pk_table_a on table_a ta
(cost=0.00..67097.97 rows=78772 width=16) (actual time=71.965..77.284
rows=2 loops=1)
               Index Cond: (a = $1)
         ->  Index Scan using pk_table_b2 on table_b2 tb
(cost=0.00..3.51 rows=1 width=1788) (actual time=21.526..21.528 rows=1
loops=2)
               Index Cond: (ta.b = tb.b)
 Total runtime: 120.584 ms

Thanks,
Csaba.
> OK, I can confirm that. I set the statistics target for column "a" on
> table_a to 1000, analyzed, and got the plan below. The only downside is
> that analyze became quite expensive on table_a, it took 15 minutes and
> touched half of the pages... I will experiment with lower settings,
> maybe it will work with less than 1000 too.

So, just to finish this up: setting statistics to 100 worked too, and it
has an acceptable impact on analyze. My original (more complicated)
query is working fine now, with visible effects on server load...

Thanks Simon for your help !

Cheers,
Csaba.
Csaba Nagy <nagy@ecircle-ag.com> writes:
> Looking at Plan 2, it looks like the "limit" step is estimating wrongly
> it's cost.

The reason you get a bad plan is that this rowcount estimate is so far
off:

>                ->  Index Scan using pk_table_a on table_a ta  (cost=0.00..324786.18 rows=388532 width=16) (actual
time=454.389..460.138rows=2 loops=1)
>                      Index Cond: (a = $1)

Raising the stats target helped no doubt because it didn't overestimate
the number of rows so much...

            regards, tom lane
On Fri, 2007-09-21 at 16:26 +0200, Csaba Nagy wrote:
> [snip]
>
> Ok, I was not able to follow your explanation, it's too deep for me into
> what the planner does...

I'm thinking that this case is too narrow to do too much with, when I
think about how we might do what I proposed. OTOH this isn't the first
bad plan we've had because we used the index for ordering. There might
be some common link that we can improve upon.

> > Incidentally, the way out of this is to improve the stats by setting
> > stats target = 1000 on column a of ta. That will allow the optimizer to
> > have a better estimate of the tail of the distribution of a, which
> > should then be more sensibly reflected in the cost of the Index Scan.
> > That doesn't solve the actual problem, but should help in your case.
>
> OK, I can confirm that. I set the statistics target for column "a" on
> table_a to 1000, analyzed, and got the plan below. The only downside is
> that analyze became quite expensive on table_a, it took 15 minutes and
> touched half of the pages... I will experiment with lower settings,
> maybe it will work with less than 1000 too.

Well, we know there are ways of optimizing ANALYZE.

ISTM we should be able to auto-select stats target based upon the shape
of the frequency distribution of the column values. We'd need to make
some calculations about the index cost model, but its probably worth it
for the future.

--
  Simon Riggs
  2ndQuadrant  http://www.2ndQuadrant.com
On Fri, 2007-09-21 at 12:08 -0400, Tom Lane wrote:
> Csaba Nagy <nagy@ecircle-ag.com> writes:
> > Looking at Plan 2, it looks like the "limit" step is estimating wrongly
> > it's cost.
>
> The reason you get a bad plan is that this rowcount estimate is so far
> off:

That's true, but its not relevant, since the query would still be fast
even if that estimate was exactly right. With LIMIT 10, it wouldn't
matter how many rows were there as long as there were more than 10. The
true execution cost is limited, the cost model is not.

--
  Simon Riggs
  2ndQuadrant  http://www.2ndQuadrant.com
Simon Riggs <simon@2ndquadrant.com> writes:
> On Fri, 2007-09-21 at 12:08 -0400, Tom Lane wrote:
>> The reason you get a bad plan is that this rowcount estimate is so far
>> off:

> That's true, but its not relevant,

Yes it is --- the reason it wants to use a hashjoin instead of a
nestloop is exactly that it thinks the loop would iterate too many
times.  (Ten is already too many in this case --- if it had estimated
five rows out of the join, it'd have gone with the nestloop, since
the cost estimate difference at the top level is less than 2x.)

            regards, tom lane
On Fri, 2007-09-21 at 13:53 -0400, Tom Lane wrote:
> Simon Riggs <simon@2ndquadrant.com> writes:
> > On Fri, 2007-09-21 at 12:08 -0400, Tom Lane wrote:
> >> The reason you get a bad plan is that this rowcount estimate is so far
> >> off:
>
> > That's true, but its not relevant,
>
> Yes it is --- the reason it wants to use a hashjoin instead of a
> nestloop is exactly that it thinks the loop would iterate too many
> times.  (Ten is already too many in this case --- if it had estimated
> five rows out of the join, it'd have gone with the nestloop, since
> the cost estimate difference at the top level is less than 2x.)

That's not my perspective. If the LIMIT had been applied accurately to
the cost then the hashjoin would never even have been close to the
nested join in the first place. It's just chance that the frequency
distribution is favourable to us and thus amenable to using the hint of
improving stats_target. The improved knowledge of the distribution just
hides the fact that the cost model is still wrong: a cost of 45000 per
row shows this.

--
  Simon Riggs
  2ndQuadrant  http://www.2ndQuadrant.com
Simon Riggs <simon@2ndquadrant.com> writes:
> That's not my perspective. If the LIMIT had been applied accurately to
> the cost then the hashjoin would never even have been close to the
> nested join in the first place.

[ shrug... ]  Your perspective is mistaken.  There is nothing wrong with
the way the LIMIT estimation is being done.  The plan in question was

Limit  (cost=0.00..498511.80 rows=10 width=1804) (actual time=17.729..21.672 rows=2 loops=1)
   ->  Nested Loop  (cost=0.00..1794642.48 rows=36 width=1804) (actual time=17.729..21.671 rows=2 loops=1)
         ->  Index Scan using pk_table_a on table_a ta  (cost=0.00..324880.88 rows=388638 width=16) (actual
time=0.146..0.198rows=2 loops=1)
               Index Cond: (a = $1)
         ->  Index Scan using pk_table_b2 on table_b2 tb  (cost=0.00..3.77 rows=1 width=1788) (actual
time=10.729..10.731rows=1 loops=2)
               Index Cond: (ta.b = tb.b)
 Total runtime: 21.876 ms

and there are two fairly serious estimation errors here, neither related
at all to the LIMIT:

* five-orders-of-magnitude overestimate of the number of table_a rows
that will match the condition on a;

* enormous underestimate of the number of join rows --- it's apparently
thinking only 0.0001 of the table_a rows will have a join partner,
whereas at least for this case they all do.

Had the latter estimate been right, the cost of pulling results this
way would indeed have been something like 50K units per joined row,
because of the large number of inner index probes per successful join.

It might be interesting to look into why those estimates are so far
off; the stats Csaba displayed don't seem to have any obvious oddity
that would justify such bizarre results.  But the LIMIT has got
nothing to do with this.

            regards, tom lane
On Fri, 2007-09-21 at 19:30 -0400, Tom Lane wrote:
> Simon Riggs <simon@2ndquadrant.com> writes:
> > That's not my perspective. If the LIMIT had been applied accurately to
> > the cost then the hashjoin would never even have been close to the
> > nested join in the first place.
>
> [ shrug... ]  Your perspective is mistaken.  There is nothing wrong with
> the way the LIMIT estimation is being done.  The plan in question was
>
> Limit  (cost=0.00..498511.80 rows=10 width=1804) (actual time=17.729..21.672 rows=2 loops=1)
>    ->  Nested Loop  (cost=0.00..1794642.48 rows=36 width=1804) (actual time=17.729..21.671 rows=2 loops=1)
>          ->  Index Scan using pk_table_a on table_a ta  (cost=0.00..324880.88 rows=388638 width=16) (actual
time=0.146..0.198rows=2 loops=1)
>                Index Cond: (a = $1)
>          ->  Index Scan using pk_table_b2 on table_b2 tb  (cost=0.00..3.77 rows=1 width=1788) (actual
time=10.729..10.731rows=1 loops=2)
>                Index Cond: (ta.b = tb.b)
>  Total runtime: 21.876 ms
>
> and there are two fairly serious estimation errors here, neither related
> at all to the LIMIT:
>
> * five-orders-of-magnitude overestimate of the number of table_a rows
> that will match the condition on a;

I don't see any problem with this estimate, but I do now agree there is
a problem with the other estimate.

We check to see if the value is an MFV, else we assume that the
distribution is uniformly distributed across the histogram bucket.

Csaba provided details of the fairly shallow distribution of values of a
in table_a. 96% of rows aren't covered by the MFVs, so its a much
shallower distribution than is typical, but still easily possible. So
based upon what we know there should be ~330,000 rows with the value of
a used for the EXPLAIN.

So it looks to me like we did the best we could with the available
information, so I can't see that as a planner problem per se. We cannot
do better a priori without risking worse plans in other circumstances.

> * enormous underestimate of the number of join rows --- it's apparently
> thinking only 0.0001 of the table_a rows will have a join partner,
> whereas at least for this case they all do.

OK, I agree this estimate does have a problem and it has nothing to do
with LIMIT.

Looking at the code I can't see how this selectivity can have been
calculated. AFAICS eqjoinsel() gives a selectivity of 1.0 using the data
supplied by Csaba and it ought to cover this case reasonably well.

Csaba, please can you copy that data into fresh tables, re-ANALYZE and
then re-post the EXPLAINs, with stats data.

--
  Simon Riggs
  2ndQuadrant  http://www.2ndQuadrant.com
On Mon, 2007-09-24 at 14:27 +0100, Simon Riggs wrote:
> Csaba, please can you copy that data into fresh tables, re-ANALYZE and
> then re-post the EXPLAINs, with stats data.

Well, I can of course. I actually tried to generate some random data
with similar record count and relations between the tables (which I'm
not sure I succeeded at), without the extra columns, but it was happily
yielding the nested loop plan. So I guess I really have to copy the
whole data (several tens of GB).

But from my very limited understanding of what information is available
for the planner, I thought that the record count estimated for the join
between table_a and table_b1 on column b should be something like

(estimated record count in table_a for value "a") * (weight of "b" range
covered by table_b1 and table_a in common) / (weight of "b" range
covered by table_a)

This is if the "b" values in table_a wouldn't be correlated at all with
the content of table_b2. The reality is that they are, but the planner
has no information about that.

I have no idea how the planner works though, so this might be totally
off...

I will copy the data and send the results (not promising though that it
will be today).

Cheers,
Csaba.
On Mon, 2007-09-24 at 16:04 +0200, Csaba Nagy wrote:
> On Mon, 2007-09-24 at 14:27 +0100, Simon Riggs wrote:
> > Csaba, please can you copy that data into fresh tables, re-ANALYZE and
> > then re-post the EXPLAINs, with stats data.
>
> Well, I can of course. I actually tried to generate some random data
> with similar record count and relations between the tables (which I'm
> not sure I succeeded at), without the extra columns, but it was happily
> yielding the nested loop plan. So I guess I really have to copy the
> whole data (several tens of GB).
>
> But from my very limited understanding of what information is available
> for the planner, I thought that the record count estimated for the join
> between table_a and table_b1 on column b should be something like
>
> (estimated record count in table_a for value "a") * (weight of "b" range
> covered by table_b1 and table_a in common) / (weight of "b" range
> covered by table_a)

There's no such code I'm aware of. Sounds a good idea though. I'm sure
we could do something with the histogram values, but we don't in the
default selectivity functions.

--
  Simon Riggs
  2ndQuadrant  http://www.2ndQuadrant.com
> Csaba, please can you copy that data into fresh tables, re-ANALYZE and
> then re-post the EXPLAINs, with stats data.

Here you go, fresh experiment attached.

Cheers,
Csaba.
Вложения
Csaba Nagy <nagy@ecircle-ag.com> writes:
> db=# analyze verbose temp_table_a;
> INFO:  analyzing "public.temp_table_a"
> INFO:  "temp_table_a": scanned 3000 of 655299 pages, containing 1887000 live rows and 0 dead rows; 3000 rows in
sample,412183071 estimated total rows

Hmm.  So the bottom line here is probably that that's not a big enough
sample to derive a realistic n_distinct value.  Or maybe it is ... how
many values of "a" are there really, and what's the true distribution of
counts?  Do the plan estimates get closer to reality if you set a higher
statistics target?

            regards, tom lane
On Wed, 2007-09-26 at 11:22 -0400, Tom Lane wrote:
> ... how
> many values of "a" are there really, and what's the true distribution of
> counts?
table_a has 23366 distinct values. Some statistics (using R):
> summary(table_a_histogram)
a count
Min. : 70000857 Min. : 1
1st Qu.:700003628 1st Qu.: 9
Median :700011044 Median : 22
Mean :622429573 Mean : 17640
3rd Qu.:700018020 3rd Qu.: 391
Max. :800003349 Max. :3347707
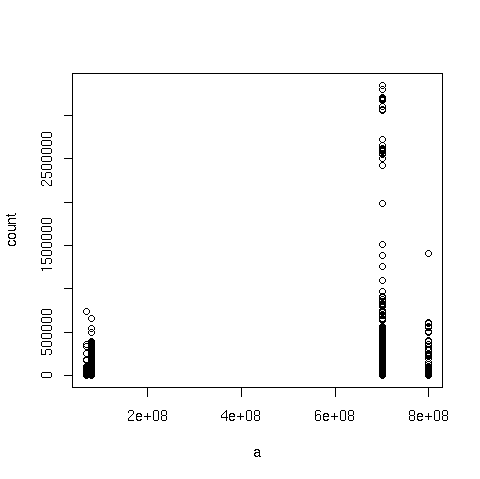
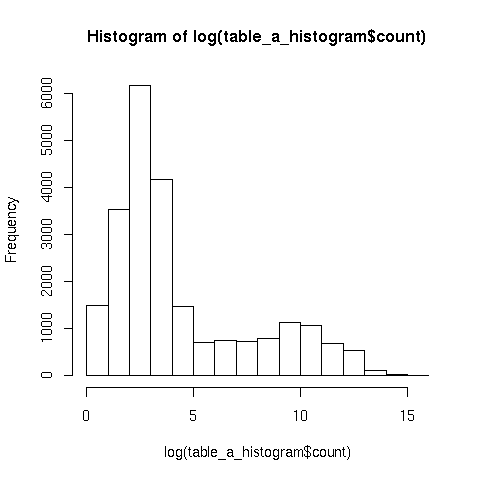
I'm not sure what you want to see in terms of distribution of counts, so
I created 2 plots: "a" against the counts for each distinct "a" value,
and the histogram of the log of the counts (without the log it's not
really readable). I hope they'll make it through to the list...
> Do the plan estimates get closer to reality if you set a higher
> statistics target?
The results of setting higher statistics targets are attached too. I
can't tell if the stats are closer to reality or not, but the plan
changes in any case...
Cheers,
Csaba.
Вложения
Csaba Nagy <nagy@ecircle-ag.com> writes:
> On Wed, 2007-09-26 at 11:22 -0400, Tom Lane wrote:
>> ... how
>> many values of "a" are there really, and what's the true distribution of
>> counts?

> table_a has 23366 distinct values. Some statistics (using R):

>> summary(table_a_histogram)
>        a                 count
>  Min.   : 70000857   Min.   :      1
>  1st Qu.:700003628   1st Qu.:      9
>  Median :700011044   Median :     22
>  Mean   :622429573   Mean   :  17640
>  3rd Qu.:700018020   3rd Qu.:    391
>  Max.   :800003349   Max.   :3347707

Ugh, classic long-tail distribution.  This is a really hard problem to
solve by sampling --- the sample will naturally be biased towards the
more common values, and so ANALYZE tends to conclude there are fewer
distinct values than there really are.  That means n_distinct in the
stats is too small, and that feeds directly into the misestimation of
the number of matching rows.

And yet there's another trap here: if the parameter you passed in
chanced to be one of the very common values, a plan that was optimized
for a small number of matches would perform terribly.

We've speculated about trying to deal with these types of situations
by switching plans on-the-fly at runtime, but that's just blue-sky
dreaming at the moment.  In the short run, if boosting the stats target
doesn't result in acceptable plans, there may be no real solution other
than to avoid parameterized queries on this column.

            regards, tom lane
On Thu, 2007-09-27 at 10:40 -0400, Tom Lane wrote:
> And yet there's another trap here: if the parameter you passed in
> chanced to be one of the very common values, a plan that was optimized
> for a small number of matches would perform terribly.
>
> We've speculated about trying to deal with these types of situations
> by switching plans on-the-fly at runtime, but that's just blue-sky
> dreaming at the moment.  In the short run, if boosting the stats target
> doesn't result in acceptable plans, there may be no real solution other
> than to avoid parameterized queries on this column.

Well, my problem was actually solved by rising the statistics target,
thanks to Simon for suggesting it. The problem is that it's quite hard
to tell (for a non-postgres-developer) which column needs higher
statistics target when a multi-join query doesn't work as expected...

Apropos switching plans on the fly and blue sky dreaming... IIRC, there
were some plans to cache plans in shared mode for the whole cluster, not
just per backend.

What about allowing the user to prepare a plan offline, i.e. without
actually executing it (via some variant of PREPARE CACHED or so), and
let the planner do more exhaustive cost estimation, possibly actually
analyzing specific tables for correlations etc., on the ground that the
whole thing is done only once and reused many times. The resulting plan
could also contain turning points for parameter values, which would
switch between different variants of the plan, this way it can be more
specific with parameter values even if planned generically... and it
could set up some dependencies on the relevant statistics on which it is
basing it's decisions, so it will be invalidated when those statistics
are presumably changed more than a threshold, and possibly a "background
planner" thread re-plans it, after the necessary analyze steps are run
again.

If there is a "background planner", that one could also collect "long
running query" statistics and automatically do a cached plans for the
most offending ones, and possibly generate "missing index", "you should
cluster this table" and such warnings.

The fast planner would still be needed for interactive queries which are
not yet prepared, so new interactive queries don't pay the unpredictable
cost of "hard" planning. If those run fast enough, they will never get
prepared, they don't need to... otherwise they should be passed to the
background planner to be exhaustively (or at least more thoroughly)
analyzed...

One other thing I dream of would be some way to tell postgres that a
query should run in "batch mode" or "interactive mode", i.e. it should
be optimized for best throughput or fast startup, in the second case
great care should be taken to avoid the worst case scenarios too. I know
there's a strong feeling against query hints around here, but this one
could fly using a GUC parameter, which could be set in the config file
for a default value (batch for a data warehouse, interactive for an OLTP
application), and it also could be set per session.

Ok, that's about the dreaming...

Cheers,
Csaba.
On Thu, 2007-09-27 at 10:40 -0400, Tom Lane wrote:

> And yet there's another trap here: if the parameter you passed in
> chanced to be one of the very common values, a plan that was optimized
> for a small number of matches would perform terribly.

I wonder could we move prepare_threshold onto the server? (from JDBC).

When we prepare a statement, we record the current setting of the
prepare_threshold parameter into the plan for that statement. Valid
settings are -1, 0 or more.
If the setting is -1 then we always re-plan the statement.
If the setting is 0 then we plan the statement generically.
If the setting is > 0 then we plan the statement according to the
specific parameter value and then decrement the prepare count, so
eventually the executions will hit 0 (above).

That would also simplify JDBC and allow the functionality from other
clients, as well as from within PLs.

We could also force the plan to be -1 when the planning involves
something that would force it to be a one-time plan, e.g. constraint
exclusion. (So we could then get rid of that parameter).

--
  Simon Riggs
  2ndQuadrant  http://www.2ndQuadrant.com
Csaba Nagy wrote:
>
> Well, my problem was actually solved by rising the statistics target,

Would it do more benefit than harm if postgres increased the
default_statistics_target?

I see a fair number of people (myself included) asking questions who's
resolution was to ALTER TABLE SET STATISTICS; and I think relatively
fewer (if any?) people concerned about space in pg_statistic
or people improving analyze time by reducing the statistics target.
On Thu, 2007-09-27 at 11:07 -0700, Ron Mayer wrote:
> Csaba Nagy wrote:
> >
> > Well, my problem was actually solved by rising the statistics target,
>
> Would it do more benefit than harm if postgres increased the
> default_statistics_target?
>
> I see a fair number of people (myself included) asking questions who's
> resolution was to ALTER TABLE SET STATISTICS; and I think relatively
> fewer (if any?) people concerned about space in pg_statistic
> or people improving analyze time by reducing the statistics target.

Well, the cost of raising the statistics target is far from zero: with
all defaults the analyze time was ~ 10 seconds, with one column set to
100 was ~ 1.5 minutes, with one column set to 1000 was 15 minutes for
the table in question (few 100M rows). Of course the IO load must have
been proportional to the timings... so I'm pretty sure the current
default is serving well most of the situations.

Cheers,
Csaba.
> Just an idea, but with the 8.3 concurrent scan support would it be
> possible to hang a more in depth analyze over exisiting sequential
> scans. Then it would be a lower cost to have higher resolution in
> the statistics because the I/O component would be hidden.

The biggest problem with that is that it wouldn't be deterministic...
the table in question from my original post is never scanned
sequentially in normal operation. The other way around is also possible,
when sequential scans are too frequent, in that case you wouldn't want
to also analyze all the time. So there would be a need for logic of when
to analyze or not with a sequential scan and when do it proactively
without waiting for one... and I'm not sure it will be worth the
complexity.

I think it would me much more productive if some "long running query"
tracking combined with a "background planner" thread would do targeted
analyzes for specific correlations/distributions/conditions based on
what queries are actually running on the system.

Cheers,
Csaba.