On Wed, 2007-09-26 at 11:22 -0400, Tom Lane wrote:
> ... how
> many values of "a" are there really, and what's the true distribution of
> counts?
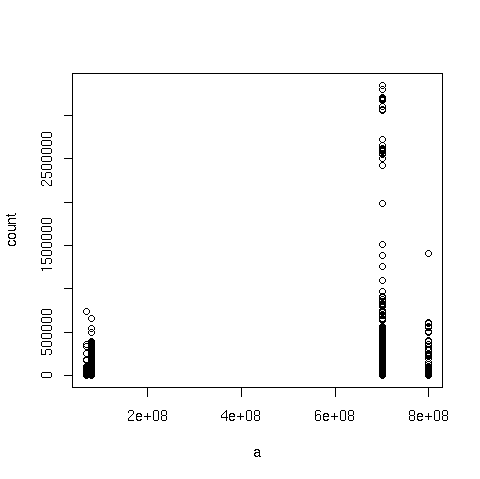
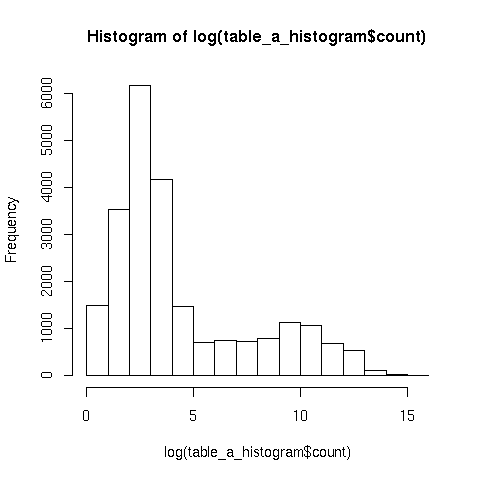
table_a has 23366 distinct values. Some statistics (using R):
> summary(table_a_histogram)
a count
Min. : 70000857 Min. : 1
1st Qu.:700003628 1st Qu.: 9
Median :700011044 Median : 22
Mean :622429573 Mean : 17640
3rd Qu.:700018020 3rd Qu.: 391
Max. :800003349 Max. :3347707
I'm not sure what you want to see in terms of distribution of counts, so
I created 2 plots: "a" against the counts for each distinct "a" value,
and the histogram of the log of the counts (without the log it's not
really readable). I hope they'll make it through to the list...
> Do the plan estimates get closer to reality if you set a higher
> statistics target?
The results of setting higher statistics targets are attached too. I
can't tell if the stats are closer to reality or not, but the plan
changes in any case...
Cheers,
Csaba.