Обсуждение: PATCH: graphical explain
Hi,
PFA the patch for graphical explain feature.
It consists of explain.js, __init__.py and demo_explain.html, snap_svg.js and snap_svg-min.js file.
Currently I have placed hard coded JSON data in demo_explain.html file to display graphical output; which will be replace by actual output user get from server in JSON format.
Use below URL to access graphical output:
http://localhost:5050/misc/explain where 5050 is the port your web server is running on
To test the patch, user can replace plan data (stored in 'data' variable) in demo_explain.html with other valid plan data in JSON format and run the above URL.
Please review the patch and provide comments for the same.
TODO: Integration of graphical explain into sql editor
Regards,
Sanket Mehta
Sr Software engineer
Enterprisedb
Вложения
Hi,
Please do ignore previous patch as it contains trailing whitespaces.
PFA the revised patch after resolving this issue.
Regards,
Sanket Mehta
Sr Software engineer
Enterprisedb
On Mon, Apr 11, 2016 at 10:04 PM, Sanket Mehta <sanket.mehta@enterprisedb.com> wrote:
Hi,PFA the patch for graphical explain feature.It consists of explain.js, __init__.py and demo_explain.html, snap_svg.js and snap_svg-min.js file.Currently I have placed hard coded JSON data in demo_explain.html file to display graphical output; which will be replace by actual output user get from server in JSON format.Use below URL to access graphical output:http://localhost:5050/misc/explain where 5050 is the port your web server is running onTo test the patch, user can replace plan data (stored in 'data' variable) in demo_explain.html with other valid plan data in JSON format and run the above URL.Please review the patch and provide comments for the same.TODO: Integration of graphical explain into sql editorRegards,Sanket MehtaSr Software engineerEnterprisedb
Вложения
Hi,

A couple of comments following a quick test:

1) Some of the horizontal lines are not actually horizontal - they
noticeably drop down. Please see the attached screenshot.

2) I thought we were going to use a "viewport" to allow the user to
navigate through the diagram? I was thinking of displaying a thumbnail
with viewport in the top-left, with the main view being synchronised
to the viewport position/zoom level - for example, look at the 2D Zoom
example on http://www.ajax-zoom.com/. Something like Croppie might
help: http://foliotek.github.io/Croppie/ (as ajax-zoom is not free).

On Tue, Apr 12, 2016 at 11:36 AM, Sanket Mehta
<sanket.mehta@enterprisedb.com> wrote:
> Hi,
>
> Please do ignore previous patch as it contains trailing whitespaces.
> PFA the revised patch after resolving this issue.
>
>
>
> Regards,
> Sanket Mehta
> Sr Software engineer
> Enterprisedb
>
> On Mon, Apr 11, 2016 at 10:04 PM, Sanket Mehta
> <sanket.mehta@enterprisedb.com> wrote:
>>
>> Hi,
>>
>> PFA the patch for graphical explain feature.
>>
>> It consists of explain.js, __init__.py and demo_explain.html, snap_svg.js
>> and snap_svg-min.js file.
>>
>> Currently I have placed hard coded JSON data in demo_explain.html file to
>> display graphical output; which will be replace by actual output user get
>> from server in JSON format.
>>
>> Use below URL to access graphical output:
>>
>> http://localhost:5050/misc/explain where 5050 is the port your web server
>> is running on
>>
>> To test the patch, user can replace plan data (stored in 'data' variable)
>> in demo_explain.html with other valid plan data in JSON format and run the
>> above URL.
>>
>> Please review the patch and provide comments for the same.
>>
>> TODO: Integration of graphical explain into sql editor
>>
>>
>> Regards,
>> Sanket Mehta
>> Sr Software engineer
>> Enterprisedb
>
>
>
>
> --
> Sent via pgadmin-hackers mailing list (pgadmin-hackers@postgresql.org)
> To make changes to your subscription:
> http://www.postgresql.org/mailpref/pgadmin-hackers
>


--
Dave Page
Blog: http://pgsnake.blogspot.com
Twitter: @pgsnake

EnterpriseDB UK: http://www.enterprisedb.com
The Enterprise PostgreSQL Company
Вложения
Hi Dave,
Regarding your second comment,
Almost all the libraries that I have checked uses Jquery UI which is quite heavy.
Please share your comments about using these libraries.
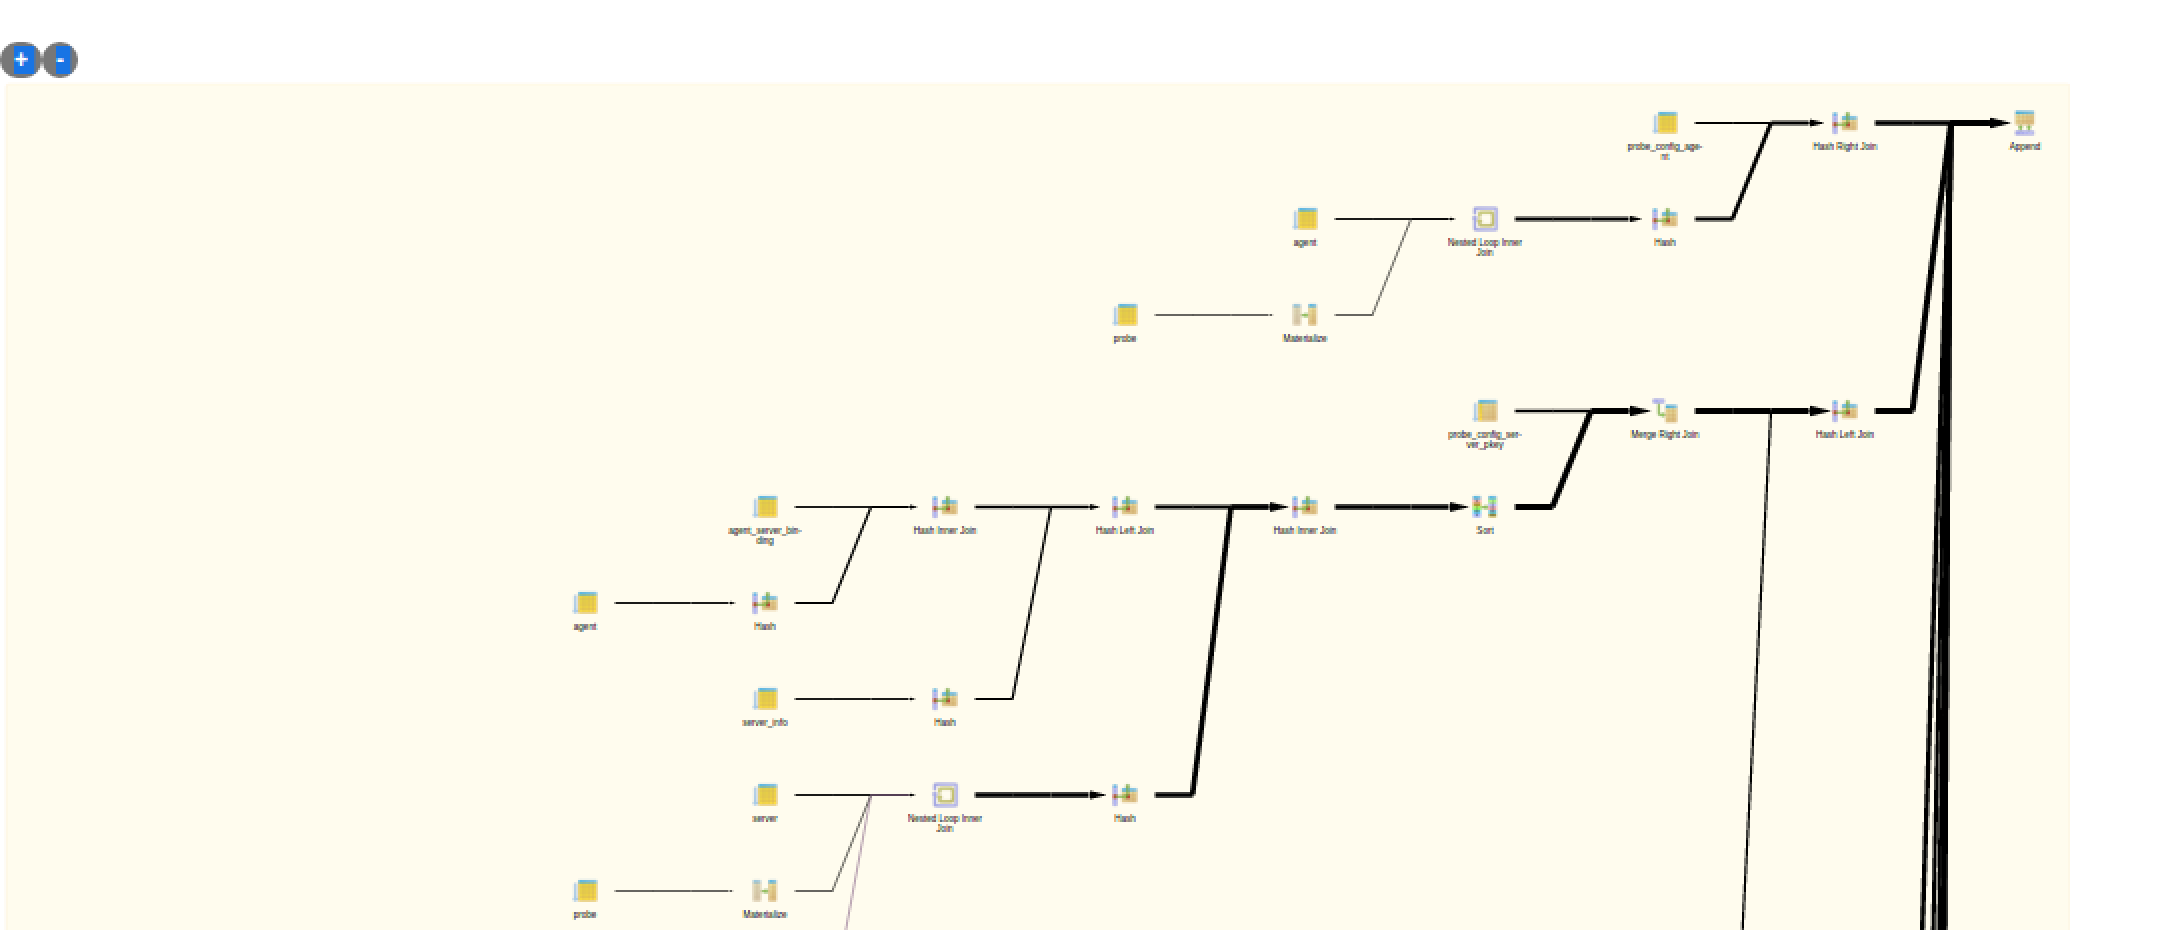
Meanwhile currently I have implemented zoom in/out functionality in graphical explain.
I have added two buttons on left top corner of panel (see the attached screen shot),
which you can use to zoom in/out the graph.
Please do review it and let me know your comments about them.
Regards,
Sanket Mehta
Sr Software engineer
Enterprisedb
On Wed, Apr 13, 2016 at 2:23 PM, Dave Page <dpage@pgadmin.org> wrote:
Hi,
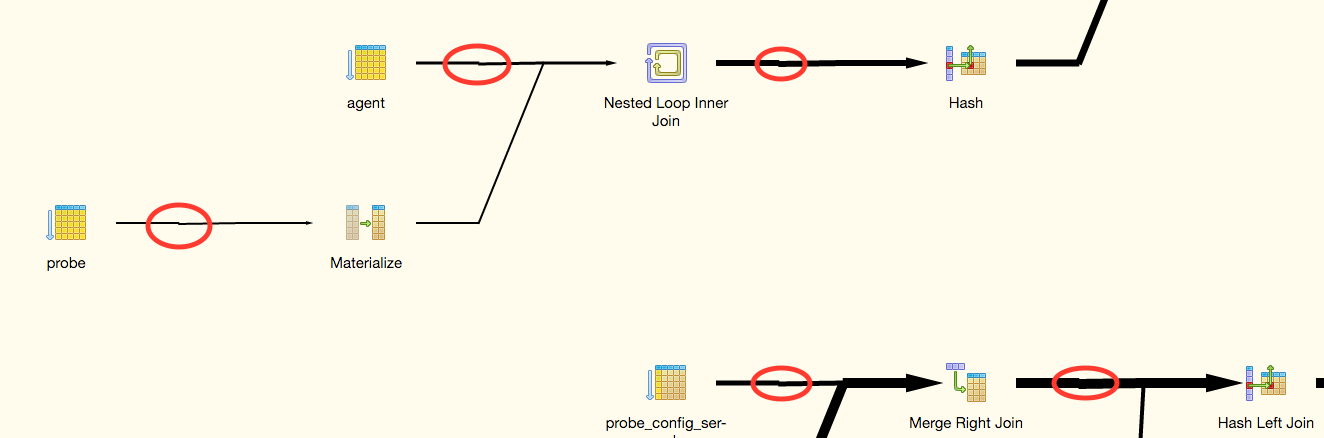
A couple of comments following a quick test:
1) Some of the horizontal lines are not actually horizontal - they
noticeably drop down. Please see the attached screenshot.
2) I thought we were going to use a "viewport" to allow the user to
navigate through the diagram? I was thinking of displaying a thumbnail
with viewport in the top-left, with the main view being synchronised
to the viewport position/zoom level - for example, look at the 2D Zoom
example on http://www.ajax-zoom.com/. Something like Croppie might
help: http://foliotek.github.io/Croppie/ (as ajax-zoom is not free).
On Tue, Apr 12, 2016 at 11:36 AM, Sanket Mehta> --<sanket.mehta@enterprisedb.com> wrote:
> Hi,
>
> Please do ignore previous patch as it contains trailing whitespaces.
> PFA the revised patch after resolving this issue.
>
>
>
> Regards,
> Sanket Mehta
> Sr Software engineer
> Enterprisedb
>
> On Mon, Apr 11, 2016 at 10:04 PM, Sanket Mehta
> <sanket.mehta@enterprisedb.com> wrote:
>>
>> Hi,
>>
>> PFA the patch for graphical explain feature.
>>
>> It consists of explain.js, __init__.py and demo_explain.html, snap_svg.js
>> and snap_svg-min.js file.
>>
>> Currently I have placed hard coded JSON data in demo_explain.html file to
>> display graphical output; which will be replace by actual output user get
>> from server in JSON format.
>>
>> Use below URL to access graphical output:
>>
>> http://localhost:5050/misc/explain where 5050 is the port your web server
>> is running on
>>
>> To test the patch, user can replace plan data (stored in 'data' variable)
>> in demo_explain.html with other valid plan data in JSON format and run the
>> above URL.
>>
>> Please review the patch and provide comments for the same.
>>
>> TODO: Integration of graphical explain into sql editor
>>
>>
>> Regards,
>> Sanket Mehta
>> Sr Software engineer
>> Enterprisedb
>
>
>
>
> Sent via pgadmin-hackers mailing list (pgadmin-hackers@postgresql.org)
> To make changes to your subscription:
> http://www.postgresql.org/mailpref/pgadmin-hackers
>
--
Dave Page
Blog: http://pgsnake.blogspot.com
Twitter: @pgsnake
EnterpriseDB UK: http://www.enterprisedb.com
The Enterprise PostgreSQL Company
Вложения
On Monday, April 18, 2016, Sanket Mehta <sanket.mehta@enterprisedb.com> wrote:
Hi Dave,Regarding your second comment,Almost all the libraries that I have checked uses Jquery UI which is quite heavy.Please share your comments about using these libraries.
What have you found?
Meanwhile currently I have implemented zoom in/out functionality in graphical explain.I have added two buttons on left top corner of panel (see the attached screen shot),which you can use to zoom in/out the graph.Please do review it and let me know your comments about them.
I have tested the code, so no screenshots necessary :-).
The problem with the zoom is that it doesn't give you any visual indicators that there is something on the canvas. With a big plan, it'll just look blank, unless the user starts scrolling/zooming. The viewport will give instant hints to the user that there's a big plan there, albeit out of view, and allow them to very easily navigate it.
Regards,Sanket MehtaSr Software engineerEnterprisedbOn Wed, Apr 13, 2016 at 2:23 PM, Dave Page <dpage@pgadmin.org> wrote:Hi,
A couple of comments following a quick test:
1) Some of the horizontal lines are not actually horizontal - they
noticeably drop down. Please see the attached screenshot.
2) I thought we were going to use a "viewport" to allow the user to
navigate through the diagram? I was thinking of displaying a thumbnail
with viewport in the top-left, with the main view being synchronised
to the viewport position/zoom level - for example, look at the 2D Zoom
example on http://www.ajax-zoom.com/. Something like Croppie might
help: http://foliotek.github.io/Croppie/ (as ajax-zoom is not free).
On Tue, Apr 12, 2016 at 11:36 AM, Sanket Mehta> --<sanket.mehta@enterprisedb.com> wrote:
> Hi,
>
> Please do ignore previous patch as it contains trailing whitespaces.
> PFA the revised patch after resolving this issue.
>
>
>
> Regards,
> Sanket Mehta
> Sr Software engineer
> Enterprisedb
>
> On Mon, Apr 11, 2016 at 10:04 PM, Sanket Mehta
> <sanket.mehta@enterprisedb.com> wrote:
>>
>> Hi,
>>
>> PFA the patch for graphical explain feature.
>>
>> It consists of explain.js, __init__.py and demo_explain.html, snap_svg.js
>> and snap_svg-min.js file.
>>
>> Currently I have placed hard coded JSON data in demo_explain.html file to
>> display graphical output; which will be replace by actual output user get
>> from server in JSON format.
>>
>> Use below URL to access graphical output:
>>
>> http://localhost:5050/misc/explain where 5050 is the port your web server
>> is running on
>>
>> To test the patch, user can replace plan data (stored in 'data' variable)
>> in demo_explain.html with other valid plan data in JSON format and run the
>> above URL.
>>
>> Please review the patch and provide comments for the same.
>>
>> TODO: Integration of graphical explain into sql editor
>>
>>
>> Regards,
>> Sanket Mehta
>> Sr Software engineer
>> Enterprisedb
>
>
>
>
> Sent via pgadmin-hackers mailing list (pgadmin-hackers@postgresql.org)
> To make changes to your subscription:
> http://www.postgresql.org/mailpref/pgadmin-hackers
>
--
Dave Page
Blog: http://pgsnake.blogspot.com
Twitter: @pgsnake
EnterpriseDB UK: http://www.enterprisedb.com
The Enterprise PostgreSQL Company
--
Dave Page
Blog: http://pgsnake.blogspot.com
Twitter: @pgsnake
EnterpriseDB UK: http://www.enterprisedb.com
The Enterprise PostgreSQL Company
Hi,
On Mon, Apr 18, 2016 at 5:38 PM, Dave Page <dpage@pgadmin.org> wrote:
On Monday, April 18, 2016, Sanket Mehta <sanket.mehta@enterprisedb.com> wrote:Hi Dave,Regarding your second comment,Almost all the libraries that I have checked uses Jquery UI which is quite heavy.Please share your comments about using these libraries.What have you found?
Below are the libraries I have checked out which uses JQUERY UI.
- https://github.com/samcroft/mini-map (alpha release only)
- http://codepen.io/billdwhite/pen/lCAdi (depends upon d3 library)
- http://jsfiddle.net/danimt/ARVWA/ (depends upon L library)
Some of them uses or depends upon different libraries (mentioned besides the link)
Meanwhile currently I have implemented zoom in/out functionality in graphical explain.I have added two buttons on left top corner of panel (see the attached screen shot),which you can use to zoom in/out the graph.Please do review it and let me know your comments about them.I have tested the code, so no screenshots necessary :-).The problem with the zoom is that it doesn't give you any visual indicators that there is something on the canvas. With a big plan, it'll just look blank, unless the user starts scrolling/zooming. The viewport will give instant hints to the user that there's a big plan there, albeit out of view, and allow them to very easily navigate it.Regards,Sanket MehtaSr Software engineerEnterprisedbOn Wed, Apr 13, 2016 at 2:23 PM, Dave Page <dpage@pgadmin.org> wrote:Hi,
A couple of comments following a quick test:
1) Some of the horizontal lines are not actually horizontal - they
noticeably drop down. Please see the attached screenshot.
2) I thought we were going to use a "viewport" to allow the user to
navigate through the diagram? I was thinking of displaying a thumbnail
with viewport in the top-left, with the main view being synchronised
to the viewport position/zoom level - for example, look at the 2D Zoom
example on http://www.ajax-zoom.com/. Something like Croppie might
help: http://foliotek.github.io/Croppie/ (as ajax-zoom is not free).
On Tue, Apr 12, 2016 at 11:36 AM, Sanket Mehta> --<sanket.mehta@enterprisedb.com> wrote:
> Hi,
>
> Please do ignore previous patch as it contains trailing whitespaces.
> PFA the revised patch after resolving this issue.
>
>
>
> Regards,
> Sanket Mehta
> Sr Software engineer
> Enterprisedb
>
> On Mon, Apr 11, 2016 at 10:04 PM, Sanket Mehta
> <sanket.mehta@enterprisedb.com> wrote:
>>
>> Hi,
>>
>> PFA the patch for graphical explain feature.
>>
>> It consists of explain.js, __init__.py and demo_explain.html, snap_svg.js
>> and snap_svg-min.js file.
>>
>> Currently I have placed hard coded JSON data in demo_explain.html file to
>> display graphical output; which will be replace by actual output user get
>> from server in JSON format.
>>
>> Use below URL to access graphical output:
>>
>> http://localhost:5050/misc/explain where 5050 is the port your web server
>> is running on
>>
>> To test the patch, user can replace plan data (stored in 'data' variable)
>> in demo_explain.html with other valid plan data in JSON format and run the
>> above URL.
>>
>> Please review the patch and provide comments for the same.
>>
>> TODO: Integration of graphical explain into sql editor
>>
>>
>> Regards,
>> Sanket Mehta
>> Sr Software engineer
>> Enterprisedb
>
>
>
>
> Sent via pgadmin-hackers mailing list (pgadmin-hackers@postgresql.org)
> To make changes to your subscription:
> http://www.postgresql.org/mailpref/pgadmin-hackers
>
--
Dave Page
Blog: http://pgsnake.blogspot.com
Twitter: @pgsnake
EnterpriseDB UK: http://www.enterprisedb.com
The Enterprise PostgreSQL Company
--
Dave Page
Blog: http://pgsnake.blogspot.com
Twitter: @pgsnake
EnterpriseDB UK: http://www.enterprisedb.com
The Enterprise PostgreSQL Company
On Tuesday, April 19, 2016, Sanket Mehta <sanket.mehta@enterprisedb.com> wrote:
Hi,On Mon, Apr 18, 2016 at 5:38 PM, Dave Page <dpage@pgadmin.org> wrote:
On Monday, April 18, 2016, Sanket Mehta <sanket.mehta@enterprisedb.com> wrote:Hi Dave,Regarding your second comment,Almost all the libraries that I have checked uses Jquery UI which is quite heavy.Please share your comments about using these libraries.What have you found?Below are the libraries I have checked out which uses JQUERY UI.
That one would work wound't it? Assuming it can do x and y movement.
--
Dave Page
Blog: http://pgsnake.blogspot.com
Twitter: @pgsnake
EnterpriseDB UK: http://www.enterprisedb.com
The Enterprise PostgreSQL Company
On Wed, Apr 20, 2016 at 6:12 PM, Dave Page <dpage@pgadmin.org> wrote:
On Tuesday, April 19, 2016, Sanket Mehta <sanket.mehta@enterprisedb.com> wrote:Hi,On Mon, Apr 18, 2016 at 5:38 PM, Dave Page <dpage@pgadmin.org> wrote:
On Monday, April 18, 2016, Sanket Mehta <sanket.mehta@enterprisedb.com> wrote:Hi Dave,Regarding your second comment,Almost all the libraries that I have checked uses Jquery UI which is quite heavy.Please share your comments about using these libraries.What have you found?Below are the libraries I have checked out which uses JQUERY UI.That one would work wound't it? Assuming it can do x and y movement.
I have tried to implement the same but it is not working properly as scrolling in minimap was not there and sometimes it was not showing the map itself.
--
Dave Page
Blog: http://pgsnake.blogspot.com
Twitter: @pgsnake
EnterpriseDB UK: http://www.enterprisedb.com
The Enterprise PostgreSQL Company
This looks awesome, and is MIT licenced:
--
Dave Page
Blog: http://pgsnake.blogspot.com
Twitter: @pgsnake
EnterpriseDB UK: http://www.enterprisedb.com
The Enterprise PostgreSQL Company
http://www.jqueryrain.com/2016/01/imageviewer-jquery-zooming-and-panning-plugin/
On Wednesday, April 20, 2016, Sanket Mehta <sanket.mehta@enterprisedb.com> wrote:
On Wednesday, April 20, 2016, Sanket Mehta <sanket.mehta@enterprisedb.com> wrote:
On Wed, Apr 20, 2016 at 6:12 PM, Dave Page <dpage@pgadmin.org> wrote:
On Tuesday, April 19, 2016, Sanket Mehta <sanket.mehta@enterprisedb.com> wrote:Hi,On Mon, Apr 18, 2016 at 5:38 PM, Dave Page <dpage@pgadmin.org> wrote:
On Monday, April 18, 2016, Sanket Mehta <sanket.mehta@enterprisedb.com> wrote:Hi Dave,Regarding your second comment,Almost all the libraries that I have checked uses Jquery UI which is quite heavy.Please share your comments about using these libraries.What have you found?Below are the libraries I have checked out which uses JQUERY UI.That one would work wound't it? Assuming it can do x and y movement.I have tried to implement the same but it is not working properly as scrolling in minimap was not there and sometimes it was not showing the map itself.
--
Dave Page
Blog: http://pgsnake.blogspot.com
Twitter: @pgsnake
EnterpriseDB UK: http://www.enterprisedb.com
The Enterprise PostgreSQL Company
--
Dave Page
Blog: http://pgsnake.blogspot.com
Twitter: @pgsnake
EnterpriseDB UK: http://www.enterprisedb.com
The Enterprise PostgreSQL Company
What is the status of this Sanket? I'd really like to see it completed
before alpha.

On Thu, Apr 21, 2016 at 3:07 PM, Dave Page <dpage@pgadmin.org> wrote:
> This looks awesome, and is MIT licenced:
>
> http://www.jqueryrain.com/2016/01/imageviewer-jquery-zooming-and-panning-plugin/
>
>
> On Wednesday, April 20, 2016, Sanket Mehta <sanket.mehta@enterprisedb.com>
> wrote:
>>
>>
>> On Wed, Apr 20, 2016 at 6:12 PM, Dave Page <dpage@pgadmin.org> wrote:
>>>
>>>
>>>
>>> On Tuesday, April 19, 2016, Sanket Mehta <sanket.mehta@enterprisedb.com>
>>> wrote:
>>>>
>>>> Hi,
>>>>
>>>> On Mon, Apr 18, 2016 at 5:38 PM, Dave Page <dpage@pgadmin.org> wrote:
>>>>>
>>>>>
>>>>>
>>>>> On Monday, April 18, 2016, Sanket Mehta <sanket.mehta@enterprisedb.com>
>>>>> wrote:
>>>>>>
>>>>>> Hi Dave,
>>>>>>
>>>>>> Regarding your second comment,
>>>>>> Almost all the libraries that I have checked uses Jquery UI which is
>>>>>> quite heavy.
>>>>>> Please share your comments about using these libraries.
>>>>>
>>>>>
>>>>> What have you found?
>>>>
>>>> Below are the libraries I have checked out which uses JQUERY UI.
>>>>
>>>>  - https://github.com/princejwesley/minimap/blob/master/src/minimap.js
>>>
>>>
>>> That one would work wound't it? Assuming it can do x and y movement.
>>
>> I have tried to implement the same but it is not working properly as
>> scrolling in minimap was not there and sometimes it was not showing the map
>> itself.
>>
>>>
>>>
>>> --
>>> Dave Page
>>> Blog: http://pgsnake.blogspot.com
>>> Twitter: @pgsnake
>>>
>>> EnterpriseDB UK: http://www.enterprisedb.com
>>> The Enterprise PostgreSQL Company
>>>
>>
>
>
> --
> Dave Page
> Blog: http://pgsnake.blogspot.com
> Twitter: @pgsnake
>
> EnterpriseDB UK: http://www.enterprisedb.com
> The Enterprise PostgreSQL Company
>


--
Dave Page
Blog: http://pgsnake.blogspot.com
Twitter: @pgsnake

EnterpriseDB UK: http://www.enterprisedb.com
The Enterprise PostgreSQL Company
Hi,
I will start working on it once I will complete PEM 6.0.1 issues.
Now there is only 1 issue remaining in that bucket which I am currently working on
Regards,
Sanket Mehta
Sr Software engineer
Enterprisedb
On Fri, May 27, 2016 at 4:44 PM, Dave Page <dpage@pgadmin.org> wrote:
What is the status of this Sanket? I'd really like to see it completed
before alpha.
On Thu, Apr 21, 2016 at 3:07 PM, Dave Page <dpage@pgadmin.org> wrote:
> This looks awesome, and is MIT licenced:
>
> http://www.jqueryrain.com/2016/01/imageviewer-jquery-zooming-and-panning-plugin/
>
>
> On Wednesday, April 20, 2016, Sanket Mehta <sanket.mehta@enterprisedb.com>
> wrote:
>>
>>
>> On Wed, Apr 20, 2016 at 6:12 PM, Dave Page <dpage@pgadmin.org> wrote:
>>>
>>>
>>>
>>> On Tuesday, April 19, 2016, Sanket Mehta <sanket.mehta@enterprisedb.com>
>>> wrote:
>>>>
>>>> Hi,
>>>>
>>>> On Mon, Apr 18, 2016 at 5:38 PM, Dave Page <dpage@pgadmin.org> wrote:
>>>>>
>>>>>
>>>>>
>>>>> On Monday, April 18, 2016, Sanket Mehta <sanket.mehta@enterprisedb.com>
>>>>> wrote:
>>>>>>
>>>>>> Hi Dave,
>>>>>>
>>>>>> Regarding your second comment,
>>>>>> Almost all the libraries that I have checked uses Jquery UI which is
>>>>>> quite heavy.
>>>>>> Please share your comments about using these libraries.
>>>>>
>>>>>
>>>>> What have you found?
>>>>
>>>> Below are the libraries I have checked out which uses JQUERY UI.
>>>>
>>>> - https://github.com/princejwesley/minimap/blob/master/src/minimap.js
>>>
>>>
>>> That one would work wound't it? Assuming it can do x and y movement.
>>
>> I have tried to implement the same but it is not working properly as
>> scrolling in minimap was not there and sometimes it was not showing the map
>> itself.
>>
>>>
>>>
>>> --
>>> Dave Page
>>> Blog: http://pgsnake.blogspot.com
>>> Twitter: @pgsnake
>>>
>>> EnterpriseDB UK: http://www.enterprisedb.com
>>> The Enterprise PostgreSQL Company
>>>
>>
>
>
> --
> Dave Page
> Blog: http://pgsnake.blogspot.com
> Twitter: @pgsnake
>
> EnterpriseDB UK: http://www.enterprisedb.com
> The Enterprise PostgreSQL Company
>
--
Dave Page
Blog: http://pgsnake.blogspot.com
Twitter: @pgsnake
EnterpriseDB UK: http://www.enterprisedb.com
The Enterprise PostgreSQL Company