Almost all the libraries that I have checked uses Jquery UI which is quite heavy.
Please share your comments about using these libraries.
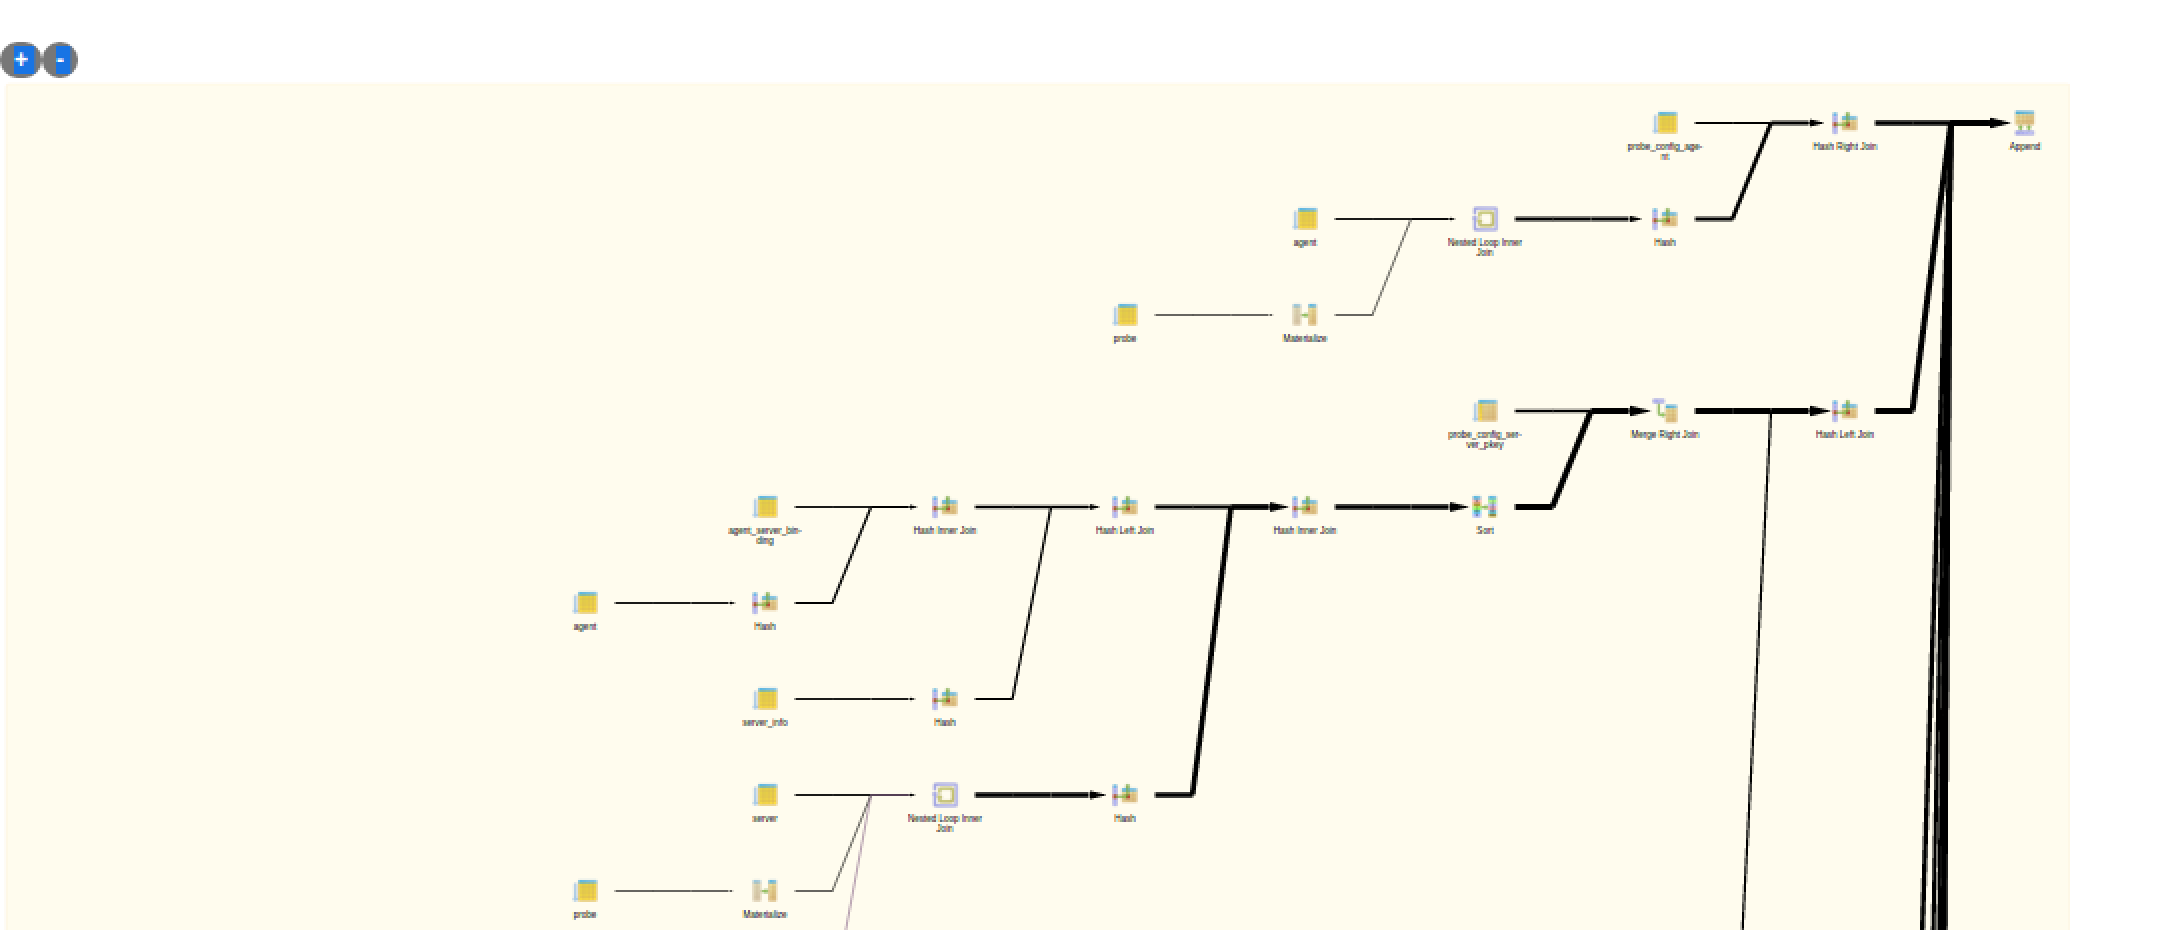
Meanwhile currently I have implemented zoom in/out functionality in graphical explain.
I have added two buttons on left top corner of panel (see the attached screen shot),
which you can use to zoom in/out the graph.
Please do review it and let me know your comments about them.
Regards,
Sanket Mehta
Sr Software engineer
Enterprisedb
On Wed, Apr 13, 2016 at 2:23 PM, Dave Page <dpage@pgadmin.org> wrote:
Hi,
A couple of comments following a quick test:
1) Some of the horizontal lines are not actually horizontal - they noticeably drop down. Please see the attached screenshot.
2) I thought we were going to use a "viewport" to allow the user to navigate through the diagram? I was thinking of displaying a thumbnail with viewport in the top-left, with the main view being synchronised to the viewport position/zoom level - for example, look at the 2D Zoom example on http://www.ajax-zoom.com/. Something like Croppie might help: http://foliotek.github.io/Croppie/ (as ajax-zoom is not free).
On Tue, Apr 12, 2016 at 11:36 AM, Sanket Mehta
<sanket.mehta@enterprisedb.com> wrote: > Hi, > > Please do ignore previous patch as it contains trailing whitespaces. > PFA the revised patch after resolving this issue. > > > > Regards, > Sanket Mehta > Sr Software engineer > Enterprisedb > > On Mon, Apr 11, 2016 at 10:04 PM, Sanket Mehta > <sanket.mehta@enterprisedb.com> wrote: >> >> Hi, >> >> PFA the patch for graphical explain feature. >> >> It consists of explain.js, __init__.py and demo_explain.html, snap_svg.js >> and snap_svg-min.js file. >> >> Currently I have placed hard coded JSON data in demo_explain.html file to >> display graphical output; which will be replace by actual output user get >> from server in JSON format. >> >> Use below URL to access graphical output: >> >> http://localhost:5050/misc/explain where 5050 is the port your web server >> is running on >> >> To test the patch, user can replace plan data (stored in 'data' variable) >> in demo_explain.html with other valid plan data in JSON format and run the >> above URL. >> >> Please review the patch and provide comments for the same. >> >> TODO: Integration of graphical explain into sql editor >> >> >> Regards, >> Sanket Mehta >> Sr Software engineer >> Enterprisedb > > > >