Re: [HACKERS] Checksums by default?
| От | Tomas Vondra |
|---|---|
| Тема | Re: [HACKERS] Checksums by default? |
| Дата | |
| Msg-id | 882db4aa-073a-7854-fb1d-6097854f69da@2ndquadrant.com обсуждение исходный текст |
| Ответ на | [HACKERS] Checksums by default? (Magnus Hagander <magnus@hagander.net>) |
| Ответы |
Re: [HACKERS] Checksums by default?
(Tomas Vondra <tomas.vondra@2ndquadrant.com>)
|
| Список | pgsql-hackers |
Hi,
I've been running a bunch of benchmarks to measure the overhead of data
checksums. I'm not sure if we're still considering this change for 10,
but let me post the results anyway.
The benchmark was fairly simple - run a few simple workloads, measure
tps, amount of WAL generated etc. The scripts and results (including sar
data etc) is available here:
https://bitbucket.org/tvondra/checksum-bench
I encourage others to validate the results, see if I made some stupid
mistakes and perhaps do additional analysis of the data. There's quite a
bit of data, including pg_stat_* snapshots collected every second, etc.
The workloads benchmarked were
* regular pgbench
* 'skewed' pgbench (simulating workloads that frequently access only
small subset of data)
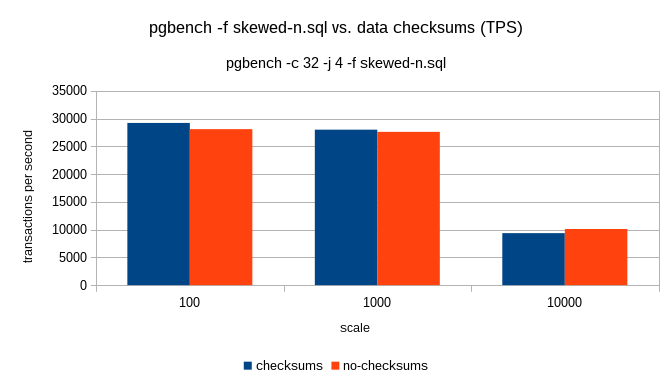
* 'skewed-n' (same as before, but skipping updates on tiny tables, to
prevent concurrency issues, just like "pgbench -N")
* pgbench with 90% reads, 10% writes
All of this on three different scales:
* 100 - fits into shared buffers
* 1000 - fits into RAM
* 10000 - exceeds RAM
This was done on a machine with 2 x 8/16 cores, with 32 clients, each
run taking 2h. The machine has PCIe SSD drive (Intel 750), so fairly
powerful both for reads and writes.
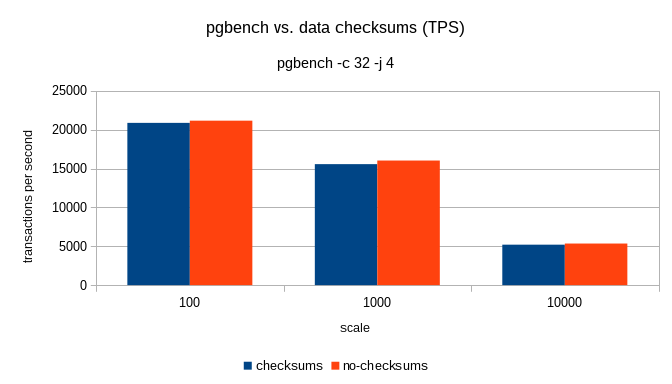
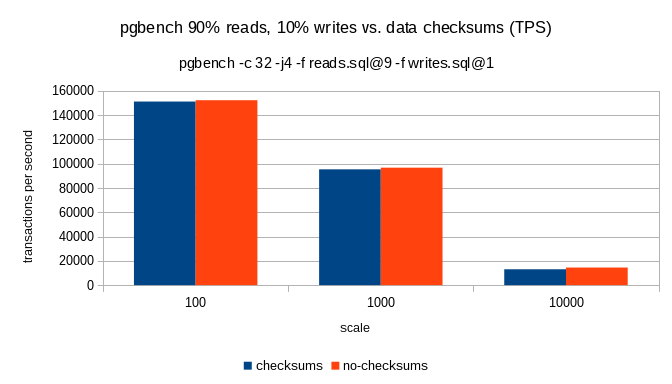
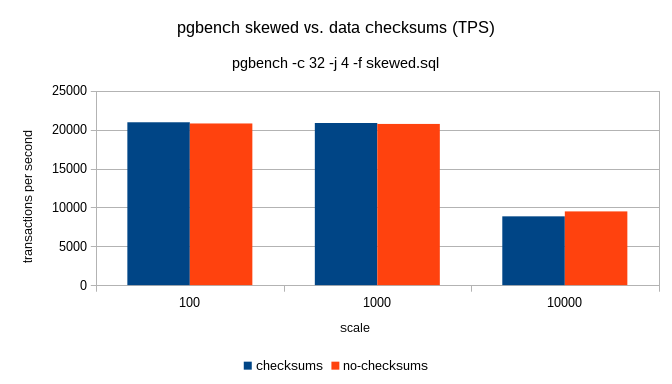
The TPS results look like this (charts and spreadsheet attached):
test scale checksums no-checksums ratio
-----------------------------------------------------------------
pgbench 100 20888 21166 98.69%
1000 15578 16036 97.14%
10000 5205 5352 97.25%
test scale checksums no-checksums ratio
-----------------------------------------------------------------
read-write 100 151228 152330 99.28%
1000 95396 96755 98.60%
10000 13067 14514 90.03%
test scale checksums no-checksums ratio
------------------------------------------------------------------
skewed 100 20957 20805 100.73%
1000 20865 20744 100.58%
10000 8855 9482 93.39%
test scale checksums no-checksums ratio
-----------------------------------------------------------------
skewed-n 100 29226 28104 103.99%
1000 28011 27612 101.45%
10000 9363 10109 92.62%
So it seems with smaller scales, the overhead is fairly low (~2%, so
within noise). On the large data the throughput drops by ~10% with some
of the workloads.
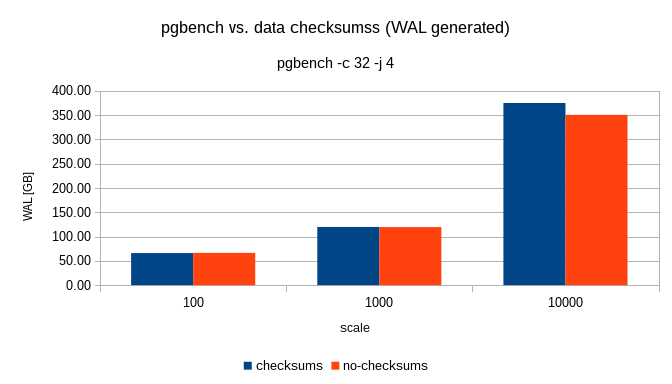
The amount of WAL generated (over the 2h run with checkpoints triggered
every 30 minutes) looks like this:
test scale checksums no-checksums ratio
-------------------------------------------------------------
pgbench 100 66.11 66.48 99.45%
1000 119.77 119.55 100.19%
10000 375.05 350.63 106.97%
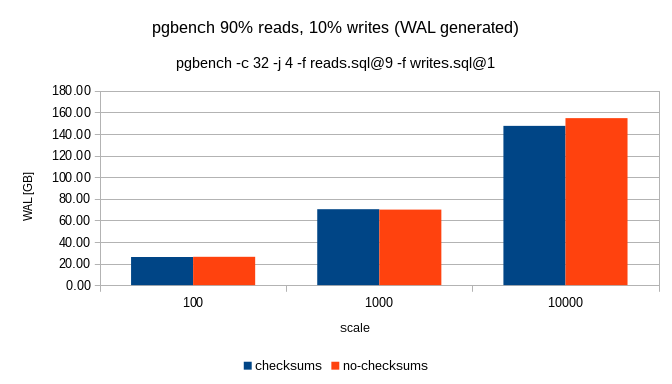
test scale checksums no-checksums ratio
---------------------------------------------------------------
read-write 100 26.06 26.26 99.26%
1000 70.37 70.01 100.51%
10000 147.54 154.78 95.33%
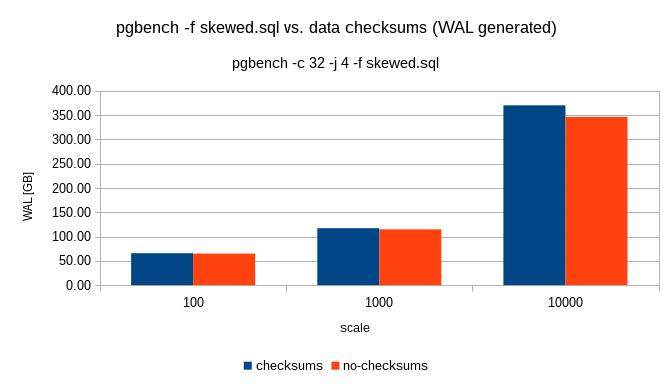
test scale checksums no-checksums ratio
-----------------------------------------------------------------
skewed 100 65.64 64.88 101.18%
1000 117.20 114.79 102.10%
10000 370.15 346.39 106.86%
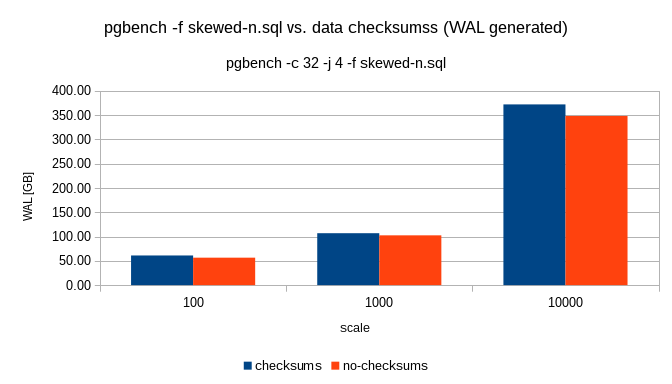
test scale checksums no-checksums ratio
----------------------------------------------------------------
skewed-n 100 61.00 56.53 107.92%
1000 106.85 102.48 104.26%
10000 372.03 348.29 106.82%
Those numbers should be probably corrected a bit to compensate for the
tps difference (if you to ~10% more TPS, you expect ~10% more WAL), but
I think it's clear the WAL overhead is roughly +10% or so.
I'm not suggesting this means we should or should not enable data
checksums by default, but hopefully it provides some actual data
measuring the impact. If needed, I can do more tests with other
workloads, and it should be difficult to use the scripts on other
systems if you want to run some benchmarks yourself.
regards
regards
Tomas Vondra
--
Sent via pgsql-hackers mailing list (pgsql-hackers@postgresql.org)
To make changes to your subscription:
http://www.postgresql.org/mailpref/pgsql-hackers
Вложения
В списке pgsql-hackers по дате отправления:
Следующее
От: Fabien COELHOДата:
Сообщение: Re: \if, \elseif, \else, \endif (was Re: [HACKERS] PSQL commands:\quit_if, \quit_unless)