Обсуждение: finding queries doing sequential search
Hi,
i have a very big table (PostGIS OpenStreetMap data, but that does not mapper) with about 380 million records and a size of 275 GB + Indices. Permanently updated and growing.
Of course i enabled autovacuum.
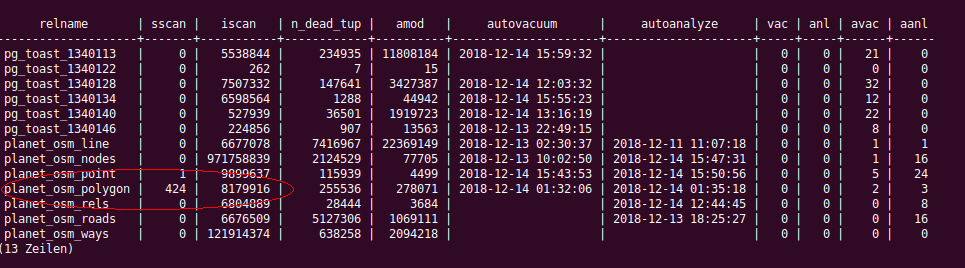
The log shows me 8.2 Mio index scans (iscan), which is fine, and right now 424 sequential scans (sscan) for planet_osm_polygon. see attached image.
I want to locate the query doing this stuff but EXPLAIN won't help because most querys are dynamicly created.
Is there a way/trick do this?
Regards
walter
Вложения
wambacher@posteo.de writes:
> The log shows me 8.2 Mio index scans (iscan), which is fine,  and right
> now 424 sequential scans (sscan) for planet_osm_polygon. see attached image.
> I want to locate the query doing this stuff but EXPLAIN won't help
> because most querys are dynamicly created.

auto_explain might help.  Or you could just log_min_duration_statement
to capture queries that are running long.

            regards, tom lane
Hi,
i have a very big table (PostGIS OpenStreetMap data, but that does not mapper) with about 380 million records and a size of 275 GB + Indices. Permanently updated and growing.
Of course i enabled autovacuum.
The log shows me 8.2 Mio index scans (iscan), which is fine, and right now 424 sequential scans (sscan) for planet_osm_polygon. see attached image.
I want to locate the query doing this stuff but EXPLAIN won't help because most querys are dynamicly created.
Is there a way/trick do this?
I look for queries with a high shared_blks_hit and/or shared_blks_read in pg_stat_statements. Although not directly indicative of sequential scans, the correlation is usually pretty good.Also I suggest you look in pg_stat_user_tables and ensure that seq_tup_read is high as well as seq_scan. For example this query:select * from a_really_big_table limit 1;will increment seq_scan, though since it scans only one tuple there's not actually any problem here. Dividing seq_tup_read by seq_scan will yield the mean number of tuples read per sequential scan, and if that's a small number it could be that the sequential scans you are seeing are in fact a non-issue.
3.6 mio tup is quite much, i think:select seq_tup_read,seq_scan, seq_tup_read/seq_scan "tup per scan" from pg_stat_user_tables
where relname = 'planet_osm_polygon';
seq_tup_read | seq_scan | tup per scan
--------------+----------+--------------
1517870594 | 426 | 3563076
(1 Zeile)
@tom: I'll try auto_explain next.
wambacher@posteo.de wrote:
> i have a very big table (PostGIS OpenStreetMap data, but that does not mapper)
> with about 380 million records and a size of 275 GB + Indices.
> Permanently updated and growing.
> Of course i enabled autovacuum.
> The log shows me 8.2 Mio index scans (iscan), which is fine,  and right now
> 424 sequential scans (sscan) for planet_osm_polygon. see attached image.
> I want to locate the query doing this stuff but EXPLAIN won't help because
> most querys are dynamicly created.
> Is there a way/trick do this?

With a big table it shouldn't be a problem.

Set log_min_duration_statement = 10000 or similar, and all long running
statements will be logged.  The sequential scans should be among them.

Yours,
Laurenz Albe
--
Cybertec | https://www.cybertec-postgresql.com