Обсуждение: Bi-modal streaming replication throughput
Hi,
I have been puzzled by very different replication performance (meaning 50-100x slower) between identical replicas (both in “hardware” and configuration) once the amount of data to replicate increases. I’ve gone down a number of dead ends and am missing something(
# The setup
We run
I have been puzzled by very different replication performance (meaning 50-100x slower) between identical replicas (both in “hardware” and configuration) once the amount of data to replicate increases. I’ve gone down a number of dead ends and am missing something(
likely obvious
)that I hope folks with a deeper knowledge can point out. I’ve tried to boil down the data need to describe the issue to a minimum. Thanks for taking the time to read and for any ideas you can share.
# The setup
We run
a cluster of
large, SSD-backed, i3.16xl (64 cores visible to Linux, ~500GB of RAM, with 8GB of shared_buffers, fast NVMe drives) nodes, each
running PG 9.3 on linux
in a vanilla streaming asynchronous replication setup: 1 primary node, 1 replica designated for failover (left alone) and 6 read replicas, taking queries.Under normal circumstances this is working exactly as planned but when I dial up the number of INSERTs on the primary to ~10k rows per second, or roughly 50MB of data per second (not enough to saturate the network between nodes)
Table “T”
Column | Type | Modifiers | Storage |
----------------+-----------------------------+----------------------------------------+----------+
key | bigint | not null default T.next_key() | plain |
a | integer | not null | plain |
b | integer | | plain |
c | text | | extended |
d | text | | extended |
e | text[] | | extended |
f | integer | not null | plain |
created | timestamp without time zone | not null default now() | plain |
cksum | bytea | not null | extended |
Indexes:
“T_pkey" PRIMARY KEY, btree (key)
“T_cksum” UNIQUE, btree (cksum)
“T_created_idx" btree (created)
“T_full_idx" btree (a, b, c, d, e)
“T_a_idx" btree (a)
# The symptoms
Once the primary starts to process INSERTs to the tune of 10k/s (roughly
1. We see read replicas fall behind and we can measure their replication throughput to be
2. If we stop incoming queries from one of the replicas, we see it catch up at 2x insert throughput (roughly 80MB/s or 300GB/h) as it is cutting through the backlog. A perf sample shows a good chunk of time spent in `mdnblocks`. I/O wait remains
, read replicas falls hopelessly and consistently behind until read traffic is diverted away
. The INSERTs themselves are fairly straightforward: a 20-bytea checksum is computed off-node and used as a unicity constraint at insert time. Each record is 4,500 bytes wide on average.H
ere’s the table where inserts happen.Table “T”
Column | Type | Modifiers | Storage |
----------------+-----------------------------+----------------------------------------+----------+
key | bigint | not null default T.next_key()
a | integer | not null | plain |
b | integer | | plain |
c | text | | extended |
d | text | | extended |
e | text[] | | extended |
f | integer | not null | plain |
created | timestamp without time zone | not null default now() | plain |
cksum | bytea | not null | extended |
Indexes:
“T_pkey" PRIMARY KEY, btree (key)
“T_cksum” UNIQUE, btree (cksum)
“T_created_idx" btree (created)
“T_full_idx" btree (a, b, c, d, e)
“T_a_idx" btree (a)
# The symptoms
Once the primary starts to process INSERTs to the tune of 10k/s (roughly
5
0MB/s or 150GB/h), replication throughput becomes bi-modal within minutes.
1. We see read replicas fall behind and we can measure their replication throughput to be
consistently
1-2% of what the primary is sustaining, by measuring the replication delay (in second) every second. We quickly get that metric
to 0.98-0.99 (1 means that replication is completely stuck as it falls behind by one second every second
). CPU, memory, I/O (per core iowait)
or network (throughput)
as a whole resource are not visibly
maxed out.
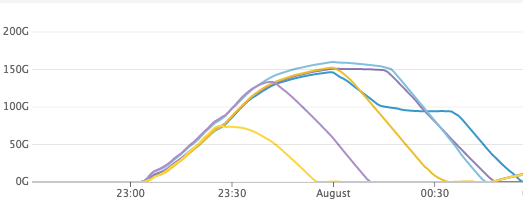
2. If we stop incoming queries from one of the replicas, we see it catch up at 2x insert throughput (roughly 80MB/s or 300GB/h) as it is cutting through the backlog. A perf sample shows a good chunk of time spent in `mdnblocks`. I/O wait remains
at
a few % (2-10) of cpu cycles. If you can open the attached screenshot you can see the lag going down on each replica as soon as we stop sending reads at it.
In both cases the recovery process maxes out 1 core
# The question
What surprised me is the bi-modal nature of throughput without gradual degradation
as expected
.# The question
What surprised me is the bi-modal nature of throughput without gradual degradation
or a very clear indication of the contentious resource (I/O? Buffer access?)
. The bi-modal throughput
would be consistent with replication being effectively
scheduled to run at full speed
1% or 2% of the time (the rest being allocated to queries) but I have not found something in the documentation or in the code that supports that view.
Is this the right way to think about what’s observed?
name | setting
------------------------------+-----------
max_wal_senders | 299
max_wal_size | 10240
min_wal_size | 5
wal_block_size | 8192
wal_buffers | 2048
wal_compression | off
wal_keep_segments | 0
wal_level | replica
wal_log_hints | off
wal_receiver_status_interval | 10
wal_receiver_timeout | 60000
wal_retrieve_retry_interval | 5000
wal_segment_size | 2048
wal_sender_timeout | 60000
wal_sync_method | fdatasync
wal_writer_delay | 200
wal_writer_flush_after | 128
shared_buffers | 1048576
work_mem | 32768
maintenance_work_mem | 2097152
If not, what could be a good next hypothesis to test?
# References
Here are some settings that may help and a perf profile of a recovery process that runs without any competing read traffic processing the INSERT backlog (I don't unfortunately have the same profile on a lagging read replica).
name | setting
------------------------------+-----------
max_wal_senders | 299
max_wal_size | 10240
min_wal_size | 5
wal_block_size | 8192
wal_buffers | 2048
wal_compression | off
wal_keep_segments | 0
wal_level | replica
wal_log_hints | off
wal_receiver_status_interval | 10
wal_receiver_timeout | 60000
wal_retrieve_retry_interval | 5000
wal_segment_size | 2048
wal_sender_timeout | 60000
wal_sync_method | fdatasync
wal_writer_delay | 200
wal_writer_flush_after | 128
shared_buffers | 1048576
work_mem | 32768
maintenance_work_mem | 2097152
recovery process sampled at 997Hz on a lagging replica without read traffic.
Samples: 9K of event 'cycles', Event count (approx.): 25040027878
Children Self Command Shared Object Symbol
+ 97.81% 0.44% postgres postgres [.] StartupXLOG
+ 82.41% 0.00% postgres postgres [.] StartupProcessMain
+ 82.41% 0.00% postgres postgres [.] AuxiliaryProcessMain
+ 82.41% 0.00% postgres postgres [.] 0xffffaa514b8004dd
+ 82.41% 0.00% postgres postgres [.] PostmasterMain
+ 82.41% 0.00% postgres postgres [.] main
+ 82.41% 0.00% postgres libc-2.23.so [.] __libc_start_main
+ 82.41% 0.00% postgres [unknown] [k] 0x3bb6258d4c544155
+ 50.41% 0.09% postgres postgres [.] XLogReadBufferExtended
+ 40.14% 0.70% postgres postgres [.] XLogReadRecord
+ 39.92% 0.00% postgres postgres [.] 0xffffaa514b69524e
+ 30.25% 26.78% postgres postgres [.] mdnblocks
+ 27.35% 0.00% postgres postgres [.] heap_redo
+ 26.23% 0.01% postgres postgres [.] XLogReadBuffer
+ 25.37% 0.05% postgres postgres [.] btree_redo
+ 22.49% 0.07% postgres postgres [.] ReadBufferWithoutRelcache
+ 18.72% 0.00% postgres postgres [.] 0xffffaa514b6a2e6a
+ 18.64% 18.64% postgres postgres [.] 0x00000000000fde6a
+ 18.10% 0.00% postgres postgres [.] 0xffffaa514b65a867
+ 15.80% 0.06% postgres [kernel.kallsyms] [k] entry_SYSCALL_64_fastpath
+ 13.16% 0.02% postgres postgres [.] RestoreBackupBlock
+ 12.90% 0.00% postgres postgres [.] 0xffffaa514b675271
+ 12.53% 0.00% postgres postgres [.] 0xffffaa514b69270e
+ 10.29% 0.00% postgres postgres [.] 0xffffaa514b826672
+ 10.00% 0.03% postgres libc-2.23.so [.] write
+ 9.91% 0.00% postgres postgres [.] 0xffffaa514b823ffe
+ 9.71% 0.00% postgres postgres [.] mdwrite
+ 9.45% 0.24% postgres libc-2.23.so [.] read
+ 9.25% 0.03% postgres [kernel.kallsyms] [k] sys_write
+ 9.15% 0.00% postgres [kernel.kallsyms] [k] vfs_write
+ 8.98% 0.01% postgres [kernel.kallsyms] [k] new_sync_write
+ 8.98% 0.00% postgres [kernel.kallsyms] [k] __vfs_write
+ 8.96% 0.03% postgres [xfs] [k] xfs_file_write_iter
+ 8.91% 0.08% postgres [xfs] [k] xfs_file_buffered_aio_write
+ 8.64% 0.00% postgres postgres [.] 0xffffaa514b65ab10
+ 7.87% 0.00% postgres postgres [.] 0xffffaa514b6752d0
+ 7.35% 0.04% postgres [kernel.kallsyms] [k] generic_perform_write
+ 5.77% 0.11% postgres libc-2.23.so [.] lseek64
+ 4.99% 0.00% postgres postgres [.] 0xffffaa514b6a3347
+ 4.80% 0.15% postgres [kernel.kallsyms] [k] sys_read
+ 4.74% 4.74% postgres [kernel.kallsyms] [k] copy_user_enhanced_fast_string
Вложения
On Tue, Aug 14, 2018 at 9:18 AM, Alexis Lê-Quôc <alq@datadoghq.com> wrote:
>
each
running PG 9.3 on linux
That is the oldest version which is still supported. There have been a lot of improvements since then, including to performance. You should see if an upgrade solves the problem. If not, at least you will have access to better tools (like pg_stat_activity.wait_event_type), and people will be more enthusiastic about helping you figure it out knowing it is not an already-solved problem.
Here are some settings that may help and a perf profile of a recovery process that runs without any competing read traffic processing the INSERT backlog (I don't unfortunately have the same profile on a lagging read replica).
Unfortunately the perf when the problem is not occuring won't be very helpful. You need it from when the problem is occurring. Also, I find strace and gdb to more helpful than perf in this type of situation where you already know it is not CPU bound, although perhaps that is just my own lack of skill with perf. You need to know why it is not on the CPU, not what it is doing when it is on the CPU.
Where the settings you showed all of the non-default settings?
I assume max_standby_streaming_delay is at the default value of 30s? Are you getting query cancellations due conflicts with recovery, or anything else suspicious in the log? What is the maximum lag you see measured in seconds?
Cheers,
Jeff
Hi,

On 2018-08-14 15:18:55 +0200, Alexis Lê-Quôc wrote:
> We run
> a cluster of
> large, SSD-backed, i3.16xl (64 cores visible to Linux, ~500GB of RAM, with
> 8GB of shared_buffers, fast NVMe drives) nodes
> , each
> running PG 9.3
> on linux
> in a vanilla streaming asynchronous replication setup: 1 primary node, 1
> replica designated for failover (left alone) and 6 read replicas, taking
> queries.

9.3 is extremely old, we've made numerous performance improvements in
areas potentially related to your problem.


> Under normal circumstances this is working exactly as planned but when I
> dial up the number of INSERTs on the primary to ~10k rows per second, or
> roughly 50MB of data per second (not enough to saturate the network between
> nodes)
> , read replicas falls hopelessly and consistently behind until read traffic
> is diverted away
> .

Do you use hot_standby_feedback=on?


> 1. We see read replicas fall behind and we can measure their replication
> throughput to be
> consistently
> 1-2% of what the primary is sustaining, by measuring the replication delay
> (in second) every second. We quickly get
> that metric
> to 0.98-0.99 (1 means that replication is completely stuck
> as it falls behind by one second every second
> ). CPU, memory
> , I/O
> (per core iowait)
> or network
> (throughput)
> as a whole resource are not
> visibly
> maxed out

Are individual *cores* maxed out however? IIUC you're measuring overall
CPU util, right? Recovery (streaming replication apply) is largely
single threaded.


> Here are some settings that may help and a perf profile of a recovery
> process that runs without any competing read traffic processing the INSERT
> backlog (I don't unfortunately have the same profile on a lagging read
> replica).

Unfortunately that's not going to help us much identifying the
contention...


> +   30.25%    26.78%  postgres  postgres           [.] mdnblocks

This I've likely fixed ~two years back:

http://archives.postgresql.org/message-id/72a98a639574d2e25ed94652848555900c81a799


> +   18.64%    18.64%  postgres  postgres           [.] 0x00000000000fde6a

Hm, too bad that this is without a symbol - 18% self is quite a
bit. What perf options are you using?


> +    4.74%     4.74%  postgres  [kernel.kallsyms]  [k]
> copy_user_enhanced_fast_string

Possible that a slightly bigger shared buffer would help you.

It'd probably more helpful to look at a perf report --no-children for
this kind of analysis.

Greetings,

Andres Freund
Hi,

On 2018-08-14 10:46:45 -0700, Andres Freund wrote:
> On 2018-08-14 15:18:55 +0200, Alexis Lê-Quôc wrote:
> > +   30.25%    26.78%  postgres  postgres           [.] mdnblocks
>
> This I've likely fixed ~two years back:
>
> http://archives.postgresql.org/message-id/72a98a639574d2e25ed94652848555900c81a799

Err, wrong keyboard shortcut *and* wrong commit hash:
https://git.postgresql.org/gitweb/?p=postgresql.git;a=commit;h=45e191e3aa62d47a8bc1a33f784286b2051f45cb

- Andres
On Tue, Aug 14, 2018 at 7:50 PM Andres Freund <andres@anarazel.de> wrote:
Hi,
On 2018-08-14 10:46:45 -0700, Andres Freund wrote:
> On 2018-08-14 15:18:55 +0200, Alexis Lê-Quôc wrote:
> > + 30.25% 26.78% postgres postgres [.] mdnblocks
>
> This I've likely fixed ~two years back:
>
> http://archives.postgresql.org/message-id/72a98a639574d2e25ed94652848555900c81a799
Err, wrong keyboard shortcut *and* wrong commit hash:
https://git.postgresql.org/gitweb/?p=postgresql.git;a=commit;h=45e191e3aa62d47a8bc1a33f784286b2051f45cb
- Andres
Thanks for the commit in the first place and the reference now; that's a very logical explanation. We're now off 9.3.
On 2018-08-17 15:21:19 +0200, Alexis Lê-Quôc wrote:
> On Tue, Aug 14, 2018 at 7:50 PM Andres Freund <andres@anarazel.de> wrote:
>
> > Hi,
> >
> > On 2018-08-14 10:46:45 -0700, Andres Freund wrote:
> > > On 2018-08-14 15:18:55 +0200, Alexis Lê-Quôc wrote:
> > > > +   30.25%    26.78%  postgres  postgres           [.] mdnblocks
> > >
> > > This I've likely fixed ~two years back:
> > >
> > >
> > http://archives.postgresql.org/message-id/72a98a639574d2e25ed94652848555900c81a799
> >
> > Err, wrong keyboard shortcut *and* wrong commit hash:
> >
> > https://git.postgresql.org/gitweb/?p=postgresql.git;a=commit;h=45e191e3aa62d47a8bc1a33f784286b2051f45cb
> >
> > - Andres
> >
>
>  Thanks for the commit in the first place and the reference now; that's a
> very logical explanation. We're now off 9.3.

Glad to help. Did the migration appear to have resolved the worst
performance issues?

Greetings,

Andres Freund