Обсуждение: help in analysis of execution plans
Dear all

Could you help me understand these two execution plans for the same
query (query 3 benchmark TPCH www.tpc.org/tpch), executed in two
different environments of Postgresql, as described below. These plans
were generated by the EXPLAIN ANALYZE command, and the time of plan 1
was 4.7 minutes and plan 2 was 2.95 minutes.

Execution Plan 1 (query execution time 4.7 minutes):
- https://explain.depesz.com/s/Ughh
- Postgresql version 10.1 (default) with index on l_shipdate (table lineitem)

Execution Plan 2 (query execution time 2.95 minutes):
- https://explain.depesz.com/s/7Zb7
- Postgresql version 9.5 (version with source code changed by me) with
index on l_orderkey (table lineitem).

Some doubts
- Difference between GroupAggregate and Finalize GroupAggregate
- because some algorithms show measurements on "Disk" and others on
"Memory" example:
     - External sort Disk: 52784kB
     - quicksort Memory: 47770kB

Because one execution plan was much smaller than the other,
considering that the query is the same and the data are the same.
--------------------------------------------------
select
    l_orderkey,
    sum(l_extendedprice * (1 - l_discount)) as revenue,
    o_orderdate,
    o_shippriority
from
    customer,
    orders,
    lineitem
where
    c_mktsegment = 'HOUSEHOLD'
    and c_custkey = o_custkey
    and l_orderkey = o_orderkey
    and o_orderdate < date '1995-03-21'
    and l_shipdate > date '1995-03-21'
group by
    l_orderkey,
    o_orderdate,
    o_shippriority
order by
    revenue desc,
    o_orderdate
--------------------------------------------------

best regards
Further information is that th Postgresql with modified source code, is that I modified some internal functions of cost (source code) and parameters in Postgresql.conf so that it is possible for the DBMS to differentiate cost of read (random and sequence) and write (random and sequence), this is because reading in SSDs' and more than 400 times faster than HDD. This is due to academic research that I am doing.
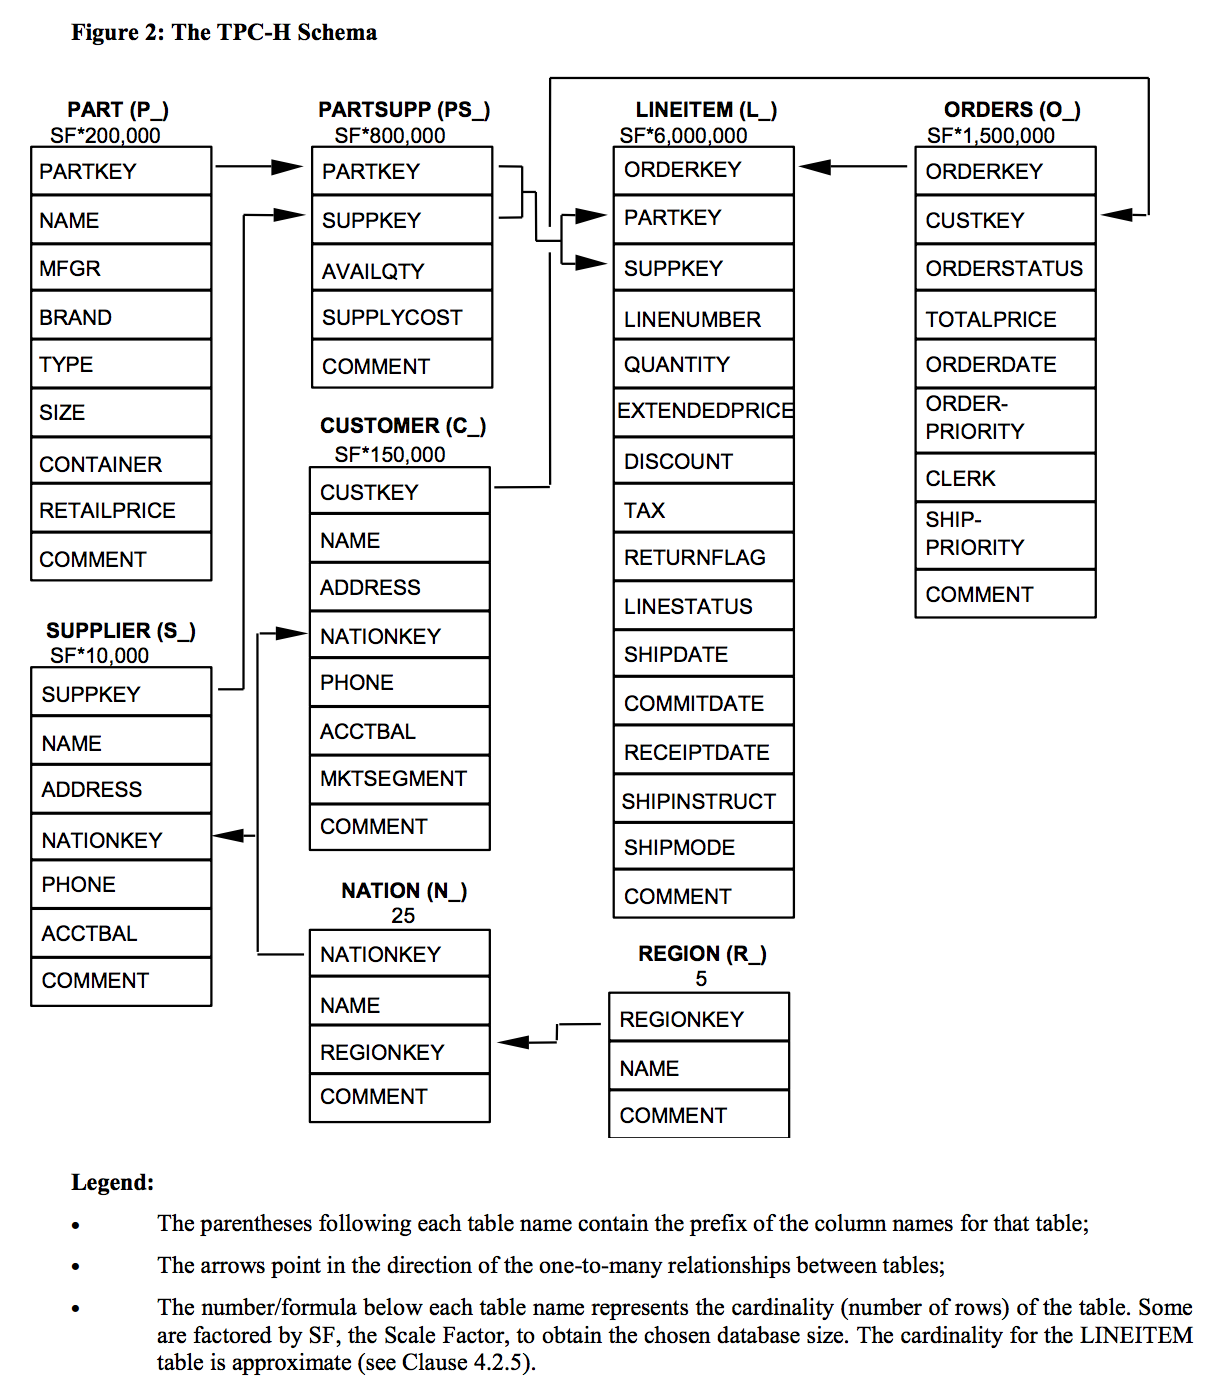
See schema of the tables used below:
https://docs.snowflake.net/manuals/_images/sample-data-tpch-schema.png
I am using 40g scale, in this way the lineitem table has (40 * 6 million) 240 million of the rows.
See schema of the tables used below:
https://docs.snowflake.net/manuals/_images/sample-data-tpch-schema.png
I am using 40g scale, in this way the lineitem table has (40 * 6 million) 240 million of the rows.
Regards
Neto
2018-05-05 8:16 GMT-07:00 Neto pr <netopr9@gmail.com>:
Dear all
Could you help me understand these two execution plans for the same
query (query 3 benchmark TPCH www.tpc.org/tpch), executed in two
different environments of Postgresql, as described below. These plans
were generated by the EXPLAIN ANALYZE command, and the time of plan 1
was 4.7 minutes and plan 2 was 2.95 minutes.
Execution Plan 1 (query execution time 4.7 minutes):
- https://explain.depesz.com/s/Ughh
- Postgresql version 10.1 (default) with index on l_shipdate (table lineitem)
Execution Plan 2 (query execution time 2.95 minutes):
- https://explain.depesz.com/s/7Zb7
- Postgresql version 9.5 (version with source code changed by me) with
index on l_orderkey (table lineitem).
Some doubts
- Difference between GroupAggregate and Finalize GroupAggregate
- because some algorithms show measurements on "Disk" and others on
"Memory" example:
- External sort Disk: 52784kB
- quicksort Memory: 47770kB
Because one execution plan was much smaller than the other,
considering that the query is the same and the data are the same.
--------------------------------------------------
select
l_orderkey,
sum(l_extendedprice * (1 - l_discount)) as revenue,
o_orderdate,
o_shippriority
from
customer,
orders,
lineitem
where
c_mktsegment = 'HOUSEHOLD'
and c_custkey = o_custkey
and l_orderkey = o_orderkey
and o_orderdate < date '1995-03-21'
and l_shipdate > date '1995-03-21'
group by
l_orderkey,
o_orderdate,
o_shippriority
order by
revenue desc,
o_orderdate
--------------------------------------------------
best regards
On 6 May 2018 at 03:16, Neto pr <netopr9@gmail.com> wrote:
> Execution Plan 1 (query execution time 4.7 minutes):
> - https://explain.depesz.com/s/Ughh
> - Postgresql version 10.1 (default) with index on l_shipdate (table lineitem)
>
> Execution Plan 2 (query execution time 2.95 minutes):
> - https://explain.depesz.com/s/7Zb7
> - Postgresql version 9.5 (version with source code changed by me) with
> index on l_orderkey (table lineitem).
>
> Some doubts
> - Difference between GroupAggregate and Finalize GroupAggregate

A Finalize Aggregate node is required to combine the Partially
Aggregated records.  A Partially Aggregated result differs from normal
aggregation as the final function of the aggregate is not called
during partial aggregation.  This allows the finalize aggregate to
combine the partially aggregated results then call the final function.
Imagine an aggregate like AVG() where it goes and internally
calculates the sum and the count of non-null records.  A partial
aggregate node would return {sum, count}, but a normal aggregate would
return {sum / count}.  Having {sum, count} allows each partial
aggregated result to be combined allowing the average to be calculated
with the total_sum / total_count.

> - because some algorithms show measurements on "Disk" and others on
> "Memory" example:
>      - External sort Disk: 52784kB
>      - quicksort Memory: 47770kB

Please read about work_mem in
https://www.postgresql.org/docs/current/static/runtime-config-resource.html

The reason 10.1 is slower with the parallel query is down to the
bitmap heap scan going lossy and scanning many more heap pages than it
expected.  You could solve this in various ways:

1. Increase work_mem enough to prevent the scan from going lossy (see
lossy=1605531 in your plan)
2. turn off enable_bitmapscans (set enable_Bitmapscan = off);
3. Cluster the table on l_shipdate

Unfortunately, parallel query often will choose to use a parallel plan
utilising multiple workers on a less efficient plan when it estimates
the cost / n_workers is lower than the cheapest serial plan's cost.
This appears to also be a contributor to your problem. You may get the
9.5 performance if you disabled parallel query, or did one of the 3
options above.

You may also want to consider using a BRIN index on the l_shipdate
instead of a BTREE index. The cost estimation for BRIN may realise
that the bitmap heap scan is not a good option, although I'm not sure
it'll be better than what the current v10 plan is using.

--
 David Rowley                   http://www.2ndQuadrant.com/
 PostgreSQL Development, 24x7 Support, Training & Services