Обсуждение: [HACKERS] 3D Z-curve spatial index
Hi hackers,
The low-level implementation of 3D Z-curve index
(https://github.com/bmuratshin/zcurve/tree/master)
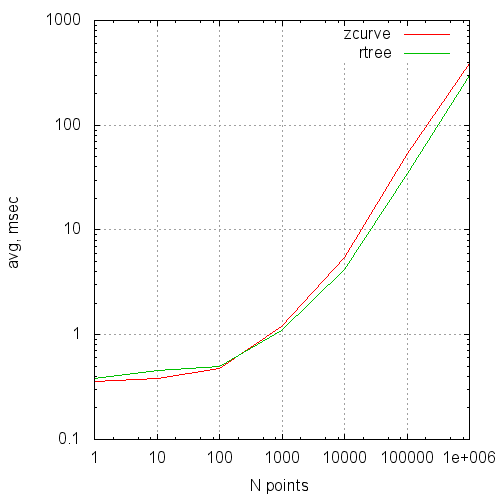
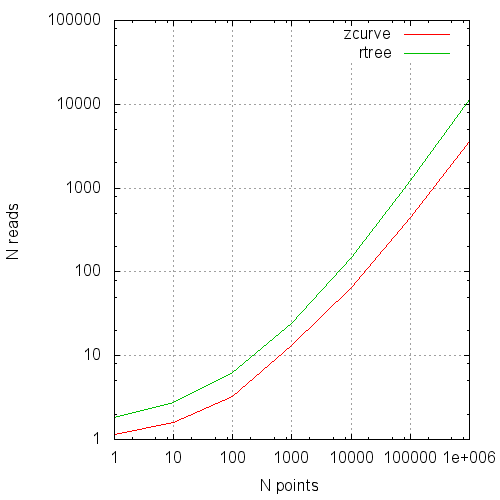
is getting close to GiST R-Tree performance at
significantly lesser number of pages read from disk.
See attached figures,
times2 - average request execution time VS average points number in result
reads2 - average shared reads number VS average points number in result
Feel free to connect with me if you have any questions.
Вложения
On Sat, Feb 04, 2017 at 03:41:29PM +0700, Boris Muratshin wrote:
> Hi hackers,
>
> The low-level implementation of 3D Z-curve index
> (https://github.com/bmuratshin/zcurve/tree/master)
> is getting close to GiST R-Tree performance at
> significantly lesser number of pages read from disk.
>
> See attached figures,
> times2 - average request execution time VS average points number in result
> reads2 - average shared reads number VS average points number in result
>
> Feel free to connect with me if you have any questions.

Please send the actual patch and any documentation you write that
comes with it.

Best,
David.
--
David Fetter <david(at)fetter(dot)org> http://fetter.org/
Phone: +1 415 235 3778  AIM: dfetter666  Yahoo!: dfetter
Skype: davidfetter      XMPP: david(dot)fetter(at)gmail(dot)com

Remember to vote!
Consider donating to Postgres: http://www.postgresql.org/about/donate
The algorithm for 2D is described in articles (in Russian)
https://habrahabr.ru/post/319810/ and
https://habrahabr.ru/post/319096/ .
Goggle-translator generates (IMHO) suitable for understanding text.
3D version article is not finished yet.
The data in figures are obtained in the following way:
1) Test data set is pseudo 3d (x,0,z) array of 100 000 000 random points
2) R-tree for comparison - GiST 2d (x,z)
3) There is a set of experiments by an average number of points in requested random area: 1,10, 100, 1 000, 10 000, 100 000, 1 000 000
4) For each area size I requested a set of random extents (from 100 000 times for 1 point to 100 times for 1 000 000 points).
5) Experiments were done on virtual machine (2 cores, 4Gb) and to exclude noise, all times were got on second (or more) run to warm caches,
reads were got on restarted PosgreSQL.
6) For R-tree, times are very unstable and I used the least one in the series.
Regards, Boris
On Mon, Feb 6, 2017 at 5:08 AM, David Fetter <david@fetter.org> wrote:
Please send the actual patch and any documentation you write that
comes with it.
Best,
David.
--
David Fetter <david(at)fetter(dot)org> http://fetter.org/
Phone: +1 415 235 3778 AIM: dfetter666 Yahoo!: dfetter
Skype: davidfetter XMPP: david(dot)fetter(at)gmail(dot)com
Remember to vote!
Consider donating to Postgres: http://www.postgresql.org/about/donate
On Mon, Feb 06, 2017 at 11:04:12AM +0700, Boris Muratshin wrote:
> The algorithm for 2D is described in articles (in Russian)
> https://habrahabr.ru/post/319810/ and
> https://habrahabr.ru/post/319096/ .
> Goggle-translator generates (IMHO) suitable for understanding text.

Welcome to the community!

I apologize for not being more clear.

Here, it is customary to send a patch rather than a web link when one
has code one wishes to share.  This is for several reasons:

1.  To establish that you are warranting that you have the right to
send the patch, i.e. that it is not legally encumbered in some way.

2.  To ensure that the patch stays in the archives, as large web sites
have gone away in the past, and will in the future.

3.  Because this is how the current development process works.

When I mentioned documentation, I was referring to the operation of
the SQL-callable interface, assuming that there is one.  When people
apply the patch, they need to have some idea what it is supposed to do
and how to make it do those things.  Any difference between what it is
supposed to do and what it actually does a bug, whether in the
implementation, the documentation, or both.

These things and many others are in the
https://wiki.postgresql.org/wiki/Developer_FAQ

Best,
David.
--
David Fetter <david(at)fetter(dot)org> http://fetter.org/
Phone: +1 415 235 3778  AIM: dfetter666  Yahoo!: dfetter
Skype: davidfetter      XMPP: david(dot)fetter(at)gmail(dot)com

Remember to vote!
Consider donating to Postgres: http://www.postgresql.org/about/donate
Thanks David,
I am really a novice in the community.
But thing I wrote about is not a patch to something but a standalone extension.
And I've placed it on github (https://github.com/bmuratshin/zcurve/tree/3D) + attached.
The algorithm is not documented well because it is rather an experimental work
and I am frequently changing the interfaces.
In the README.zcurve file you can find the instruction how to get the numbers in the figures above,
and just in case I'll post it here:
------------------------------------------------------------------------------------------------------------------
To test SQL 3D Z-curve interface (on built and registered extension) you need:
1) Create points table (psql):
create table test_points_3d (x integer,y integer, z integer);
2) Create test dataset:
2.1) Make gawk script, let it be 'mkdata.awk':
BEGIN{
for (i = 0; i < 100000000; i++)
{
x = int(1000000 * rand());
z = int(1000000 * rand());
print "("x",0,"z")";
}
}
2.2) Fill txt file with this script:
gawk -f mkdata.awk > data_3d.csv
3.3) copy it into the table (psql)
COPY test_points_3d from '/home/.../postgresql/contrib/zcurve/data_3d.csv';
3) Create index (psql):
create index zcurve_test_points_3d on test_points_3d(zcurve_num_from_xyz(x, y, z));
4) Create test requests set:
4.1) Make gawk script, let it be 'mktest.awk':
BEGIN{
for (i = 0; i < 100000; i++)
{
x = 1000 * int(1000 * rand());
y = 0;
z = 1000 * int(1000 * rand());
#EXPLAIN (ANALYZE,BUFFERS)
print "select count(1) from zcurve_3d_lookup_tidonly('zcurve_test_points_3d', "x","y","z","x+1000","y+1000","z+1000");";
}
}
box 100X100X1000 gives us 100 points in average
2.2) Fill testing file with this script:
gawk -f mktest.awk > test_100.sql
5) For getting times, run:
date; psql -f test_100.sql ; date;
and divide the difference by 100 000
5) For getting reads,
5.1) insert 'EXPLAIN (ANALYZE,BUFFERS)' into select preparation in gawk script:
5.2) run 'date; psql -f test_100.sql > 100.out ; date;'
5.3) prepare gawk script (let it be 'buf.awk')
BEGIN {
FS="=";
num = 0;
sum = 0;
sum2 = 0;
}
if (NF==3)
{
sum += $3;
sum2 += $2;
}
else if (NF==2)
{
if ($1==" Buffers: shared hit")
sum2 += $2;
else if ($1==" Buffers: read")
sum += $2;
}
num++;
END {
print sum/(num)" "sum2/(num)" "num;
}
5.4) run in over 100.out
gawk -f buf.awk 100.out
5.5) first number in its output is 'shared reads', second - 'shared hits'
------------------------------------------------------------------------------------------------------------------
Regards,
Boris