Обсуждение: high transaction rate
Hi,
I need to tune my database for a high update rate of a single small table. A little simplified it looks like this:
CREATE TABLE temp_agg(
topic TEXT PRIMARY KEY,
tstmp TIMESTAMP,
cnt BIGINT,
sum NUMERIC
)
The table has 500 rows.
A transaction looks simplified like this:
1) select * from temp_agg where topic=$1 for update
2) if date_trunc('second', tstmp)=date_trunc('second', $3) then:
2a) update temp_agg set cnt=cnt+1, sum=sum+$2 where topic=$1
2b) set local synchronous_commit to off
3) if a new second has started:
3a) insert into other_table select * from temp_agg where topic=$1
3b) update temp_agg set tstmp=date_trunc('second', $3) cnt=1, sum=$2 where topic=$1
3c) emit a notification (pg_notify(...)) with the new data
As a first test my program starts 10 writers each of which serves 50 topics. The timestamps are generated in a way that on average 10 timestamps per second per topic a
On Wed, Dec 7, 2016 at 11:21 AM, Torsten Förtsch <tfoertsch123@gmail.com> wrote:
Hi,I need to tune my database for a high update rate of a single small table. A little simplified it looks like this:CREATE TABLE temp_agg(topic TEXT PRIMARY KEY,tstmp TIMESTAMP,cnt BIGINT,sum NUMERIC)The table has 500 rows.A transaction looks simplified like this:1) select * from temp_agg where topic=$1 for update2) if date_trunc('second', tstmp)=date_trunc('second', $3) then:2a) update temp_agg set cnt=cnt+1, sum=sum+$2 where topic=$12b) set local synchronous_commit to off3) if a new second has started:3a) insert into other_table select * from temp_agg where topic=$13b) update temp_agg set tstmp=date_trunc('second', $3) cnt=1, sum=$2 where topic=$13c) emit a notification (pg_notify(...)) with the new data
sorry, hit the wrong button.
As a first test my program starts 10 writers each of which serves 50 topics. The timestamps are generated in a way that on average 10 timestamps per second per topic are produced. That means on average the 2) branch is hit 10 times more often.
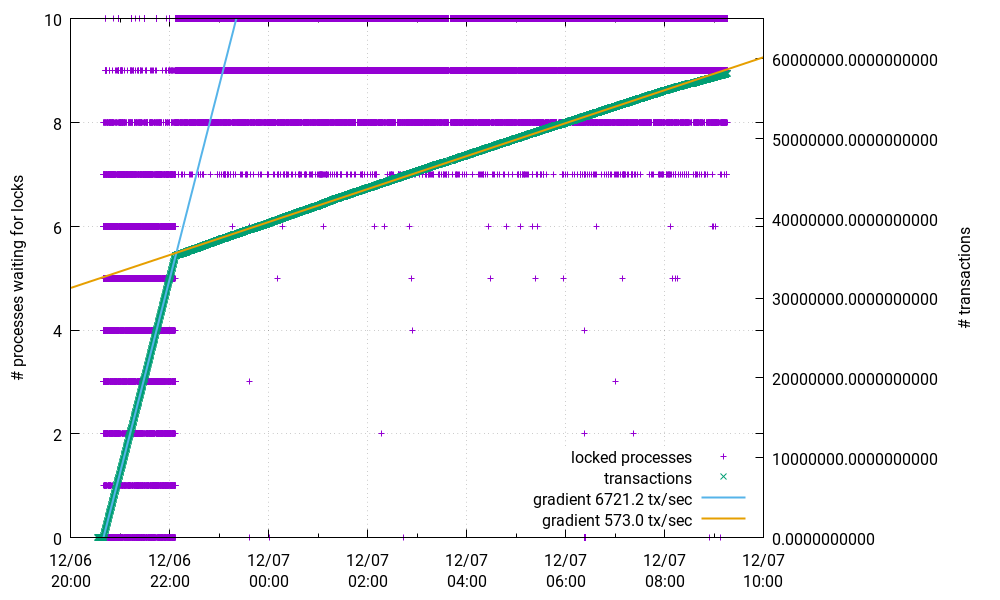
These 10 writers then flood the database. At first I see a really good transaction rate of more than 6500 tx/sec. But after a while it suddenly drops to less than 1/10 of that. I also monitored the number of processes waiting for locks. As can be seen in this picture, this is a locking problem.

Here is a snapshot of not granted locks:
locktype | database | relation | page | tuple | virtualxid | transactionid | classid | objid | objsubid | virtualtransaction | pid | mode | granted | fastpath
----------+----------+----------+--------+--------+------------+---------------+---------+-------+----------+--------------------+-------+---------------------+---------+----------
object | 0 | <NULL> | <NULL> | <NULL> | <NULL> | <NULL> | 1262 | 0 | 0 | 15/6381185 | 11468 | AccessExclusiveLock | f | f
object | 0 | <NULL> | <NULL> | <NULL> | <NULL> | <NULL> | 1262 | 0 | 0 | 13/6375058 | 11465 | AccessExclusiveLock | f | f
object | 0 | <NULL> | <NULL> | <NULL> | <NULL> | <NULL> | 1262 | 0 | 0 | 9/6373397 | 11463 | AccessExclusiveLock | f | f
object | 0 | <NULL> | <NULL> | <NULL> | <NULL> | <NULL> | 1262 | 0 | 0 | 11/6380027 | 11464 | AccessExclusiveLock | f | f
object | 0 | <NULL> | <NULL> | <NULL> | <NULL> | <NULL> | 1262 | 0 | 0 | 3/447139 | 11133 | AccessExclusiveLock | f | f
object | 0 | <NULL> | <NULL> | <NULL> | <NULL> | <NULL> | 1262 | 0 | 0 | 7/6375244 | 11461 | AccessExclusiveLock | f | f
object | 0 | <NULL> | <NULL> | <NULL> | <NULL> | <NULL> | 1262 | 0 | 0 | 16/6381714 | 11467 | AccessExclusiveLock | f | f
object | 0 | <NULL> | <NULL> | <NULL> | <NULL> | <NULL> | 1262 | 0 | 0 | 10/6380578 | 11460 | AccessExclusiveLock | f | f
object | 0 | <NULL> | <NULL> | <NULL> | <NULL> | <NULL> | 1262 | 0 | 0 | 8/6374490 | 11459 | AccessExclusiveLock | f | f
object | 0 | <NULL> | <NULL> | <NULL> | <NULL> | <NULL> | 1262 | 0 | 0 | 12/6377255 | 11462 | AccessExclusiveLock | f | f
What are these object locks here? How can I prevent contention?
This is pgdg postgres 9.5
Thanks,
Torsten
Вложения
On Wed, Dec 7, 2016 at 11:31 AM, Torsten Förtsch <tfoertsch123@gmail.com> wrote:
On Wed, Dec 7, 2016 at 11:21 AM, Torsten Förtsch <tfoertsch123@gmail.com> wrote:Hi,I need to tune my database for a high update rate of a single small table. A little simplified it looks like this:CREATE TABLE temp_agg(topic TEXT PRIMARY KEY,tstmp TIMESTAMP,cnt BIGINT,sum NUMERIC)The table has 500 rows.A transaction looks simplified like this:1) select * from temp_agg where topic=$1 for update2) if date_trunc('second', tstmp)=date_trunc('second', $3) then:2a) update temp_agg set cnt=cnt+1, sum=sum+$2 where topic=$12b) set local synchronous_commit to off3) if a new second has started:3a) insert into other_table select * from temp_agg where topic=$13b) update temp_agg set tstmp=date_trunc('second', $3) cnt=1, sum=$2 where topic=$13c) emit a notification (pg_notify(...)) with the new datasorry, hit the wrong button.As a first test my program starts 10 writers each of which serves 50 topics. The timestamps are generated in a way that on average 10 timestamps per second per topic are produced. That means on average the 2) branch is hit 10 times more often.These 10 writers then flood the database. At first I see a really good transaction rate of more than 6500 tx/sec. But after a while it suddenly drops to less than 1/10 of that. I also monitored the number of processes waiting for locks. As can be seen in this picture, this is a locking problem.
Here is a snapshot of not granted locks:locktype | database | relation | page | tuple | virtualxid | transactionid | classid | objid | objsubid | virtualtransaction | pid | mode | granted | fastpath
----------+----------+----------+--------+--------+--------- ---+---------------+---------+ -------+----------+----------- ---------+-------+------------ ---------+---------+----------
object | 0 | <NULL> | <NULL> | <NULL> | <NULL> | <NULL> | 1262 | 0 | 0 | 15/6381185 | 11468 | AccessExclusiveLock | f | f
object | 0 | <NULL> | <NULL> | <NULL> | <NULL> | <NULL> | 1262 | 0 | 0 | 13/6375058 | 11465 | AccessExclusiveLock | f | f
object | 0 | <NULL> | <NULL> | <NULL> | <NULL> | <NULL> | 1262 | 0 | 0 | 9/6373397 | 11463 | AccessExclusiveLock | f | f
object | 0 | <NULL> | <NULL> | <NULL> | <NULL> | <NULL> | 1262 | 0 | 0 | 11/6380027 | 11464 | AccessExclusiveLock | f | f
object | 0 | <NULL> | <NULL> | <NULL> | <NULL> | <NULL> | 1262 | 0 | 0 | 3/447139 | 11133 | AccessExclusiveLock | f | f
object | 0 | <NULL> | <NULL> | <NULL> | <NULL> | <NULL> | 1262 | 0 | 0 | 7/6375244 | 11461 | AccessExclusiveLock | f | f
object | 0 | <NULL> | <NULL> | <NULL> | <NULL> | <NULL> | 1262 | 0 | 0 | 16/6381714 | 11467 | AccessExclusiveLock | f | f
object | 0 | <NULL> | <NULL> | <NULL> | <NULL> | <NULL> | 1262 | 0 | 0 | 10/6380578 | 11460 | AccessExclusiveLock | f | f
object | 0 | <NULL> | <NULL> | <NULL> | <NULL> | <NULL> | 1262 | 0 | 0 | 8/6374490 | 11459 | AccessExclusiveLock | f | f
object | 0 | <NULL> | <NULL> | <NULL> | <NULL> | <NULL> | 1262 | 0 | 0 | 12/6377255 | 11462 | AccessExclusiveLock | f | fWhat are these object locks here? How can I prevent contention?This is pgdg postgres 9.5

1262 is 'pg_database'::regclass::oid
I don't know for sure but things I would worry about given the performance profile are:
1. NUMA swap insanity
1. NUMA swap insanity
2. Accumulation of dead tuples leading to what should be very short operations taking longer.
No idea of that is helpful but where I would probably start
Thanks,Torsten
Best Wishes,
Chris Travers
Efficito: Hosted Accounting and ERP. Robust and Flexible. No vendor lock-in.
Вложения
Think I found it. classid 1262 is pg_database and I seem to remember that NOTIFY takes that lock. I dropped pg_notify from my function and got immediately >3500 tx/sec.
On Wed, Dec 7, 2016 at 11:31 AM, Torsten Förtsch <tfoertsch123@gmail.com> wrote:
On Wed, Dec 7, 2016 at 11:21 AM, Torsten Förtsch <tfoertsch123@gmail.com> wrote:Hi,I need to tune my database for a high update rate of a single small table. A little simplified it looks like this:CREATE TABLE temp_agg(topic TEXT PRIMARY KEY,tstmp TIMESTAMP,cnt BIGINT,sum NUMERIC)The table has 500 rows.A transaction looks simplified like this:1) select * from temp_agg where topic=$1 for update2) if date_trunc('second', tstmp)=date_trunc('second', $3) then:2a) update temp_agg set cnt=cnt+1, sum=sum+$2 where topic=$12b) set local synchronous_commit to off3) if a new second has started:3a) insert into other_table select * from temp_agg where topic=$13b) update temp_agg set tstmp=date_trunc('second', $3) cnt=1, sum=$2 where topic=$13c) emit a notification (pg_notify(...)) with the new datasorry, hit the wrong button.As a first test my program starts 10 writers each of which serves 50 topics. The timestamps are generated in a way that on average 10 timestamps per second per topic are produced. That means on average the 2) branch is hit 10 times more often.These 10 writers then flood the database. At first I see a really good transaction rate of more than 6500 tx/sec. But after a while it suddenly drops to less than 1/10 of that. I also monitored the number of processes waiting for locks. As can be seen in this picture, this is a locking problem.
Here is a snapshot of not granted locks:locktype | database | relation | page | tuple | virtualxid | transactionid | classid | objid | objsubid | virtualtransaction | pid | mode | granted | fastpath
----------+----------+----------+--------+--------+--------- ---+---------------+---------+ -------+----------+----------- ---------+-------+------------ ---------+---------+----------
object | 0 | <NULL> | <NULL> | <NULL> | <NULL> | <NULL> | 1262 | 0 | 0 | 15/6381185 | 11468 | AccessExclusiveLock | f | f
object | 0 | <NULL> | <NULL> | <NULL> | <NULL> | <NULL> | 1262 | 0 | 0 | 13/6375058 | 11465 | AccessExclusiveLock | f | f
object | 0 | <NULL> | <NULL> | <NULL> | <NULL> | <NULL> | 1262 | 0 | 0 | 9/6373397 | 11463 | AccessExclusiveLock | f | f
object | 0 | <NULL> | <NULL> | <NULL> | <NULL> | <NULL> | 1262 | 0 | 0 | 11/6380027 | 11464 | AccessExclusiveLock | f | f
object | 0 | <NULL> | <NULL> | <NULL> | <NULL> | <NULL> | 1262 | 0 | 0 | 3/447139 | 11133 | AccessExclusiveLock | f | f
object | 0 | <NULL> | <NULL> | <NULL> | <NULL> | <NULL> | 1262 | 0 | 0 | 7/6375244 | 11461 | AccessExclusiveLock | f | f
object | 0 | <NULL> | <NULL> | <NULL> | <NULL> | <NULL> | 1262 | 0 | 0 | 16/6381714 | 11467 | AccessExclusiveLock | f | f
object | 0 | <NULL> | <NULL> | <NULL> | <NULL> | <NULL> | 1262 | 0 | 0 | 10/6380578 | 11460 | AccessExclusiveLock | f | f
object | 0 | <NULL> | <NULL> | <NULL> | <NULL> | <NULL> | 1262 | 0 | 0 | 8/6374490 | 11459 | AccessExclusiveLock | f | f
object | 0 | <NULL> | <NULL> | <NULL> | <NULL> | <NULL> | 1262 | 0 | 0 | 12/6377255 | 11462 | AccessExclusiveLock | f | fWhat are these object locks here? How can I prevent contention?This is pgdg postgres 9.5Thanks,Torsten
Вложения
2. Accumulation of dead tuples leading to what should be very short operations taking longer.
Please tell me that in this case, updating 2 (big)integer columns does not generate dead tuples (i.e. does not involve a insert/delete pair).No idea of that is helpful but where I would probably start
On 12/7/2016 8:47 AM, Rob Sargent wrote:
> Please tell me that in this case, updating 2 (big)integer columns does
> not generate dead tuples (i.e. does not involve a insert/delete pair).

if the fields being updated aren't indexed, and there's free tuple space
that has already been vacuumed in the same block, then the update is
done via "HOT" (or is it HEAT?) within the same block... but with 1000s
of updates per second to the same 500 rows ?  odds of autovacuum keeping
up are sketchy..    otherwise, all updates are insert/delete operations
due to the requirements of MVCC

a SQL database may not really be the best way to do what you're
doing.    an array of your 500 rows, updated in memory, with updates
logged to a transaction file and the whole array periodically written to
disk, would very likely be MUCH higher performance..


--
john r pierce, recycling bits in santa cruz
On 12/07/2016 09:58 AM, John R Pierce wrote:
> On 12/7/2016 8:47 AM, Rob Sargent wrote:
>> Please tell me that in this case, updating 2 (big)integer columns
>> does not generate dead tuples (i.e. does not involve a insert/delete
>> pair).
>
> if the fields being updated aren't indexed, and there's free tuple
> space that has already been vacuumed in the same block, then the
> update is done via "HOT" (or is it HEAT?) within the same block... but
> with 1000s of updates per second to the same 500 rows ?  odds of
> autovacuum keeping up are sketchy..    otherwise, all updates are
> insert/delete operations due to the requirements of MVCC
How does your reply change, if at all, if:
  - Fields not index
  - 5000 hot records per 100K records (millions of records total)
  - A dozen machines writing 1 update per 10 seconds (one machine
writing every 2 mins)
  - - each to a different "5000"
   or (two modes of operation)
  - - each to same "5000"

My guess this would be slow enough even in the second mode?  Or at this
rate and style should I care?
Sorry for taking this off from OP's point
On 12/7/2016 2:23 PM, Rob Sargent wrote:
> How does your reply change, if at all, if:
>  - Fields not index
>  - 5000 hot records per 100K records (millions of records total)
>  - A dozen machines writing 1 update per 10 seconds (one machine
> writing every 2 mins)
>  - - each to a different "5000"
>   or (two modes of operation)
>  - - each to same "5000"
>
> My guess this would be slow enough even in the second mode?  Or at
> this rate and style should I care?
> Sorry for taking this off from OP's point

thats 1 update of 5000 records every 2 minutes per each of 12 client
hosts?   thats still a fair amount of tuples/second and in a table with
millions of records, the vacuum will have a lot more to go through.

9.6 has some potentially significant enhancements in how autovacuum
operates with respect to incrementally freezing blocks.


if you think your update patterns can take advantage of HOT, its a good
idea to set the FILL_FACTOR of the table prior to populating it, maybe
to 50% ?  this will make the initial table twice as large, but provide
freespace in every block for these in-block HOT operations.

for a table that large, you'll definitely need to crank up the
aggressiveness of autovacuum if you hope to keep up with that number of
stale tuples distributed among millions of records.


--
john r pierce, recycling bits in santa cruz
On 12/07/2016 03:32 PM, John R Pierce wrote:
> On 12/7/2016 2:23 PM, Rob Sargent wrote:
>> How does your reply change, if at all, if:
>>  - Fields not index
>>  - 5000 hot records per 100K records (millions of records total)
>>  - A dozen machines writing 1 update per 10 seconds (one machine
>> writing every 2 mins)
>>  - - each to a different "5000"
>>   or (two modes of operation)
>>  - - each to same "5000"
>>
>> My guess this would be slow enough even in the second mode?  Or at
>> this rate and style should I care?
>> Sorry for taking this off from OP's point
>
> thats 1 update of 5000 records every 2 minutes per each of 12 client
> hosts?   thats still a fair amount of tuples/second and in a table
> with millions of records, the vacuum will have a lot more to go through.
>
> 9.6 has some potentially significant enhancements in how autovacuum
> operates with respect to incrementally freezing blocks.
>
>
> if you think your update patterns can take advantage of HOT, its a
> good idea to set the FILL_FACTOR of the table prior to populating it,
> maybe to 50% ?  this will make the initial table twice as large, but
> provide freespace in every block for these in-block HOT operations.
>
> for a table that large, you'll definitely need to crank up the
> aggressiveness of autovacuum if you hope to keep up with that number
> of stale tuples distributed among millions of records.
>
>
Much appreciated - endOfOffTopic :)