Обсуждение: [PATCH] pgbench --throttle (submission 4)
Minor changes wrt to the previous submission, so as to avoid running some
stuff twice under some conditions. This is for reference to the next
commit fest.

--
Fabien.
Hi,
It would be better to submit updated versions of a patch on the email thread it is dedicated to and not create a new thread so as people can easily follow the progress you are doing.--
Michael
Michael
Simpler version of 'pgbench --throttle' by handling throttling at the
beginning of the transaction instead of doing it at the end.

This is for reference to the next commitfest.

--
Fabien.
New submission which put option help in alphabetical position, as
per Peter Eisentraut f0ed3a8a99b052d2d5e0b6153a8907b90c486636

This is for reference to the next commitfest.

--
Fabien.
New submission for the next commit fest.

This new version also reports the average lag time, i.e. the delay between
scheduled and actual transaction start times. This may help detect whether
things went smothly, or if at some time some delay was introduced because
of the load and some catchup was done afterwards.

Question 1: should it report the maximum lang encountered?

Question 2: the next step would be to have the current lag shown under
option --progress, but that would mean having a combined --throttle
--progress patch submission, or maybe dependencies between patches.

--
Fabien.
On 6/1/13 5:00 AM, Fabien COELHO wrote:
> Question 1: should it report the maximum lang encountered?
I haven't found the lag measurement to be very useful yet, outside of
debugging the feature itself. Accordingly I don't see a reason to add
even more statistics about the number outside of testing the code. I'm
seeing some weird lag problems that this will be useful for though right
now, more on that a few places below.
> Question 2: the next step would be to have the current lag shown under
> option --progress, but that would mean having a combined --throttle
> --progress patch submission, or maybe dependencies between patches.
This is getting too far ahead. Let's get the throttle part nailed down
before introducing even more moving parts into this. I've attached an
updated patch that changes a few things around already. I'm not done
with this yet and it needs some more review before commit, but it's not
too far away from being ready.
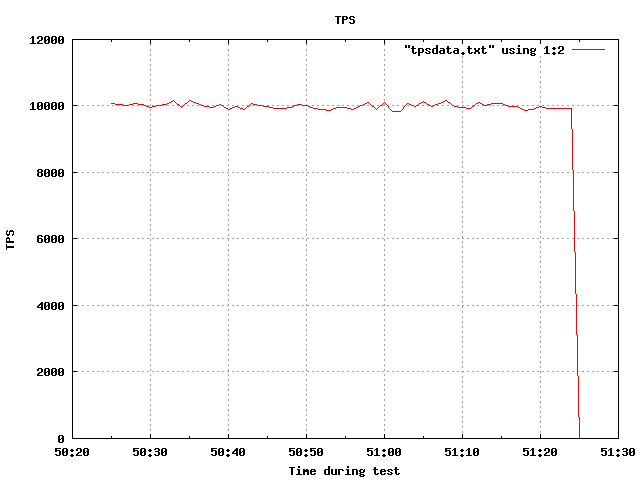
This feature works quite well. On a system that will run at 25K TPS
without any limit, I did a run with 25 clients and a rate of 400/second,
aiming at 10,000 TPS, and that's what I got:
number of clients: 25
number of threads: 1
duration: 60 s
number of transactions actually processed: 599620
average transaction lag: 0.307 ms
tps = 9954.779317 (including connections establishing)
tps = 9964.947522 (excluding connections establishing)
I never thought of implementing the throttle like this before, but it
seems to work out well so far. Check out tps.png to see the smoothness
of the TPS curve (the graphs came out of pgbench-tools. There's a
little more play outside of the target than ideal for this case. Maybe
it's worth tightening the Poisson curve a bit around its center?
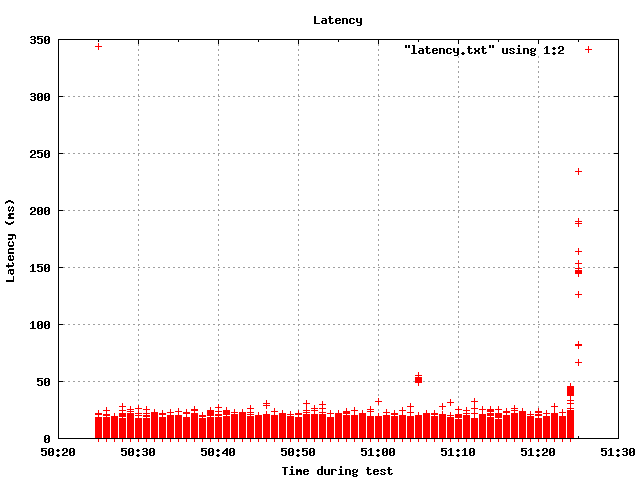
The main implementation issue I haven't looked into yet is why things
can get weird at the end of the run. See the latency.png graph attached
and you can see what I mean.
I didn't like the naming on this option or all of the ways you could
specify the delay. None of those really added anything, since you can
get every other behavior by specifying a non-integer TPS. And using the
word "throttle" inside the code is fine, but I didn't like exposing that
implementation detail more than it had to be.
What I did instead was think of this as a transaction rate target, which
makes the help a whole lot simpler:
-R SPEC, --rate SPEC
target rate per client in transactions per second
Made the documentation easier to write too. I'm not quite done with
that yet, the docs wording in this updated patch could still be better.
I personally would like this better if --rate specified a *total* rate
across all clients. However, there are examples of both types of
settings in the program already, so there's no one precedent for which
is right here. -t is per-client and now -R is too; I'd prefer it to be
like -T instead. It's not that important though, and the code is
cleaner as it's written right now. Maybe this is better; I'm not sure.
I did some basic error handling checks on this and they seemed good, the
program rejects target rates of <=0.
On the topic of this weird latency spike issue, I did see that show up
in some of the results too. Here's one where I tried to specify a rate
higher than the system can actually handle, 80000 TPS total on a
SELECT-only test
$ pgbench -S -T 30 -c 8 -j 4 -R10000tps pgbench
starting vacuum...end.
transaction type: SELECT only
scaling factor: 100
query mode: simple
number of clients: 8
number of threads: 4
duration: 30 s
number of transactions actually processed: 761779
average transaction lag: 10298.380 ms
tps = 25392.312544 (including connections establishing)
tps = 25397.294583 (excluding connections establishing)
It was actually limited by the capabilities of the hardware, 25K TPS.
10298 ms of lag per transaction can't be right though.
Some general patch submission suggestions for you as a new contributor:
-When re-submitting something with improvements, it's a good idea to add
a version number to the patch so reviewers can tell them apart easily.
But there is no reason to change the subject line of the e-mail each
time. I followed that standard here. If you updated this again I would
name the file pgbench-throttle-v9.patch but keep the same e-mail subject.
-There were some extra carriage return characters in your last
submission. Wasn't a problem this time, but if you can get rid of those
that makes for a better patch.
--
Greg Smith 2ndQuadrant US greg@2ndQuadrant.com Baltimore, MD
PostgreSQL Training, Services, and 24x7 Support www.2ndQuadrant.com
Вложения
Hello Greg,

Thanks for this very detailed review and the suggestions!

I'll submit a new patch

>> Question 1: should it report the maximum lang encountered?
>
> I haven't found the lag measurement to be very useful yet, outside of
> debugging the feature itself.  Accordingly I don't see a reason to add even
> more statistics about the number outside of testing the code.  I'm seeing
> some weird lag problems that this will be useful for though right now, more
> on that a few places below.

I'll explain below why it is really interesting to get this figure, and
that it is not really available as precisely elsewhere.

>> Question 2: the next step would be to have the current lag shown under
>> option --progress, but that would mean having a combined --throttle
>> --progress patch submission, or maybe dependencies between patches.
>
> This is getting too far ahead.

Ok!

> Let's get the throttle part nailed down before introducing even more
> moving parts into this.  I've attached an updated patch that changes a
> few things around already.  I'm not done with this yet and it needs some
> more review before commit, but it's not too far away from being ready.

Ok. I'll submit a new version by the end of the week.

> This feature works quite well.  On a system that will run at 25K TPS without
> any limit, I did a run with 25 clients and a rate of 400/second, aiming at
> 10,000 TPS, and that's what I got:
>
> number of clients: 25
> number of threads: 1
> duration: 60 s
> number of transactions actually processed: 599620
> average transaction lag: 0.307 ms
> tps = 9954.779317 (including connections establishing)
> tps = 9964.947522 (excluding connections establishing)
>
> I never thought of implementing the throttle like this before,

Stochastic processes are a little bit magic:-)

> but it seems to work out well so far.  Check out tps.png to see the
> smoothness of the TPS curve (the graphs came out of pgbench-tools.
> There's a little more play outside of the target than ideal for this
> case.  Maybe it's worth tightening the Poisson curve a bit around its
> center?

The point of a Poisson distribution is to model random events the kind of
which are a little bit irregular, such as web requests or queuing clients
at a taxi stop. I cannot really change the formula, but if you want to
argue with Siméon Denis Poisson, hist current address is 19th section of
"Père Lachaise" graveyard in Paris:-)

More seriously, the only parameter that can be changed is the "1000000.0"
which drives the granularity of the Poisson process. A smaller value would
mean a smaller potential multiplier; that is how far from the average time
the schedule can go. This may come under "tightening", although it would
depart from a "perfect" process and possibly may be a little less
"smooth"... for a given definition of "tight", "perfect" and "smooth":-)

> [...] What I did instead was think of this as a transaction rate target,
> which makes the help a whole lot simpler:
>
>  -R SPEC, --rate SPEC
>               target rate per client in transactions per second

Ok, I'm fine with this name.

> Made the documentation easier to write too.  I'm not quite done with that
> yet, the docs wording in this updated patch could still be better.

I'm not an English native speaker, any help is welcome here. I'll do my
best.

> I personally would like this better if --rate specified a *total* rate across
> all clients.

Ok, I can do that, with some reworking so that the stochastic process is
shared by all threads instead of being within each client. This mean that
a lock between threads to access some variables, which should not impact
the test much. Another option is to have a per-thread stochastic process.

> However, there are examples of both types of settings in the
> program already, so there's no one precedent for which is right here.  -t is
> per-client and now -R is too; I'd prefer it to be like -T instead.  It's not
> that important though, and the code is cleaner as it's written right now.
> Maybe this is better; I'm not sure.

I like the idea of just one process instead of a per-client one. I did not
try at the beginning because the implementation is less straightforward.

> On the topic of this weird latency spike issue, I did see that show up in
> some of the results too.

Your example illustrates *exactly* why the lag measure was added.

The Poisson processes generate an ideal event line (that is irregularly
scheduled transaction start times targetting the expected tps) which
induces a varrying load that the database is trying to handle.

If it cannot start right away, this means that some transactions are
differed with respect to their schedule start time. The measure latency
reports exactly that: the clients do not handle the load. There may be
some catchup later, that is the clients come back in line with the
scheduled transactions.

I need to put this measure here because the "schedluled time" is only
known to pgbench and not available elsewhere. The max would really be more
interesting than the mean, so as to catch that some things were
temporarily amiss, even if things went back to nominal later.

> Here's one where I tried to specify a rate higher
> than the system can actually handle, 80000 TPS total on a SELECT-only test
>
> $ pgbench -S -T 30 -c 8 -j 4 -R10000tps pgbench
> starting vacuum...end.
> transaction type: SELECT only
> scaling factor: 100
> query mode: simple
> number of clients: 8
> number of threads: 4
> duration: 30 s
> number of transactions actually processed: 761779
> average transaction lag: 10298.380 ms

The interpretation is the following: as the database cannot handle the
load, transactions were processed on average 10 seconds behind their
scheduled transaction time. You had on average a 10 second latency to
answer "incoming" requests. Also some transactions where implicitely not
even scheduled, so the situation is worse than that...

> tps = 25392.312544 (including connections establishing)
> tps = 25397.294583 (excluding connections establishing)
>
> It was actually limited by the capabilities of the hardware, 25K TPS. 10298
> ms of lag per transaction can't be right though.
>
> Some general patch submission suggestions for you as a new contributor:

Hmmm, I did a few things such as "pgxs" back in 2004, so maybe "not very
active" is a better description than "new":-)

> -When re-submitting something with improvements, it's a good idea to add a
> version number to the patch so reviewers can tell them apart easily. But
> there is no reason to change the subject line of the e-mail each time.  I
> followed that standard here.  If you updated this again I would name the file
> pgbench-throttle-v9.patch but keep the same e-mail subject.

Ok.

> -There were some extra carriage return characters in your last submission.
> Wasn't a problem this time, but if you can get rid of those that makes for a
> better patch.

Ok.

--
Fabien.
Here is submission v9 based on your v8 version.
 - the tps is global, with a mutex to share the global stochastic process - there is an adaptation for the "fork"
emulation- I do not know wheter this works with Win32 pthread stuff. - reduced multiplier ln(1000000) -> ln(1000) - avg
&max throttling lag are reported


> There's a little more play outside of the target than ideal for this
> case.  Maybe it's worth tightening the Poisson curve a bit around its
> center?

A stochastic process moves around the target value, but is not right on
it.

--
Fabien.
On 6/10/13 6:02 PM, Fabien COELHO wrote:
>   - the tps is global, with a mutex to share the global stochastic process
>   - there is an adaptation for the "fork" emulation
>   - I do not know wheter this works with Win32 pthread stuff.

Instead of this complexity, can we just split the TPS input per client?  That's all I was thinking of here, not adding
anew set of threading

issues.  If 10000 TPS is requested and there's 10 clients, just set the
delay so that each of them targets 1000 TPS.

I'm guessing it's more accurate to have them all communicate as you've
done here, but it seems like a whole class of new bugs and potential
bottlenecks could come out of that.  Whenever someone touches the
threading model for pgbench it usually gives a stack of build farm
headaches.  Better to avoid those unless there's really a compelling
reason to go through that.

--
Greg Smith   2ndQuadrant US    greg@2ndQuadrant.com   Baltimore, MD
PostgreSQL Training, Services, and 24x7 Support www.2ndQuadrant.com
>>   - the tps is global, with a mutex to share the global stochastic process
>>   - there is an adaptation for the "fork" emulation
>>   - I do not know wheter this works with Win32 pthread stuff.
>
> Instead of this complexity,

Well, the mutex impact is very localized in the code. The complexity is
more linked to the three "thread" implementations intermixed there.

> can we just split the TPS input per client?

Obviously it is possible. Note that it is more logical to do that per
thread. I did one shared stochastic process because it makes more sense to
have just one.

> That's all I was thinking of here, not adding a new set of threading issues.
> If 10000 TPS is requested and there's 10 clients, just set the delay so that
> each of them targets 1000 TPS.

Ok, so I understand that a mutex is too much!

> I'm guessing it's more accurate to have them all communicate as you've done
> here, but it seems like a whole class of new bugs and potential bottlenecks
> could come out of that.

I do not think that there is a performance or locking contension issue: it
is about getting a mutex for a section which performs one integer add and
two integer assignements, that is about 3 instructions, to be compared
with the task of performing database operations over the network. There
are several orders of magnitudes between those tasks. It would need a more
than terrible mutex implementation to have any significant impact.

> Whenever someone touches the threading model for pgbench it usually
> gives a stack of build farm headaches.  Better to avoid those unless
> there's really a compelling reason to go through that.

I agree that the threading model in pgbench is a mess, mostly because of
the 3 concurrent implementations intermixed in the code. Getting rid of
the fork emulation and win32 special handling and only keeping the pthread
implementation, which seems to be available even on windows, would be a
relief. I'm not sure if there is still a rationale to have these 3
implementations, but it ensures a maintenance mess:-(

I'll submit a version without mutex, but ISTM that this one is
conceptually cleaner, although I'm not sure about what happens on windows.

--
Fabien.
Submission 10:
 - per thread throttling instead of a global process with a mutex.   this avoids a mutex, and the process is shared
betweenclients   of a given thread.

 - ISTM that there "thread start time" should be initialized at the   beginning of threadRun instead of in the loop
*before*thread creation,   otherwise the thread creation delays are incorporated in the   performance measure, but ISTM
thatthe point of pgbench is not to   measure thread creation performance...

   I've added a comment suggesting where it should be put instead,   first thing in threadRun.

--
Fabien.
On 6/11/13 4:11 PM, Fabien COELHO wrote:
>   - ISTM that there "thread start time" should be initialized at the
>     beginning of threadRun instead of in the loop *before* thread creation,
>     otherwise the thread creation delays are incorporated in the
>     performance measure, but ISTM that the point of pgbench is not to
>     measure thread creation performance...

I noticed that, but it seemed a pretty minor issue.  Did you look at the
giant latency spikes at the end of the test run I submitted the graph
for?  I wanted to nail down what was causing those before worrying about
the startup timing.

--
Greg Smith   2ndQuadrant US    greg@2ndQuadrant.com   Baltimore, MD
PostgreSQL Training, Services, and 24x7 Support www.2ndQuadrant.com
>>   - ISTM that there "thread start time" should be initialized at the
>>     beginning of threadRun instead of in the loop *before* thread creation,
>>     otherwise the thread creation delays are incorporated in the
>>     performance measure, but ISTM that the point of pgbench is not to
>>     measure thread creation performance...
>
> I noticed that, but it seemed a pretty minor issue.

Not for me, because the "max lag" measured in my first version was really
the threads creation time, not very interesting.

> Did you look at the giant latency spikes at the end of the test run I
> submitted the graph for?

I've looked at the graph you sent. I must admit that I did not understand
exactly what is measured and where it is measured. Because of its position
at the end of the run, I thought of some disconnection related effects
when pgbench run is interrupted by a time out signal, so some things are
done more slowly. Fine with me, we are stopping anyway, and out of the
steady state.

> I wanted to nail down what was causing those before worrying about the
> startup timing.

Well, the short answer is that I'm not worried by that, for the reason
explained above. I would be worried if it was anywhere else but where the
transactions are interrupted, the connections are closed and the threads
are stopped. I may be wrong:-)

--
Fabien.
> Did you look at the giant latency spikes at the end of the test run I
> submitted the graph for?  I wanted to nail down what was causing those
> before worrying about the startup timing.

If you are still worried: if you run the very same command without
throttling and measure the same latency, does the same thing happens at
the end? My guess is that it should be "yes". If it is no, I'll try out
pgbench-tools.

--
Fabien.
On 6/12/13 3:19 AM, Fabien COELHO wrote:
> If you are still worried: if you run the very same command without
> throttling and measure the same latency, does the same thing happens at
> the end? My guess is that it should be "yes". If it is no, I'll try out
> pgbench-tools.

It looks like it happens rarely for one client without the rate limit,
but that increases to every time for multiple client with limiting in
place.  pgbench-tools just graphs the output from the latency log.
Here's a setup that runs the test I'm doing:

$ createdb pgbench
$ pgbench -i -s 10 pgbench
$ pgbench -S -c 25 -T 30 -l pgbench && tail -n 40 pgbench_log*

Sometimes there's no slow entries. but I've seen this once so far:

0 21822 1801 0 1371217462 945264
1 21483 1796 0 1371217462 945300
8 20891 1931 0 1371217462 945335
14 20520 2084 0 1371217462 945374
15 20517 1991 0 1371217462 945410
16 20393 1928 0 1371217462 945444
17 20183 2000 0 1371217462 945479
18 20277 2209 0 1371217462 945514
23 20316 2114 0 1371217462 945549
22 20267 250128 0 1371217463 193656

The third column is the latency for that transaction.  Notice how it's a
steady ~2000 us except for the very last transaction, which takes
250,128 us.  That's the weird thing; these short SELECT statements
should never take that long.  It suggests there's something weird
happening with how the client exits, probably that its latency number is
being computed after more work than it should.

Here's what a rate limited run looks like for me.  Note that I'm still
using the version I re-submitted since that's where I ran into this
issue, I haven't merged your changes to split the rate among each client
here--which means this is 400 TPS per client == 10000 TPS total:

$ pgbench -S -c 25 -T 30 -R 400 -l pgbench && tail -n 40 pgbench_log

7 12049 2070 0 1371217859 195994
22 12064 2228 0 1371217859 196115
18 11957 1570 0 1371217859 196243
23 12130 989 0 1371217859 196374
8 11922 1598 0 1371217859 196646
11 12229 4833 0 1371217859 196702
21 11981 1943 0 1371217859 196754
20 11930 1026 0 1371217859 196799
14 11990 13119 0 1371217859 208014        ^^^ fast section
vvv delayed section
1 11982 91926 0 1371217859 287862
2 12033 116601 0 1371217859 308644
6 12195 115957 0 1371217859 308735
17 12130 114375 0 1371217859 308776
0 12026 115507 0 1371217859 308822
3 11948 118228 0 1371217859 308859
4 12061 113484 0 1371217859 308897
5 12110 113586 0 1371217859 308933
9 12032 117744 0 1371217859 308969
10 12045 114626 0 1371217859 308989
12 11953 113372 0 1371217859 309030
13 11883 114405 0 1371217859 309066
15 12018 116069 0 1371217859 309101
16 11890 115727 0 1371217859 309137
19 12140 114006 0 1371217859 309177
24 11884 115782 0 1371217859 309212

There's almost 90,000 usec of latency showing up between epoch time
1371217859.208014 and 1371217859.287862 here.  What's weird about it is
that the longer the test runs, the larger the gap is.  If collecting the
latency data itself caused the problem, that would make sense, so maybe
this is related to flushing that out to disk.

If you want to look just at the latency numbers without the other
columns in the way you can use:

cat pgbench_log.* | awk {'print $3'}

That is how I was evaluating the smoothness of the rate limit, by
graphing those latency values.  pgbench-tools takes those and a derived
TPS/s number and plots them, which made it easier for me to spot this
weirdness.  But I've already moved onto analyzing the raw latency data
instead, I can see the issue without the graph once I've duplicated the
conditions.

--
Greg Smith   2ndQuadrant US    greg@2ndQuadrant.com   Baltimore, MD
PostgreSQL Training, Services, and 24x7 Support www.2ndQuadrant.com
I don't have this resolved yet, but I think I've identified the cause.
Updating here mainly so Fabien doesn't duplicate my work trying to track
this down.  I'm going to keep banging at this until it's resolved now
that I got this far.

Here's a slow transaction:

1371226017.568515 client 1 executing \set naccounts 100000 * :scale
1371226017.568537 client 1 throttling 6191 us
1371226017.747858 client 1 executing \setrandom aid 1 :naccounts
1371226017.747872 client 1 sending SELECT abalance FROM pgbench_accounts
WHERE aid = 268721;
1371226017.789816 client 1 receiving

That confirms it is getting stuck at the "throttling" step.  Looks like
the code pauses there because it's trying to overload the "sleeping"
state that was already in pgbench, but handle it in a special way inside
of doCustom(), and that doesn't always work.

The problem is that pgbench doesn't always stay inside doCustom when a
client sleeps.  It exits there to poll for incoming messages from the
other clients, via select() on a shared socket.  It's not safe to assume
doCustom will be running regularly; that's only true if clients keep
returning messages.

So as long as other clients keep banging on the shared socket, doCustom
is called regularly, and everything works as expected.  But at the end
of the test run that happens less often, and that's when the problem
shows up.

pgbench already has a "\sleep" command, and the way that delay is
handled happens inside threadRun() instead.  The pausing of the rate
limit throttle needs to operate in the same place.  I have to redo a few
things to confirm this actually fixes the issue, as well as look at
Fabien's later updates to this since I wandered off debugging.  I'm sure
it's in the area of code I'm poking at now though.

--
Greg Smith   2ndQuadrant US    greg@2ndQuadrant.com   Baltimore, MD
PostgreSQL Training, Services, and 24x7 Support www.2ndQuadrant.com
> pgbench already has a "\sleep" command, and the way that delay is
> handled happens inside threadRun() instead.  The pausing of the rate
> limit throttle needs to operate in the same place.

It does operate at the same place. The throttling is performed by
inserting a "sleep" first thing when starting a new transaction. So if
their is a weirdness, it should show as well without throttling but with a
fixed \sleep instead?

--
Fabien.
Hello Greg,

I think that the weirdness really comes from the way transactions times
are measured, their interactions with throttling, and latent bugs in the
code.

One issue is that the throttling time was included in the measure, but not
the first time because "txn_begin" is not set at the beginning of
doCustom.

Also, flag st->listen is set to 1 but *never* set back to 0... sh> grep listen pgbench.c        int
listen;       if (st->listen)                        st->listen = 1;                        st->listen = 1;
          st->listen = 1;                        st->listen = 1;                                st->listen = 1;
                      st->listen = 1;


ISTM that I can fix the "weirdness" by inserting an ugly "goto top;", but
I would feel better about it by removing all gotos and reordering some
actions in doCustom in a more logical way. However that would be a bigger
patch.

Please find attached 2 patches:
 - the first is the full throttle patch which ensures that the   txn_begin is taken at a consistent point, after
throttling,  which requires resetting "listen". There is an ugly goto.   I've also put times in a consistent format in
thelog,   "789.012345" instead of "789 12345".

 - the second patch just shows the diff between v10 and the first one.

--
Fabien.
On 6/14/13 3:50 PM, Fabien COELHO wrote:
> I think that the weirdness really comes from the way transactions times
> are measured, their interactions with throttling, and latent bugs in the
> code.

measurement times, no; interactions with throttling, no.  If it was
either of those I'd have finished this off days ago.  Latent bugs,
possibly.  We may discover there's nothing wrong with your code at the
end here, that it just makes hitting this bug more likely.
Unfortunately today is the day *some* bug is popping up, and I want to
get it squashed before I'll be happy.

The lag is actually happening during a kernel call that isn't working as
expected.  I'm not sure whether this bug was there all along if \sleep
was used, or if it's specific to the throttle sleep.
> Also, flag st->listen is set to 1 but *never* set back to 0...

I noticed that st-listen was weird too, and that's on my short list of
suspicious things I haven't figured out yet.

I added a bunch more logging as pgbench steps through its work to track
down where it's stuck at.  Until the end all transactions look like this:

1371238832.084783 client 10 throttle lag 2 us
1371238832.084783 client 10 executing \setrandom aid 1 :naccounts
1371238832.084803 client 10 sending SELECT abalance FROM
pgbench_accounts WHERE aid = 753099;
1371238832.084840 calling select
1371238832.086539 client 10 receiving
1371238832.086539 client 10 finished

All clients who hit lag spikes at the end are going through this
sequence instead:

1371238832.085912 client 13 throttle lag 790 us
1371238832.085912 client 13 executing \setrandom aid 1 :naccounts
1371238832.085931 client 13 sending SELECT abalance FROM
pgbench_accounts WHERE aid = 564894;
1371238832.086592 client 13 receiving
1371238832.086662 calling select
1371238832.235543 client 13 receiving
1371238832.235543 client 13 finished

Note the "calling select" here that wasn't in the normal length
transaction before it.  The client is receiving something here, but
rather than it finishing the transaction it falls through and ends up at
the select() system call outside of doCustom.  All of the clients that
are sleeping when the system slips into one of these long select() calls
are getting stuck behind it.  I'm not 100% sure, but I think this only
happens when all remaining clients are sleeping.

Here's another one, it hits the receive that doesn't finish the
transaction earlier (1371238832.086587) but then falls into the same
select() call at 1371238832.086662:

1371238832.085884 client 12 throttle lag 799 us
1371238832.085884 client 12 executing \setrandom aid 1 :naccounts
1371238832.085903 client 12 sending SELECT abalance FROM
pgbench_accounts WHERE aid = 299080;
1371238832.086587 client 12 receiving
1371238832.086662 calling select
1371238832.231032 client 12 receiving
1371238832.231032 client 12 finished

Investigation is still going here...

--
Greg Smith   2ndQuadrant US    greg@2ndQuadrant.com   Baltimore, MD
PostgreSQL Training, Services, and 24x7 Support www.2ndQuadrant.com
>> I think that the weirdness really comes from the way transactions times
>> are measured, their interactions with throttling, and latent bugs in the
>> code.
>
> measurement times, no; interactions with throttling, no.  If it was either of
> those I'd have finished this off days ago.  Latent bugs, possibly.  We may
> discover there's nothing wrong with your code at the end here,

To summarize my point: I think my v10 code does not take into account all
of the strangeness in doCustom, and I'm pretty sure that there is no point
in including thottle sleeps into latency measures, which was more or less
the case. So it is somehow a "bug" which only shows up if you look at the
latency measures, but the tps are fine.

> that it just makes hitting this bug more likely. Unfortunately today is
> the day *some* bug is popping up, and I want to get it squashed before
> I'll be happy.
>
> The lag is actually happening during a kernel call that isn't working as
> expected.  I'm not sure whether this bug was there all along if \sleep was
> used, or if it's specific to the throttle sleep.

The throttle sleep is inserted out of the state machine. That is why in
the "test" patch I added a goto to ensure that it is always taken at the
right time, that is when state==0 and before txn_begin is set, and not
possibly between other states when doCustom happens to be recalled after a
return.

> I added a bunch more logging as pgbench steps through its work to track down
> where it's stuck at.  Until the end all transactions look like this:
>
> 1371238832.084783 client 10 throttle lag 2 us
> 1371238832.084783 client 10 executing \setrandom aid 1 :naccounts
> 1371238832.084803 client 10 sending SELECT abalance FROM pgbench_accounts
> WHERE aid = 753099;
> 1371238832.084840 calling select
> 1371238832.086539 client 10 receiving
> 1371238832.086539 client 10 finished
>
> All clients who hit lag spikes at the end are going through this sequence    > instead:
>
> 1371238832.085912 client 13 throttle lag 790 us
> 1371238832.085912 client 13 executing \setrandom aid 1 :naccounts
> 1371238832.085931 client 13 sending SELECT abalance FROM pgbench_accounts
> WHERE aid = 564894;
> 1371238832.086592 client 13 receiving
> 1371238832.086662 calling select
> 1371238832.235543 client 13 receiving
> 1371238832.235543 client 13 finished

> Note the "calling select" here that wasn't in the normal length transaction
> before it.  The client is receiving something here, but rather than it
> finishing the transaction it falls through and ends up at the select() system
> call outside of doCustom.  All of the clients that are sleeping when the
> system slips into one of these long select() calls are getting stuck behind
> it.  I'm not 100% sure, but I think this only happens when all remaining
> clients are sleeping.

Note: in both the slow cases there is a "receiving" between "sending" and
"select". This suggests that the "goto top" at the very end of doCustom is
followed in one case but not the other.

ISTM that there is a timeout passed to select which is computed based on
the current sleeping time of each client. I'm pretty sure that not a well
tested path...

--
Fabien.
Hello Greg,

I've done some more testing with the "test" patch. I have not seen any
spike at the end of the throttled run.

The attached version 11 patch does ensure that throttle added sleeps are
not included in latency measures (-r) and that throttling is performed
right at the beginning of a transaction. There is an ugly goto to do that.

I think there is still a latent bug in the code with listen which should
be set back to 0 in other places, but this bug is already there.

--
Fabien.
I'm still getting the same sort of pauses waiting for input with your
v11.  This is a pretty frustrating problem; I've spent about two days so
far trying to narrow down how it happens.  I've attached the test
program I'm using.  It seems related to my picking a throttled rate
that's close to (but below) the maximum possible on your system.  I'm
using 10,000 on a system that can do about 16,000 TPS when running
pgbench in debug mode.

This problem is 100% reproducible here; happens every time.  This is a
laptop running Mac OS X.  It's possible the problem is specific to that
platform.  I'm doing all my tests with the database itself setup for
development, with debug and assertions on.  The lag spikes seem smaller
without assertions on, but they are still there.

Here's a sample:

transaction type: SELECT only
scaling factor: 10
query mode: simple
number of clients: 25
number of threads: 1
duration: 30 s
number of transactions actually processed: 301921
average transaction lag: 1.133 ms (max 137.683 ms)
tps = 10011.527543 (including connections establishing)
tps = 10027.834189 (excluding connections establishing)

And those slow ones are all at the end of the latency log file, as shown
in column 3 here:

22 11953 3369 0 1371578126 954881
23 11926 3370 0 1371578126 954918
3 12238 30310 0 1371578126 984634
7 12205 30350 0 1371578126 984742
8 12207 30359 0 1371578126 984792
11 12176 30325 0 1371578126 984837
13 12074 30292 0 1371578126 984882
0 12288 175452 0 1371578127 126340
9 12194 171948 0 1371578127 126421
12 12139 171915 0 1371578127 126466
24 11876 175657 0 1371578127 126507

Note that there are two long pauses here, which happens maybe half of
the time.  There's a 27 ms pause and then a 145 ms one.

The exact sequence for when the pauses show up is:

-All remaining clients have sent their SELECT statement and are waiting
for a response.  They are not sleeping, they're waiting for the server
to return a query result.
-A client receives part of the data it wants, but there is still data
left.  This is the path through pgbench.c where the "if
(PQisBusy(st->con))" test is true after receiving some information.  I
hacked up some logging that distinguishes those as a "client %d partial
receive" to make this visible.
-A select() call is made with no timeout, so it can only be satisfied by
more data being returned.
-Around ~100ms (can be less, can be more) goes by before that select()
returns more data to the client, where normally it would happen in ~2ms.

You were concerned about a possible bug in the timeout code.  If you
hack up the select statement to show some state information, the setup
for the pauses at the end always looks like this:

calling select min_usec=9223372036854775807 sleeping=0

When no one is sleeping, the timeout becomes infinite, so only returning
data will break it.  This is intended behavior though.  This exact same
sequence and select() call parameters happen in pgbench code every time
at the end of a run.  But clients without the throttling patch applied
never seem to get into the state where they pause for so long, waiting
for one of the active clients to receive the next bit of result.

I don't think the st->listen related code has anything to do with this
either.  That flag is only used to track when clients have completed
sending their first query over to the server.  Once reaching that point
once, afterward they should be "listening" for results each time they
exit the doCustom() code.  st->listen goes to 1 very soon after startup
and then it stays there, and that logic seems fine too.

--
Greg Smith   2ndQuadrant US    greg@2ndQuadrant.com   Baltimore, MD
PostgreSQL Training, Services, and 24x7 Support www.2ndQuadrant.com
Вложения
> I'm still getting the same sort of pauses waiting for input with your v11.

Alas.

> This is a pretty frustrating problem; I've spent about two days so far trying
> to narrow down how it happens.  I've attached the test program I'm using.  It
> seems related to my picking a throttled rate that's close to (but below) the
> maximum possible on your system.  I'm using 10,000 on a system that can do
> about 16,000 TPS when running pgbench in debug mode.
>
> This problem is 100% reproducible here; happens every time.  This is a laptop
> running Mac OS X.  It's possible the problem is specific to that platform.
> I'm doing all my tests with the database itself setup for development, with
> debug and assertions on.  The lag spikes seem smaller without assertions on,
> but they are still there.
>
> Here's a sample:
>
> transaction type: SELECT only

What is this test script? I'm doing pgbench for tests.

> scaling factor: 10
> query mode: simple
> number of clients: 25
> number of threads: 1
> duration: 30 s
> number of transactions actually processed: 301921
> average transaction lag: 1.133 ms (max 137.683 ms)
> tps = 10011.527543 (including connections establishing)
> tps = 10027.834189 (excluding connections establishing)
>
> And those slow ones are all at the end of the latency log file, as shown in
> column 3 here:
>
> 22 11953 3369 0 1371578126 954881
> 23 11926 3370 0 1371578126 954918
> 3 12238 30310 0 1371578126 984634
> 7 12205 30350 0 1371578126 984742
> 8 12207 30359 0 1371578126 984792
> 11 12176 30325 0 1371578126 984837
> 13 12074 30292 0 1371578126 984882
> 0 12288 175452 0 1371578127 126340
> 9 12194 171948 0 1371578127 126421
> 12 12139 171915 0 1371578127 126466
> 24 11876 175657 0 1371578127 126507

Indeed, there are two spikes, but not all clients are concerned.

As I have not seen that, debuging is hard. I'll give it a try on
tomorrow.

> When no one is sleeping, the timeout becomes infinite, so only returning data
> will break it.  This is intended behavior though.

This is not coherent. Under --throttle there should basically always be
someone asleep, unless the server cannot cope with the load and *all*
transactions are late. A no time out state looks pretty unrealistic,
because it means that there is no throttling.

> I don't think the st->listen related code has anything to do with this
> either.  That flag is only used to track when clients have completed sending
> their first query over to the server.  Once reaching that point once,
> afterward they should be "listening" for results each time they exit the
> doCustom() code.

This assumption seems false if you can have a "sleep" at the beginning of
the sequence, which is what throttle is doing, but can be done by any
custom script, so that the client is expected to wait before sending any
command, thus there can be no select underway in that case.

So listen should be set to 1 when a select as been sent, and set back to 0
when the result data have all been received.

"doCustom" makes implicit assumptions about what is going on, whereas it
should focus on looking at the incoming state, performing operations, and
leaving with a state which correspond to the actual status, without
assumptions about what is going to happen next.

> st->listen goes to 1 very soon after startup and then it stays there,
> and that logic seems fine too.

--
Fabien.
> number of transactions actually processed: 301921

Just a thought before spending too much time on this subtle issue.

The patch worked reasonnably for 301900 transactions in your above run,
and the few last ones, less than the number of clients, show strange
latency figures which suggest that something is amiss in some corner case
when pgbench is stopping. However, the point of pgbench is to test a
steady state, not to achieve the cleanest stop at the end of a run.

So my question is: should this issue be a blocker wrt to the feature?

--
Fabien.
On Wed, Jun 19, 2013 at 2:42 PM, Fabien COELHO <coelho@cri.ensmp.fr> wrote:
>> number of transactions actually processed: 301921
> Just a thought before spending too much time on this subtle issue.
>
> The patch worked reasonnably for 301900 transactions in your above run, and
> the few last ones, less than the number of clients, show strange latency
> figures which suggest that something is amiss in some corner case when
> pgbench is stopping. However, the point of pgbench is to test a steady
> state, not to achieve the cleanest stop at the end of a run.
>
> So my question is: should this issue be a blocker wrt to the feature?

I think so.  If it doesn't get fixed now, it's not likely to get fixed
later.  And the fact that nobody understands why it's happening is
kinda worrisome...

--
Robert Haas
EnterpriseDB: http://www.enterprisedb.com
The Enterprise PostgreSQL Company
Dear Robert and Greg,

> I think so.  If it doesn't get fixed now, it's not likely to get fixed
> later.  And the fact that nobody understands why it's happening is
> kinda worrisome...

Possibly, but I thing that it is not my fault:-)

So, I spent some time at performance debugging...

First, I finally succeeded in reproducing Greg Smith spikes on my ubuntu
laptop. It needs short transactions and many clients per thread so as to
be a spike. With "pgbench" standard transactions and not too many clients
per thread it is more of a little bump, or even it is not there at all.

After some poking around, and pursuing various red herrings, I resorted to
measure the delay for calling "PQfinish()", which is really the only
special thing going around at the end of pgbench run...

BINGO!

In his tests Greg is using one thread. Once the overall timer is exceeded,
clients start closing their connections by calling PQfinish once their
transactions are done. This call takes between a few us and a few ... ms.
So if some client closing time hit the bad figures, the transactions of
other clients are artificially delayed by this time, and it seems they
have a high latency, but it is really because the thread is in another
client's PQfinish and was not available to process the data. If you have
one thread per client, no problem, especially as the final PQfinish() time
is not measured at all by pgbench:-) Also, the more clients, the higher
the spike because more are to be stopped and may hit the bad figures.

Here is a trace, with the simple SELECT transaction.
  sh> ./pgbench --rate=14000 -T 10 -r -l -c 30 -S bench  ...
  sh> less pgbench_log.*
 # short transactions, about 0.250 ms ... 20 4849 241 0 1371916583.455400 21 4844 256 0 1371916583.455470 22 4832 348 0
1371916583.45556923 4829 218 0 1371916583.455627

   ** TIMER EXCEEDED **
 25 4722 390 0 1371916583.455820 25 done in 1560 [1,2]              # BING, 1560 us for PQfinish() 26 4557 1969 0
1371916583.45740726 done in 21 [1,2] 27 4372 1969 0 1371916583.457447 27 done in 19 [1,2] 28 4009 1910 0
1371916583.45748628 done in 1445 [1,2]              # BOUM 2 interrupted in 1300 [0,0]        # BANG 3 interrupted in
15[0,0] 4 interrupted in 40 [0,0] 5 interrupted in 203 [0,0]         # boum? 6 interrupted in 1352 [0,0]        # ZIP 7
interruptedin 18 [0,0] ... 23 interrupted in 12 [0,0]

 ## the cumulated PQfinish() time above is about 6 ms which ## appears as an apparent latency for the next clients:
  0 4880 6521 0 1371916583.462157  0 done in 9 [1,2]  1 4877 6397 0 1371916583.462194  1 done in 9 [1,2] 24 4807 6796 0
1371916583.46221724 done in 9 [1,2] ...


Note that the bad measures also appear when there is no throttling:
  sh> ./pgbench -T 10 -r -l -c 30 -S bench  sh> grep 'done.*[0-9][0-9][0-9]' pgbench_log.*   0 done in 1974 [1,2]   1
donein 312 [1,2]   3 done in 2159 [1,2]   7 done in 409 [1,2]  11 done in 393 [1,2]  12 done in 2212 [1,2]  13 done in
1458[1,2]  ## other clients execute PQfinish in less than 100 us


This "done" is issued by my instrumented version of clientDone().

The issue does also appear if I instrument pgbench from master, without
anything from the throttling patch at all:
  sh> git diff master  diff --git a/contrib/pgbench/pgbench.c b/contrib/pgbench/pgbench.c  index 1303217..7c5ea81
100644 --- a/contrib/pgbench/pgbench.c  +++ b/contrib/pgbench/pgbench.c  @@ -869,7 +869,15 @@ clientDone(CState *st,
boolok)

          if (st->con != NULL)          {  +               instr_time now;  +               int64 s0, s1;  +
  INSTR_TIME_SET_CURRENT(now);  +               s0 = INSTR_TIME_GET_MICROSEC(now);                  PQfinish(st->con);
+              INSTR_TIME_SET_CURRENT(now);  +               s1 = INSTR_TIME_GET_MICROSEC(now);  +
fprintf(stderr,"%d done in %ld [%d,%d]\n",  +                               st->id, s1-s0, st->listen, st->state);
           st->con = NULL;          }          return false;                           /* always false */

  sh> ./pgbench -T 10 -r -l -c 30 -S bench 2> x.err
  sh> grep 'done.*[0-9][0-9][0-9]' x.err  14 done in 1985 [1,2]  16 done in 276 [1,2]  17 done in 1418 [1,2]

So my argumented conclusion is that the issue is somewhere within
PQfinish(), possibly in interaction with pgbench doings, but is *NOT*
related in any way to the throttling patch, as it is preexisting it. Gregs
stumbled upon it because he looked at latencies.

I'll submit a slightly improved v12 shortly.

--
Fabien.
Please find attached a v12, which under timer_exceeded interrupts clients
which are being throttled instead of waiting for the end of the
transaction, as the transaction is not started yet.

I've also changed the log format that I used for debugging the apparent
latency issue:
  x y z 12345677 1234 -> x y z 12345677.001234

It seems much clearer that way.

--
Fabien.
> Please find attached a v12, which under timer_exceeded interrupts clients
> which are being throttled instead of waiting for the end of the transaction,
> as the transaction is not started yet.

Oops, I forgot the attachment. Here it is!

--
Fabien.
> So my argumented conclusion is that the issue is somewhere within PQfinish(),
> possibly in interaction with pgbench doings, but is *NOT* related in any way
> to the throttling patch, as it is preexisting it. Gregs stumbled upon it
> because he looked at latencies.

An additional thought:

The latency measures *elapsed* time. As a small laptop is running 30
clients and their server processes at a significant load, there are a lot
of context switching going on, so maybe it just happens that the pgbench
process is switched off and then on as PQfinish() is running, so the point
would really be that the host is loaded and that's it. I'm not sure of the
likelyhood of such an event. It is possible that would be more frequent
after timer_exceeded because the system is closing postgres processes, and
would depend on what the kernel process scheduler does.

So the explanation would be: your system is loaded, and it shows in subtle
ways here and there when you do detailed measures. That is life.

Basically this is a summary my (long) experience with performance
experiments on computers. What are you really measuring? What is really
happening?

When a system is loaded, there are many things which interact one with the
other and induce particular effects on performance measures. So usually
what is measured is not what one is expecting.

Greg thought that he was measuring transaction latencies, but it was
really client contention in a thread. I thought that I was measuring
PQfinish() time, but maybe it is the probability of a context switch.

--
Fabien.
> An additional thought:

Yet another thought, hopefully final on this subject.

I think that the probability of a context switch is higher when calling
PQfinish than in other parts of pgbench because it contains system calls
(e.g. closing the network connection) where the kernel is likely to stop
this process and activate another one.

--
Fabien.
> Please find attached a v12, which under timer_exceeded interrupts
> clients which are being throttled instead of waiting for the end of the
> transaction, as the transaction is not started yet.

Please find attached a v13 which fixes conflicts introduced by the long
options patch committed by Robert Haas.

--
Fabien.
On 6/22/13 12:54 PM, Fabien COELHO wrote:
> After some poking around, and pursuing various red herrings, I resorted
> to measure the delay for calling "PQfinish()", which is really the only
> special thing going around at the end of pgbench run...

This wasn't what I was seeing, but it's related.  I've proved to myself
the throttle change isn't reponsible for the weird stuff I'm seeing now.  I'd like to rearrange when PQfinish happens
nowbased on what I'm

seeing, but that's not related to this review.

I duplicated the PQfinish problem you found too.  On my Linux system,
calls to PQfinish are normally about 36 us long.  They will sometimes
get lost for >15ms before they return.  That's a different problem
though, because the ones I'm seeing on my Mac are sometimes >150ms.
PQfinish never takes quite that long.

PQfinish doesn't pause for a long time on this platform.  But it does
*something* that causes socket select() polling to stutter.  I have
instrumented everything interesting in this part of the pgbench code,
and here is the problem event.

1372531862.062236 select with no timeout sleeping=0
1372531862.109111 select returned 6 sockets latency 46875 us

Here select() is called with 0 sleeping processes, 11 that are done, and
14 that are running.  The running ones have all sent SELECT statements
to the server, and they are waiting for a response.  Some of them
received some data from the server, but they haven't gotten the entire
response back.  (The PQfinish calls could be involved in how that happened)

With that setup, select runs for 47 *ms* before it gets the next byte to
a client.  During that time 6 clients get responses back to it, but it
stays stuck in there for a long time anyway.  Why?  I don't know exactly
why, but I am sure that pgbench isn't doing anything weird.  It's either
libpq acting funny, or the OS.  When pgbench is waiting on a set of
sockets, and none of them are returning anything, that's interesting.
But there's nothing pgbench can do about it.

The cause/effect here is that the randomness to the throttling code
spreads out when all the connections end a bit. There are more times
during which you might have 20 connections finished while 5 still run.

I need to catch up with revisions done to this feature since I started
instrumenting my copy more heavily.  I hope I can get this ready for
commit by Monday.  I've certainly beaten on the feature for long enough now.

--
Greg Smith   2ndQuadrant US    greg@2ndQuadrant.com   Baltimore, MD
PostgreSQL Training, Services, and 24x7 Support www.2ndQuadrant.com
> [...] Why?  I don't know exactly why, but I am sure that pgbench isn't
> doing anything weird.  It's either libpq acting funny, or the OS.

My guess is the OS. "PQfinish" or "select" do/are systems calls that
present opportunities to switch context. I think that the OS is passing
time with other processes on the same host, expecially postgres backends,
when it is not with the client. In order to test that, pgbench should run
on a dedicated box with less threads than the number of available cores,
or user time could be measured in addition to elapsed time. Also, testing
with many clients per thread means that if any client is stuck all other
clients incur an artificial latency: measures are intrinsically fragile.

> I need to catch up with revisions done to this feature since I started
> instrumenting my copy more heavily.  I hope I can get this ready for
> commit by Monday.

Ok, thanks!

--
Fabien.
On 06/29/2013 04:11 PM, Greg Smith wrote:
> I need to catch up with revisions done to this feature since I started
> instrumenting my copy more heavily.  I hope I can get this ready for
> commit by Monday.  I've certainly beaten on the feature for long enough
> now.

Greg, any progress?  Haven't seen an update on this in 10 days.

--
Josh Berkus
PostgreSQL Experts Inc.
http://pgexperts.com
On 6/30/13 2:04 AM, Fabien COELHO wrote:
> My guess is the OS. "PQfinish" or "select" do/are systems calls that
> present opportunities to switch context. I think that the OS is passing
> time with other processes on the same host, expecially postgres
> backends, when it is not with the client.

I went looking for other instances of this issue in pgbench results,
that's what I got lost in the last two weeks.  It's subtle because the
clients normally all end in one very short burst of time, but I have
found evidence of PQfinish issues elsewhere.  Evidence still seems to
match the theory that throttling highlights this only because it spreads
out the ending a bit more.  Also, it happens to be a lot worse on the
Mac I did initial testing with, and I don't have nearly as many Mac
pgbench results.

There's a refactoring possible here that seems to make this whole class
of problem go away.  If I change pgbench so that PQfinish isn't called
for any client until *all* of the clients are actually finished with
transactions, the whole issue goes away.  I'm going to package that hack
the right way into its own little change, revisit the throttling code,
and then this all should wrap up nicely.  I'd like to get this one out
of the commitfest so I can move onto looking at something else.

--
Greg Smith   2ndQuadrant US    greg@2ndQuadrant.com   Baltimore, MD
PostgreSQL Training, Services, and 24x7 Support www.2ndQuadrant.com
Hello Greg,

> There's a refactoring possible here that seems to make this whole class of
> problem go away.  If I change pgbench so that PQfinish isn't called for any
> client until *all* of the clients are actually finished with transactions,
> the whole issue goes away.

Sure. If the explanation is that because of the load the OS is just
switching to a "postgres" process while PQfinish is being called, then
waiting for the end of other transactions means that "postgres" processes
don't have anything to do anymore, so process switching is much less
likely, so nothing would show up... However this is really hiding the
underlying fact from the measures rather than solving anything, IMHO.

> I'm going to package that hack the right way into its own little change,
> revisit the throttling code, and then this all should wrap up nicely.

My 0.02€: if it means adding complexity to the pgbench code, I think that
it is not worth it. The point of pgbench is to look at a steady state, not
to end in the most graceful possible way as far as measures are concerned.
On the other end, if it does not add too much complexity, why not!

> I'd like to get this one out of the commitfest so I can move onto
> looking at something else.

Thanks.

--
Fabien.
On 7/13/13 12:13 PM, Fabien COELHO wrote:
> My 0.02€: if it means adding complexity to the pgbench code, I think
> that it is not worth it. The point of pgbench is to look at a steady
> state, not to end in the most graceful possible way as far as measures
> are concerned.

That's how some people use pgbench.  I'm just as likely to use it to
characterize system latency.  If there's a source of latency that's
specific to the pgbench code, I want that out of there even if it's hard.

But we don't have to argue about that because it isn't.  The attached
new patch seems to fix the latency spikes at the end, with -2 lines of
new code!  With that resolved I did a final pass across the rate limit
code too, attached as a v14 and ready for a committer.  I don't really
care what order these two changes are committed, there's no hard
dependency, but I would like to see them both go in eventually.

No functional code was changed from your v13 except for tweaking the
output.  The main thing I did was expand/edit comments and rename a few
variables to try and make this easier to read.  If you have any
objections to my cosmetic changes feel free to post an update.  I've put
a good bit of time into trying to simplify this further, thinking it
can't really be this hard.  But this seems to be the minimum complexity
that still works given the mess of the pgbench state machine.  Every
change I try now breaks something.

To wrap up the test results motivating my little pgbench-delay-finish
patch, the throttled cases that were always giving >100ms of latency
clustered at the end here now look like this:

average rate limit lag: 0.181 ms (max 53.108 ms)
tps = 10088.727398 (including connections establishing)
tps = 10105.775864 (excluding connections establishing)

There are still some of these cases where latency spikes, but they're
not as big and they're randomly distributed throughout the run.  The
problem I had with the ones at the end is how they tended to happen a
few times in a row.  I kept seeing multiple of these ~50ms lulls adding
up to a huge one, because the source of the lag kept triggering at every
connection close.

pgbench was already cleaning up all of its connections at the end, after
all the transactions were finished.  It looks safe to me to just rely on
that for calling PQfinish in the normal case.  And calls to client_done
already label themselves ok or abort, the code just didn't do anything
with that state before.  I tried adding some more complicated state
tracking, but that adds complexity while doing the exact same thing as
the simple implementation I did.

The only part of your code change I reverted was altering the latency
log transaction timestamps to read like "1373821907.65702" instead of
"1373821907 65702".  Both formats were considered when I added that
feature, and I completely understand why you'd like to change it.  One
problem is that doing so introduces a new class of float parsing and
rounding issues to consumers of that data.  I'd rather not revisit that
without a better reason to break the output format.  Parsing tools like
my pgbench-tools already struggle trying to support multiple versions of
pgbench, and I don't think there's enough benefit to the float format to
bother breaking them today.

--
Greg Smith   2ndQuadrant US    greg@2ndQuadrant.com   Baltimore, MD
PostgreSQL Training, Services, and 24x7 Support www.2ndQuadrant.com
Вложения
Hello Greg,

> But we don't have to argue about that because it isn't.  The attached new
> patch seems to fix the latency spikes at the end, with -2 lines of new code!

Hmmm... that looks like not too much complexity:-)

> With that resolved I did a final pass across the rate limit code too,
> attached as a v14 and ready for a committer.

You attached my v13. Could you send your v14?

--
Fabien.
On 7/14/13 2:48 PM, Fabien COELHO wrote:
> You attached my v13. Could you send your v14?

Correct patch (and the little one from me again) attached this time.

--
Greg Smith   2ndQuadrant US    greg@2ndQuadrant.com   Baltimore, MD
PostgreSQL Training, Services, and 24x7 Support www.2ndQuadrant.com
Вложения
Hello Greg,

> Correct patch (and the little one from me again) attached this time.

Please find an updated v15 with only comment changes:

* The new comment about "is_throttled" was inverted wrt the meaning of the
variable, at least to my understanding.

* ISTM that the impact of the chosen 1000 should appear somewhere.

* The trans_need_throttle comment was slightly wrong: the first
transaction is also throttled, when initially entering doCustom.


About 123456 12345 vs 123456.012345: My data parser is usually "gnuplot"
or "my eyes", and in both cases the later option is better:-)


About the little patch: Parameter "ok" should be renamed to something
meaningful (say "do_finish"?). Also, it seems that when timer is exceeded
in doCustom it is called with true, but maybe you intended that it should
be called with false?? Moreover, under normal circumstances (throttling is
significantly below the maximum rate) PQfinish will be called directly by
threadRun while interrupting sleeping threads. Also, it is important to
remove the connection because it serves as a marker to know whether a
client must run or not. So basically I do not understand how it works.
Note that it does not mean that it does not work, it just means that I do
not really understand:-)

--
Fabien.
To clarify what state this is all in:  Fabien's latest
pgbench-throttle-v15.patch is the ready for a committer version.  The
last two revisions are just tweaking the comments at this point, and his
version is more correct than my last one.

My little pgbench-delay-finish-v1.patch is a brand new bug fix of sorts
that, while trivial, isn't ready for commit yet.  I'll start a separate
e-mail thread and CF entry for that later.  Fabien has jumped into
initial review comments of that already below, but the throttle feature
isn't dependent on that.  The finish delay just proves that the latency
spikes I was getting here aren't directly tied to the throttle feature.

On 7/14/13 5:42 PM, Fabien COELHO wrote:
> * ISTM that the impact of the chosen 1000 should appear somewhere.

I don't have a problem with that, but I didn't see that the little table
you included was enough to do that.  I think if someone knows how this
type of random generation works, they don't need the comment to analyze
the impact.  And if they don't know, that comment alone wasn't enough to
help them figure it out.  That's why I added some terms that might help
point the right way for someone who wanted to search for more
information instead.

The text of pgbench is not really the right place to put a lecture about
how to generate numbers with a target probability distribution function.  Normally the code comments tries to recommend
referencesfor this sort

of thing instead.  I didn't find a really good one in a quick search though.

> About 123456 12345 vs 123456.012345: My data parser is usually "gnuplot"
> or "my eyes", and in both cases the later option is better:-)

pgbench-tools uses gnuplot too.  If I were doing this again today from
scratch, I would recommend using the epoch time format compatible with
it you suggested.  I need to look into this whole topic a little more
before we get into that though.  This patch just wasn't the right place
to get into that change.

> About the little patch: Parameter "ok" should be renamed to something
> meaningful (say "do_finish"?).

It's saying if the connection finished "ok" or not.  I think exactly
what is done with that information is an implementation detail that
doesn't need to be exposed to the function interface.  We might change
how this is tied to PQfinish later.

> Also, it seems that when timer is
> exceeded in doCustom it is called with true, but maybe you intended that
> it should be called with false??

The way timeouts are handled right now is a known messy thing.  Exactly
what you should do with a client that has hit one isn't obvious.  Try
again?  Close the connection and abort?  The code has a way it handles
that now, and I didn't want to change it any.

> it is important to remove the connection because it serves as a marker
> to know whether a client must run or not.

This little hack moved around how clients finished enough to get rid of
the weird issue with your patch I was bothered by.  You may be right
that the change isn't really correct because of how the connection is
compared to null as a way to see if it's active.  I initially added a
more complicated "finished" state to the whole mess that tracked this
more carefully.  I may need to return to that idea now.

--
Greg Smith   2ndQuadrant US    greg@2ndQuadrant.com   Baltimore, MD
PostgreSQL Training, Services, and 24x7 Support www.2ndQuadrant.com
>> * ISTM that the impact of the chosen 1000 should appear somewhere.
>
> I don't have a problem with that, but I didn't see that the little table you
> included was enough to do that.  I think if someone knows how this type of
> random generation works, they don't need the comment to analyze the impact.
> And if they don't know, that comment alone wasn't enough to help them figure
> it out.  That's why I added some terms that might help point the right way
> for someone who wanted to search for more information instead.

Sure. I agree that comments are not the right place for a lecture about
Poisson stochastic processes. Only the "1000" parameter as an impact on
the maximum delay that can be incurred with respect do the target average
delay, and I think that this information is relevant for a comment.

> to generate numbers with a target probability distribution function.
> Normally the code comments tries to recommend references for this sort
> of thing instead.  I didn't find a really good one in a quick search
> though.

Yep. Maybe "http://en.wikipedia.org/wiki/Exponential_distribution".

--
Fabien.
> To clarify what state this is all in: Fabien's latest
> pgbench-throttle-v15.patch is the ready for a committer version.  The
> last two revisions are just tweaking the comments at this point, and
> his version is more correct than my last one.

Got it. I will take care of this.
--
Tatsuo Ishii
SRA OSS, Inc. Japan
English: http://www.sraoss.co.jp/index_en.php
Japanese: http://www.sraoss.co.jp
>> To clarify what state this is all in: Fabien's latest
>> pgbench-throttle-v15.patch is the ready for a committer version.  The
>> last two revisions are just tweaking the comments at this point, and
>> his version is more correct than my last one.
>
> Got it. I will take care of this.

Please find attached an updated version which solves conflicts introduced
by the "progress" patch.

--
Fabien.
>>> To clarify what state this is all in: Fabien's latest
>>> pgbench-throttle-v15.patch is the ready for a committer version.  The
>>> last two revisions are just tweaking the comments at this point, and
>>> his version is more correct than my last one.
>>
>> Got it. I will take care of this.
>
> Please find attached an updated version which solves conflicts
> introduced by the "progress" patch.

Thanks, but I already solved the conflict and fixed some minor
indentation issues. Now I have question regarding the function.

./pgbench -p 5433 -S -T 10 -R 10000 test
starting vacuum...end.
transaction type: SELECT only
scaling factor: 1
query mode: simple
number of clients: 1
number of threads: 1
duration: 10 s
number of transactions actually processed: 71339
average rate limit lag: 862.534 ms (max 2960.913 ms)
tps = 7133.745911 (including connections establishing)
tps = 7135.130810 (excluding connections establishing)

What does "average rate limit lag" mean? From the manual:

-R rate
--rate rate
   Execute transactions targeting the specified rate instead of   running as fast as possible (the default). The rate
isgiven in   transactions per second. If the targeted rate is above the maximum   possible rate these transactions can
executeat, the rate limit   won't have any impact on results. The rate is targeted by starting   transactions along a
Poisson-distributedevent time line. When a   rate limit is active, the average and maximum transaction lag time   (the
delaybetween the scheduled and actual transaction start   times) are reported in ms. High values indicate that the
database  could not handle the scheduled load at some time.


So in my understanding the number shows the delay time before *each*
transaction starts. If my understanding is correct, why

71339 (total transactions) * 862.534 ms = 61532 sec

could exceed 10 seconds, which is the total run time?

Also I noticed small bug.

./pgbench -R 0 test
invalid rate limit: 0

Shouldn't this be treated as if -R is not specified? Actually in the program:

/** When threads are throttled to a given rate limit, this is the target delay* to reach that rate in usec.  0 is the
defaultand means no throttling.*/

int64        throttle_delay = 0;

So it seems treating "-R 0" means "no throttling" makes more sense to me.
--
Tatsuo Ishii
SRA OSS, Inc. Japan
English: http://www.sraoss.co.jp/index_en.php
Japanese: http://www.sraoss.co.jp
Hello Tatsuo,

> Now I have question regarding the function.
>
> ./pgbench -p 5433 -S -T 10 -R 10000 test
> tps = 7133.745911 (including connections establishing)
>
> What does "average rate limit lag" mean? From the manual:
> [...]
> So in my understanding the number shows the delay time before *each*
> transaction starts.

... with respect to the schedule time assigned by the rate-limiting
stochastic process. This is to detect that rate limiting does not work
properly.

> If my understanding is correct, why 71339 (total transactions) * 862.534
> ms = 61532 sec could exceed 10 seconds, which is the total run time?

It is possible, because each transaction is far behind schedule, and you
cumulate the lateness.

Say you have transactions schedules every 0.1 second, but they take 2
second to complete:
 1. scheduled at 0.0, start at 0.0 2. scheduled at 0.1, start at 2.0, 1.9 second lag 3. scheduled at 0.2, start at 4.0,
3.8second lag, cumulative lag 5.7 s 4. scheduled at 0.3, start at 6.0, 5.7 second lag, cumulative lag 11.4 s 5.
scheduledat 0.4, start at 8.0, 7.6 second lag, cumulative lag 19.0 s 6. scheduled at 0.5, never starts


If we stop at 10.0 seconds, 5 transaction have been processed, the average
lag is about 3.8 seconds, the cumulative lag is 19.0 seconds. The lag of a
given transaction can cover lag from previous ones.

Basically, if the lag is anything but small, it means that the database
cannot handle the load and that something is amiss. In your example you
required 10000 tps, but the database can only handle 7000 tps.

Note that the database could catchup at some point, say it usually can
handle more that 10000 tps, but while the database dump is running it
falls far behing schedule, and then one the dump is done it goes back to
nominal and "late" transactions are finally processed. The max lag would
show that something was amiss during the bench, even if the average lag
is quite low.

> Also I noticed small bug.
>
> ./pgbench -R 0 test
> invalid rate limit: 0
>
> Shouldn't this be treated as if -R is not specified? Actually in the program:
>
> /*
> * When threads are throttled to a given rate limit, this is the target delay
> * to reach that rate in usec.  0 is the default and means no throttling.
> */
> int64        throttle_delay = 0;
>
> So it seems treating "-R 0" means "no throttling" makes more sense to me.

Note that the rate is expressed in tps which make sense to users, but the
internal variable is in usec which is more useful for scheduling, and is
the inverse of the other.

So -R 0 would mean zero tps, that is an infinite delay, but a 0 delay
would require an infinite tps. As requiring 0 tps does not make sense, I
decided to disable that. If you really fill that "-R 0" should mean
disable the feature, I'm fine with that, but this is not exactly logical
wrt tps.

--
Fabien.
> Hello Tatsuo,
>
>> Now I have question regarding the function.
>>
>> ./pgbench -p 5433 -S -T 10 -R 10000 test
>> tps = 7133.745911 (including connections establishing)
>>
>> What does "average rate limit lag" mean? From the manual:
>> [...]
>> So in my understanding the number shows the delay time before *each*
>> transaction starts.
>
> ... with respect to the schedule time assigned by the rate-limiting
> stochastic process. This is to detect that rate limiting does not work
> properly.
>
>> If my understanding is correct, why 71339 (total transactions) *
>> 862.534 ms = 61532 sec could exceed 10 seconds, which is the total run
>> time?
>
> It is possible, because each transaction is far behind schedule, and
> you cumulate the lateness.
>
> Say you have transactions schedules every 0.1 second, but they take 2
> second to complete:
>
>  1. scheduled at 0.0, start at 0.0
>  2. scheduled at 0.1, start at 2.0, 1.9 second lag
>  3. scheduled at 0.2, start at 4.0, 3.8 second lag, cumulative lag 5.7
>  s
>  4. scheduled at 0.3, start at 6.0, 5.7 second lag, cumulative lag 11.4
>  s
>  5. scheduled at 0.4, start at 8.0, 7.6 second lag, cumulative lag 19.0
>  s
>  6. scheduled at 0.5, never starts
>
> If we stop at 10.0 seconds, 5 transaction have been processed, the
> average lag is about 3.8 seconds, the cumulative lag is 19.0
> seconds. The lag of a given transaction can cover lag from previous
> ones.
>
> Basically, if the lag is anything but small, it means that the
> database cannot handle the load and that something is amiss. In your
> example you required 10000 tps, but the database can only handle 7000
> tps.
>
> Note that the database could catchup at some point, say it usually can
> handle more that 10000 tps, but while the database dump is running it
> falls far behing schedule, and then one the dump is done it goes back
> to nominal and "late" transactions are finally processed. The max lag
> would show that something was amiss during the bench, even if the
> average lag
> is quite low.

Thanks for detailed explainations. I now understand the function.

>> Also I noticed small bug.
>>
>> ./pgbench -R 0 test
>> invalid rate limit: 0
>>
>> Shouldn't this be treated as if -R is not specified? Actually in the
>> program:
>>
>> /*
>> * When threads are throttled to a given rate limit, this is the target
>> * delay
>> * to reach that rate in usec.  0 is the default and means no throttling.
>> */
>> int64        throttle_delay = 0;
>>
>> So it seems treating "-R 0" means "no throttling" makes more sense to
>> me.
>
> Note that the rate is expressed in tps which make sense to users, but
> the internal variable is in usec which is more useful for scheduling,
> and is the inverse of the other.
>
> So -R 0 would mean zero tps, that is an infinite delay, but a 0 delay
> would require an infinite tps. As requiring 0 tps does not make sense,
> I decided to disable that. If you really fill that "-R 0" should mean
> disable the feature, I'm fine with that, but this is not exactly
> logical wrt tps.

Ok, your statement seems to be fair. Unless someone complains the
point, I leave it as it is.

I'm going to test your patches on Mac OS X and Windows.
--
Tatsuo Ishii
SRA OSS, Inc. Japan
English: http://www.sraoss.co.jp/index_en.php
Japanese: http://www.sraoss.co.jp
On 7/17/13 2:31 AM, Tatsuo Ishii wrote:
> ./pgbench -p 5433 -S -T 10 -R 10000 test
> average rate limit lag: 862.534 ms (max 2960.913 ms)
> tps = 7133.745911 (including connections establishing)
> tps = 7135.130810 (excluding connections establishing)
>
> What does "average rate limit lag" mean?

The whole concept of "lag" with the rate limit is complicated.  At one
point I thought this should be a debugging detail, rather than exposing
the user to it.

The problem is that if you do that, you might not notice that your limit
failed to work as expected.  Maybe it's good enough in a case like this
that the user will see they tried to limit at 10000, but they only got
7135, so something must not have worked as expected.

Tatsuo:  most of my tests were on Mac OS and Linux, I actually tested
the Mac version a lot more than any other here.  I didn't do any testing
on Windows.

--
Greg Smith   2ndQuadrant US    greg@2ndQuadrant.com   Baltimore, MD
PostgreSQL Training, Services, and 24x7 Support www.2ndQuadrant.com
> Thanks for detailed explainations. I now understand the function.

Good. I've looked into the documentation. I'm not sure how I could improve
it significantly without adding a lot of text which would also add a lot
of confusion to the casual reader.

> I'm going to test your patches on Mac OS X and Windows.

Great! I cannot do that.

--
Fabien.
> The whole concept of "lag" with the rate limit is complicated.

I must agree on that point, their interpretation is subtle.

> At one point I thought this should be a debugging detail, rather than
> exposing the user to it. The problem is that if you do that, you might
> not notice that your limit failed to work as expected.  Maybe it's good
> enough in a case like this that the user will see they tried to limit at
> 10000, but they only got 7135, so something must not have worked as
> expected.

Yep. As I suggested in answering to Tatsuo, the process can catch up
later, so you could have 10000 in the end even with something amiss.

--
Fabien.
>> The whole concept of "lag" with the rate limit is complicated.
>
> I must agree on that point, their interpretation is subtle.
>
>> At one point I thought this should be a debugging detail, rather than
>> exposing the user to it. The problem is that if you do that, you might
>> not notice that your limit failed to work as expected.  Maybe it's
>> good enough in a case like this that the user will see they tried to
>> limit at 10000, but they only got 7135, so something must not have
>> worked as expected.
>
> Yep. As I suggested in answering to Tatsuo, the process can catch up
> later, so you could have 10000 in the end even with something amiss.

Fabian,

I did another case. First, I run pgbench without -R.

$ ./pgbench -p 5433 -S -n -c 10 -T 300 test
./pgbench -p 5433 -S -n -c 10 -T 300 test
transaction type: SELECT only
scaling factor: 1
query mode: simple
number of clients: 10
number of threads: 1
duration: 300 s
number of transactions actually processed: 2945652
tps = 9818.741060 (including connections establishing)
tps = 9819.389689 (excluding connections establishing)

So I thought I could squeeze 10000 TPS from my box.
Then I tried with -R 5000 tps.

$ ./pgbench -p 5433 -S -n -c 10 -T 300 -R 5000 test
./pgbench -p 5433 -S -n -c 10 -T 300 -R 5000 test
transaction type: SELECT only
scaling factor: 1
query mode: simple
number of clients: 10
number of threads: 1
duration: 300 s
number of transactions actually processed: 1510640
average rate limit lag: 0.304 ms (max 19.101 ms)
tps = 5035.409397 (including connections establishing)
tps = 5035.731093 (excluding connections establishing)

As you can see, I got about 5000 tps as expected. But I'm confused by
the lag:

0.304 ms * 1510640 = 459.2 seconds, which is longer than 300 seconds
(specified by -T). Am I missing something?
--
Tatsuo Ishii
SRA OSS, Inc. Japan
English: http://www.sraoss.co.jp/index_en.php
Japanese: http://www.sraoss.co.jp
>>> The whole concept of "lag" with the rate limit is complicated.
>>
>> I must agree on that point, their interpretation is subtle.
>>
>>> At one point I thought this should be a debugging detail, rather than
>>> exposing the user to it. The problem is that if you do that, you might
>>> not notice that your limit failed to work as expected.  Maybe it's
>>> good enough in a case like this that the user will see they tried to
>>> limit at 10000, but they only got 7135, so something must not have
>>> worked as expected.
>>
>> Yep. As I suggested in answering to Tatsuo, the process can catch up
>> later, so you could have 10000 in the end even with something amiss.
>
> Fabian,
>
> I did another case. First, I run pgbench without -R.
>
> $ ./pgbench -p 5433 -S -n -c 10 -T 300 test
> ./pgbench -p 5433 -S -n -c 10 -T 300 test
> transaction type: SELECT only
> scaling factor: 1
> query mode: simple
> number of clients: 10
> number of threads: 1
> duration: 300 s
> number of transactions actually processed: 2945652
> tps = 9818.741060 (including connections establishing)
> tps = 9819.389689 (excluding connections establishing)
>
> So I thought I could squeeze 10000 TPS from my box.
> Then I tried with -R 5000 tps.
>
> $ ./pgbench -p 5433 -S -n -c 10 -T 300 -R 5000 test
> ./pgbench -p 5433 -S -n -c 10 -T 300 -R 5000 test
> transaction type: SELECT only
> scaling factor: 1
> query mode: simple
> number of clients: 10
> number of threads: 1
> duration: 300 s
> number of transactions actually processed: 1510640
> average rate limit lag: 0.304 ms (max 19.101 ms)
> tps = 5035.409397 (including connections establishing)
> tps = 5035.731093 (excluding connections establishing)
>
> As you can see, I got about 5000 tps as expected. But I'm confused by
> the lag:
>
> 0.304 ms * 1510640 = 459.2 seconds, which is longer than 300 seconds
> (specified by -T). Am I missing something?

BTW, the system was Linux (kernel 3.0.77).

Now I tried on Mac OS X.

$ pgbench -S -n -c 10 -T 10  test
transaction type: SELECT only
scaling factor: 1
query mode: simple
number of clients: 10
number of threads: 1
duration: 10 s
number of transactions actually processed: 67333
tps = 6730.940132 (including connections establishing)
tps = 6751.078966 (excluding connections establishing)

$ pgbench -S -n -c 10 -T 10  -R 3000 test
transaction type: SELECT only
scaling factor: 1
query mode: simple
number of clients: 10
number of threads: 1
duration: 10 s
number of transactions actually processed: 29840
average rate limit lag: 0.089 ms (max 27.301 ms)
tps = 2983.707895 (including connections establishing)
tps = 2991.919611 (excluding connections establishing)

0.089 ms * 29840 = 2.66 seconds. Not too bad compared with 10
seconds. On Linux maybe the overhead to calculate the lag is bigger
than Mac OS X? Just my wild guess though...
--
Tatsuo Ishii
SRA OSS, Inc. Japan
English: http://www.sraoss.co.jp/index_en.php
Japanese: http://www.sraoss.co.jp
>> tps = 9818.741060 (including connections establishing)
>>
>> So I thought I could squeeze 10000 TPS from my box.
>> Then I tried with -R 5000 tps.
>>
>> number of transactions actually processed: 1510640
>> average rate limit lag: 0.304 ms (max 19.101 ms)
>> tps = 5035.409397 (including connections establishing)
>>
>> As you can see, I got about 5000 tps as expected.

Yep, it works:-)

>> But I'm confused by the lag:
>>
>> 0.304 ms * 1510640 = 459.2 seconds, which is longer than 300 seconds
>> (specified by -T). Am I missing something?

The lag is reasonnable, althought no too good. One transaction is about
1.2 ms, the lag is much smaller than that, and you are at about 50% of the
maximum load. I've got similar figures on my box for such settings. It
improves if your reduce the number of clients.

If you reduce the number of clients, or add more threads, the lag is
reduced.

> BTW, the system was Linux (kernel 3.0.77).

> tps = 6730.940132 (including connections establishing)
> $ pgbench -S -n -c 10 -T 10  -R 3000 test

> average rate limit lag: 0.089 ms (max 27.301 ms)
> tps = 2983.707895 (including connections establishing)
>
> 0.089 ms * 29840 = 2.66 seconds. Not too bad compared with 10
> seconds.

Indeed, that is better. Transactions are about 1.5 ms and you run at about
45% of the maximum load here.

> On Linux maybe the overhead to calculate the lag is bigger
> than Mac OS X? Just my wild guess though...

I would be surprised that this would be the issue is to compute the
measure, compared to network connections and the like. With -S the bench
is cpu bound. Possibly a better scheduler/thread management on OSX? Or
more available cores? Well, I do not know! At high load with clients
running on the same box as the server, and with more clients & server than
available cores, there is a lot of competition between processes, and
between clients that share a unique thread, and a log context switching
whoch will result in a measured lag.

--
Fabien.
>>> tps = 9818.741060 (including connections establishing)
>>>
>>> So I thought I could squeeze 10000 TPS from my box.
>>> Then I tried with -R 5000 tps.
>>>
>>> number of transactions actually processed: 1510640
>>> average rate limit lag: 0.304 ms (max 19.101 ms)
>>> tps = 5035.409397 (including connections establishing)
>>>
>>> As you can see, I got about 5000 tps as expected.
>
> Yep, it works:-)
>
>>> But I'm confused by the lag:
>>>
>>> 0.304 ms * 1510640 = 459.2 seconds, which is longer than 300 seconds
>>> (specified by -T). Am I missing something?
>
> The lag is reasonnable, althought no too good. One transaction is
> about 1.2 ms, the lag is much smaller than that, and you are at about
> 50% of the maximum load. I've got similar figures on my box for such
> settings. It improves if your reduce the number of clients.

No, 5000 TPS = 1/5000 = 0.2 ms per transaction, no? However pgbench
says average lag is 0.304 ms. So the lag is longer than transaction
itself.

> If you reduce the number of clients, or add more threads, the lag is
> reduced.
>
>> BTW, the system was Linux (kernel 3.0.77).
>
>> tps = 6730.940132 (including connections establishing)
>> $ pgbench -S -n -c 10 -T 10  -R 3000 test
>
>> average rate limit lag: 0.089 ms (max 27.301 ms)
>> tps = 2983.707895 (including connections establishing)
>>
>> 0.089 ms * 29840 = 2.66 seconds. Not too bad compared with 10
>> seconds.
>
> Indeed, that is better. Transactions are about 1.5 ms and you run at
> about 45% of the maximum load here.
>
>> On Linux maybe the overhead to calculate the lag is bigger
>> than Mac OS X? Just my wild guess though...
>
> I would be surprised that this would be the issue is to compute the
> measure, compared to network connections and the like. With -S the
> bench is cpu bound. Possibly a better scheduler/thread management on
> OSX? Or more available cores?

The number of cores is same.  I don't understand why number of cores
is relatedx, though. Anyway, as you can see in Mac OS X's case, TPS
itself is no better than the Linux box.

>  Well, I do not know! At high load with
> clients running on the same box as the server, and with more clients &
> server than available cores, there is a lot of competition between
> processes, and between clients that share a unique thread, and a log
> context switching whoch will result in a measured lag.

Hmm... I would like to have cleaner explanation/evidence before
committing the patch.
--
Tatsuo Ishii
SRA OSS, Inc. Japan
English: http://www.sraoss.co.jp/index_en.php
Japanese: http://www.sraoss.co.jp
Hello Tatsuo,

>> The lag is reasonnable, althought no too good. One transaction is
>> about 1.2 ms, the lag is much smaller than that, and you are at about
>> 50% of the maximum load. I've got similar figures on my box for such
>> settings. It improves if your reduce the number of clients.
>
> No, 5000 TPS = 1/5000 = 0.2 ms per transaction, no?

Hmmm... Yes, and no:-)

Transaction are handled in parallel because there are 10 clients. I look
at actual transaction times (latency) from a client perspective, not the
"apparent" time because of parallelism, and compare it to the measured
lag, which is also measured per client.

The transaction time I reported is derived from your maximum tps per
client : 10 clients / 8300 tps = 1.2 ms / trans. However, there are 10
transaction in progress in parallel.

When you're running at 50% load, the clients basically spend 1.2 ms doing
a transaction (sending queries, getting results), and 1.2 ms sleeping
because of rate limiting. The reported 0.3 ms lag is that when sleeping
1.2 ms it tends to start a little bit later, after 1.5 ms, but this
latency does not show up on the throuput figures because the next sleep
will just be a smaller to catch-up.

As you have 10 clients in one pgbench thread, the scheduling say to start
a new transaction for a client at a certain time, but the pgbench process
is late to actually handle this client query because it is doing other
things, like attending one of the other clients, or being switched off to
run a server process.

> However pgbench says average lag is 0.304 ms. So the lag is longer than
> transaction itself.

See above.

>> I would be surprised that this would be the issue is to compute the
>> measure, compared to network connections and the like. With -S the
>> bench is cpu bound. Possibly a better scheduler/thread management on
>> OSX? Or more available cores?
>
> The number of cores is same.  I don't understand why number of cores
> is relatedx, though.

In my mind, because "pgbench -S" is cpu bound, and with "-c 10" you have
to run pgbench and 10 "postgres" backends, that is 11 processes competing
for cpu time. If you have 11 cores that is mostly fine, if you have less
then there will be some delay depending on how the process scheduler does
thing in the OS to allocate cpu time. With a load of 50%, about 6 cores
should be okay to run the load transparently (client & server).

>>  Well, I do not know! At high load with clients running on the same box
>> as the server, and with more clients & server than available cores,
>> there is a lot of competition between processes, and between clients
>> that share a unique thread, and a log context switching whoch will
>> result in a measured lag.
>
> Hmm... I would like to have cleaner explanation/evidence before
> committing the patch.

The lag measures you report seems pretty consistent to me given the load
your requiring, for a cpu bound bench, with more processes to run than
available cores. At least, I'm buying my own explanation, and I hope to be
convincing.

If you want to isolate yourself from such effects, pgbench must run on a
different host than the server, with has many threads as there are cores
available, and not too many clients per thread. This is also true without
throttling, but it shows more under throttling because of the lag
(latency) measures.

--
Fabien.
Fabien,

> Hello Tatsuo,
>
>>> The lag is reasonnable, althought no too good. One transaction is
>>> about 1.2 ms, the lag is much smaller than that, and you are at about
>>> 50% of the maximum load. I've got similar figures on my box for such
>>> settings. It improves if your reduce the number of clients.
>>
>> No, 5000 TPS = 1/5000 = 0.2 ms per transaction, no?
>
> Hmmm... Yes, and no:-)
>
> Transaction are handled in parallel because there are 10 clients. I
> look at actual transaction times (latency) from a client perspective,
> not the "apparent" time because of parallelism, and compare it to the
> measured lag, which is also measured per client.
>
> The transaction time I reported is derived from your maximum tps per
> client : 10 clients / 8300 tps = 1.2 ms / trans. However, there are 10
> transaction in progress in parallel.
>
> When you're running at 50% load, the clients basically spend 1.2 ms
> doing a transaction (sending queries, getting results), and 1.2 ms
> sleeping because of rate limiting. The reported 0.3 ms lag is that
> when sleeping 1.2 ms it tends to start a little bit later, after 1.5
> ms, but this latency does not show up on the throuput figures because
> the next sleep will just be a smaller to catch-up.
>
> As you have 10 clients in one pgbench thread, the scheduling say to
> start a new transaction for a client at a certain time, but the
> pgbench process is late to actually handle this client query because
> it is doing other things, like attending one of the other clients, or
> being switched off to run a server process.
>
>> However pgbench says average lag is 0.304 ms. So the lag is longer
>> than transaction itself.
>
> See above.
>
>>> I would be surprised that this would be the issue is to compute the
>>> measure, compared to network connections and the like. With -S the
>>> bench is cpu bound. Possibly a better scheduler/thread management on
>>> OSX? Or more available cores?
>>
>> The number of cores is same.  I don't understand why number of cores
>> is relatedx, though.
>
> In my mind, because "pgbench -S" is cpu bound, and with "-c 10" you
> have to run pgbench and 10 "postgres" backends, that is 11 processes
> competing for cpu time. If you have 11 cores that is mostly fine, if
> you have less then there will be some delay depending on how the
> process scheduler does thing in the OS to allocate cpu time. With a
> load of 50%, about 6 cores should be okay to run the load
> transparently (client & server).
>
>>>  Well, I do not know! At high load with clients running on the same box
>>>  as the server, and with more clients & server than available cores,
>>>  there is a lot of competition between processes, and between clients
>>>  that share a unique thread, and a log context switching whoch will
>>>  result in a measured lag.
>>
>> Hmm... I would like to have cleaner explanation/evidence before
>> committing the patch.
>
> The lag measures you report seems pretty consistent to me given the
> load your requiring, for a cpu bound bench, with more processes to run
> than available cores. At least, I'm buying my own explanation, and I
> hope to be convincing.
>
> If you want to isolate yourself from such effects, pgbench must run on
> a different host than the server, with has many threads as there are
> cores available, and not too many clients per thread. This is also
> true without throttling, but it shows more under throttling because of
> the lag (latency) measures.

I think I'm starting to understand what's going on.  Suppose there are
n transactions be issued by pgbench and it decides each schedule d(0),
d(1)... d(n). Actually the schedule d(i) (which is stored in
st->until) is decided by the following code:
    int64 wait = (int64)        throttle_delay * -log(getrand(thread, 1, 1000)/1000.0);
    thread->throttle_trigger += wait;
    st->until = thread->throttle_trigger;

st->until represents the time for a transaction to be finished by the
time. Now the transaction i finishes at t(i).  So the lag l(i) = t(i)
-d(i) if the transaction is behind.  Then next transaction i+1
begins. The lag l(i+1) = t(i+1) - d(i+1) and so on. At the end of
pgbench, it shows the average lag as sum(l(0)...l(n))/n.

Now suppose we have 3 transactions and each has following values:

d(0) = 10
d(1) = 20
d(2) = 30

t(0) = 100
t(1) = 110
t(2) = 120

That says pgbench expects the duration 10 for each
transaction. Actually, the first transaction runs slowly for some
reason and the lag = 100 - 10 = 90. However, tx(1) and tx(2) are
finished on schedule because they spend only 10 (110-10 = 10, 120-110
= 10). So the expected average lag would be 90/3 = 30.

However actually pgbench calculates like this:

average lag = (t(0)-d(0) + t(1)-d(1) + t(2)-d(2))/3           = (100-10 + 110-20 + 120-30)/3           = (90 + 90 +
90)/3          = 90


Looks like too much lag calculated. The difference between the lag
which pgbench calculates and the expected one will be growing if a lag
happens eariler. I guess why my Linux box shows bigger lag than Mac OS
X is, the first transaction or early transactions run slowly than the
ones run later.

Of course this conclusion depends on the definition of the "average
rate limit lag" of pgbench. So you might have other opinion. However
the way how pgbench calculates the average lag is not expected at
least for me.
--
Tatsuo Ishii
SRA OSS, Inc. Japan
English: http://www.sraoss.co.jp/index_en.php
Japanese: http://www.sraoss.co.jp
On 7/17/13 9:16 PM, Tatsuo Ishii wrote:
> Now suppose we have 3 transactions and each has following values:
>
> d(0) = 10
> d(1) = 20
> d(2) = 30
>
> t(0) = 100
> t(1) = 110
> t(2) = 120
>
> That says pgbench expects the duration 10 for each
> transaction. Actually, the first transaction runs slowly for some
> reason and the lag = 100 - 10 = 90. However, tx(1) and tx(2) are
> finished on schedule because they spend only 10 (110-10 = 10, 120-110
> = 10). So the expected average lag would be 90/3 = 30.

The clients are not serialized here in any significant way, even when
they shared a single process/thread.  I did many rounds of tracing
through this code with timestamps on each line, and the sequence of
events here will look like this:

client 0:  send "SELECT..." to server.  yield to next client.
client 1:  send "SELECT..." to server.  yield to next client.
client 2:  send "SELECT..." to server.  yield to next client.
select():  wait for the first response from any client.
client 0:  receive response.  complete transaction, compute lag.
client 1:  receive response.  complete transaction, compute lag.
client 2:  receive response.  complete transaction, compute lag.

There is nothing here that is queuing the clients one after the other.
If (0) takes 100ms before its reply comes back, (1) and (2) can receive
their reply back and continue forward at any time.  They are not waiting
for (0); it has yielded control while waiting for a response.  All three
times are independent once you reach the select() point where all are
active.

In this situation, if the server gets stuck doing something such that it
takes 100ms before any client receives a response, it is correct to
penalize every client for that latency.  All three clients could have
received the information earlier if the server had any to send them.  If
they did not, they all were suffering from some sort of lag.

I'm not even sure why you spaced the start times out at intervals of 10.  If I were constructing an example like this,
I'dhave them start at

times of 0, 1, 2--as fast as the CPU can fire off statements
basically--and then start waiting from that point.  If client 1 takes 10
units of time to send its query out before client 2 runs, and the rate
goal requires 10 units of time, the rate you're asking for is impossible.

For sorting out what's going on with your two systems, I would recommend
turning on debugging output with "-d" and looking at the new
per-transaction latency numbers that the feature reports.  If your
theory that the lag is going up as the test proceeds is true, that
should show up in the individual latency numbers too.

Based on what I saw during weeks of testing here, I would be more
suspicious that there's a system level difference between your two
servers than to blame the latency calculation.  I saw a *lot* of weird
system issues myself when I started looking that carefully at sustained
throughput.  The latency reports from the perspective of Fabien's code
were always reasonable though.  When something delays every client, it
counts that against every active client's lag, and that's the right
thing to do.

--
Greg Smith   2ndQuadrant US    greg@2ndQuadrant.com   Baltimore, MD
PostgreSQL Training, Services, and 24x7 Support www.2ndQuadrant.com
> On 7/17/13 9:16 PM, Tatsuo Ishii wrote:
>> Now suppose we have 3 transactions and each has following values:
>>
>> d(0) = 10
>> d(1) = 20
>> d(2) = 30
>>
>> t(0) = 100
>> t(1) = 110
>> t(2) = 120
>>
>> That says pgbench expects the duration 10 for each
>> transaction. Actually, the first transaction runs slowly for some
>> reason and the lag = 100 - 10 = 90. However, tx(1) and tx(2) are
>> finished on schedule because they spend only 10 (110-10 = 10, 120-110
>> = 10). So the expected average lag would be 90/3 = 30.
>
> The clients are not serialized here in any significant way, even when
> they shared a single process/thread.  I did many rounds of tracing
> through this code with timestamps on each line, and the sequence of
> events here will look like this:

My example is for 1 client case. So concurrent clients are not the
issue here.
--
Tatsuo Ishii
SRA OSS, Inc. Japan
English: http://www.sraoss.co.jp/index_en.php
Japanese: http://www.sraoss.co.jp
On 7/17/13 11:34 PM, Tatsuo Ishii wrote:
> My example is for 1 client case. So concurrent clients are not the
> issue here.

Sorry about that, with your clarification I see what you were trying to
explain now.  The code initializes the target time like this:

thread->throttle_trigger = INSTR_TIME_GET_MICROSEC(start);

And then each time a transaction fires, it advances the reference time
forward based on the expected rate:

thread->throttle_trigger += wait;

It does *not* reset thread->throttle_trigger based on when the previous
transaction ended / when the next transaction started.  If the goal is
10us transaction times, it beats a steady drum saying the transactions
should come at 10us, 20us, 30us (on average--there's some randomness in
the goals).  It does not pay any attention to when the previous
transactions finished.

That means that if an early transaction takes an extra 1000us, every
transaction after that will also show as 1000us late--even if all of
them take 10us.  You expect that those later transactions will show 0
lag, since they took the right duration.  For that to happen,
thread->throttle_trigger would need to be re-initialized with the
current time at the end of each completed transaction.

The lag computation was not the interesting part of this feature to me.  As I said before, I considered it more of a
debugginglevel thing than

a number people would analyze as much as you did.  I understand why you
don't like it though.  If the reference time was moved forward to match
the transaction end each time, I think that would give the lag
definition you're looking for.  That's fine to me too, if Fabien doesn't
have a good reason to reject the idea.  We would need to make sure that
doesn't break some part of the design too.

--
Greg Smith   2ndQuadrant US    greg@2ndQuadrant.com   Baltimore, MD
PostgreSQL Training, Services, and 24x7 Support www.2ndQuadrant.com
> Sorry about that, with your clarification I see what you were trying
> to explain now.  The code initializes the target time like this:
>
> thread->throttle_trigger = INSTR_TIME_GET_MICROSEC(start);
>
> And then each time a transaction fires, it advances the reference time
> forward based on the expected rate:
>
> thread->throttle_trigger += wait;
>
> It does *not* reset thread->throttle_trigger based on when the
> previous transaction ended / when the next transaction started.  If
> the goal is 10us transaction times, it beats a steady drum saying the
> transactions should come at 10us, 20us, 30us (on average--there's some
> randomness in the goals).  It does not pay any attention to when the
> previous transactions finished.
>
> That means that if an early transaction takes an extra 1000us, every
> transaction after that will also show as 1000us late--even if all of
> them take 10us.  You expect that those later transactions will show 0
> lag, since they took the right duration.  For that to happen,
> thread->throttle_trigger would need to be re-initialized with the
> current time at the end of each completed transaction.

Yes, that's exactly what I understand from the code.

> The lag computation was not the interesting part of this feature to
> me.  As I said before, I considered it more of a debugging level thing
> than a number people would analyze as much as you did.  I understand
> why you don't like it though.  If the reference time was moved forward
> to match the transaction end each time, I think that would give the
> lag definition you're looking for.  That's fine to me too, if Fabien
> doesn't have a good reason to reject the idea.  We would need to make
> sure that doesn't break some part of the design too.

I would like to hear from Fabien about the issue too.
--
Tatsuo Ishii
SRA OSS, Inc. Japan
English: http://www.sraoss.co.jp/index_en.php
Japanese: http://www.sraoss.co.jp
>> Sorry about that, with your clarification I see what you were trying
>> to explain now.  The code initializes the target time like this:
>>
>> thread->throttle_trigger = INSTR_TIME_GET_MICROSEC(start);
>>
>> And then each time a transaction fires, it advances the reference time
>> forward based on the expected rate:
>>
>> thread->throttle_trigger += wait;
>>
>> It does *not* reset thread->throttle_trigger based on when the
>> previous transaction ended / when the next transaction started.  If
>> the goal is 10us transaction times, it beats a steady drum saying the
>> transactions should come at 10us, 20us, 30us (on average--there's some
>> randomness in the goals).  It does not pay any attention to when the
>> previous transactions finished.
>>
>> That means that if an early transaction takes an extra 1000us, every
>> transaction after that will also show as 1000us late--even if all of
>> them take 10us.  You expect that those later transactions will show 0
>> lag, since they took the right duration.  For that to happen,
>> thread->throttle_trigger would need to be re-initialized with the
>> current time at the end of each completed transaction.
>
> Yes, that's exactly what I understand from the code.
>
>> The lag computation was not the interesting part of this feature to
>> me.  As I said before, I considered it more of a debugging level thing
>> than a number people would analyze as much as you did.  I understand
>> why you don't like it though.  If the reference time was moved forward
>> to match the transaction end each time, I think that would give the
>> lag definition you're looking for.  That's fine to me too, if Fabien
>> doesn't have a good reason to reject the idea.  We would need to make
>> sure that doesn't break some part of the design too.
>
> I would like to hear from Fabien about the issue too.

For your information, included is the patch against git master head to
implement the lag in a way what I proposed. With the patch, I get more
consistent number on Linux (and Mac OS X).
--
Tatsuo Ishii
SRA OSS, Inc. Japan
English: http://www.sraoss.co.jp/index_en.php
Japanese: http://www.sraoss.co.jp
diff --git a/contrib/pgbench/pgbench.c b/contrib/pgbench/pgbench.c
index 2ad8f0b..57e62dc 100644
--- a/contrib/pgbench/pgbench.c
+++ b/contrib/pgbench/pgbench.c
@@ -137,6 +137,12 @@ int            unlogged_tables = 0;double        sample_rate = 0.0;/*
+ * When threads are throttled to a given rate limit, this is the target delay
+ * to reach that rate in usec.  0 is the default and means no throttling.
+ */
+int64        throttle_delay = 0;
+
+/* * tablespace selection */char       *tablespace = NULL;
@@ -202,11 +208,15 @@ typedef struct    int            listen;            /* 0 indicates that an async query has been
                             * sent */    int            sleeping;        /* 1 indicates that the client is napping */

+    bool        throttling;     /* whether nap is for throttling */    int64        until;            /* napping until
(usec)*/

+    int64        wait;            /* randomly generated delay (usec) */    Variable   *variables;        /* array of
variabledefinitions */    int            nvariables;    instr_time    txn_begin;        /* used for measuring
transactionlatencies */

+    instr_time  txn_begin_throttle;        /* tx start time used when transaction throttling enabled */    instr_time
 stmt_begin;        /* used for measuring statement latencies */

+    bool        is_throttled;    /* whether transaction throttling is done */    int            use_file;        /*
indexin sql_files for this client */    bool        prepared[MAX_FILES];} CState;

@@ -224,6 +234,9 @@ typedef struct    instr_time *exec_elapsed;    /* time spent executing cmds (per Command) */    int
         *exec_count;        /* number of cmd executions (per Command) */    unsigned short random_state[3];        /*
separaterandomness for each thread */

+    int64       throttle_trigger;     /* previous/next throttling (us) */
+    int64       throttle_lag;         /* total transaction lag behind throttling */
+    int64       throttle_lag_max;     /* max transaction lag */} TState;#define INVALID_THREAD        ((pthread_t) 0)
@@ -232,6 +245,8 @@ typedef struct{    instr_time    conn_time;    int            xacts;
+    int64       throttle_lag;
+    int64       throttle_lag_max;} TResult;/*
@@ -356,6 +371,7 @@ usage(void)           "  -N, --skip-some-updates  skip updates of pgbench_tellers and
pgbench_branches\n"          "  -P, --progress=NUM       show thread progress report every NUM seconds\n"           "
-r,--report-latencies   report average latency per command\n"

+           "  -R, --rate=SPEC          target rate in transactions per second\n"           "  -s, --scale=NUM
reportthis scale factor in output\n"           "  -S, --select-only        perform SELECT-only transactions\n"
"  -t, --transactions       number of transactions each client runs "

@@ -898,19 +914,80 @@ doCustom(TState *thread, CState *st, instr_time *conn_time, FILE *logfile, AggVa{    PGresult
*res;   Command   **commands;

+    bool        trans_needs_throttle = false;top:    commands = sql_files[st->use_file];
+    /*
+     * Handle throttling once per transaction by sleeping.  It is simpler
+     * to do this here rather than at the end, because so much complicated
+     * logic happens below when statements finish.
+     */
+    if (throttle_delay && ! st->is_throttled)
+    {
+        /*
+         * Use inverse transform sampling to randomly generate a delay, such
+         * that the series of delays will approximate a Poisson distribution
+         * centered on the throttle_delay time.
+         *
+         * 1000 implies a 6.9 (-log(1/1000)) to 0.0 (log 1.0) delay multiplier.
+         *
+         * If transactions are too slow or a given wait is shorter than
+         * a transaction, the next transaction will start right away.
+         */
+        int64 wait = (int64)
+            throttle_delay * -log(getrand(thread, 1, 1000)/1000.0);
+
+        thread->throttle_trigger += wait;
+
+        st->until = thread->throttle_trigger;
+        st->wait = wait;
+        st->sleeping = 1;
+        st->throttling = true;
+        st->is_throttled = true;
+        if (debug)
+            fprintf(stderr, "client %d throttling "INT64_FORMAT" us\n",
+                    st->id, wait);
+
+    }
+    if (st->sleeping)    {                            /* are we sleeping? */        instr_time    now;
+        int64 now_us;
+        int64 start_us;        INSTR_TIME_SET_CURRENT(now);
-        if (st->until <= INSTR_TIME_GET_MICROSEC(now))
+        now_us = INSTR_TIME_GET_MICROSEC(now);
+        if (st->until <= now_us)
+        {            st->sleeping = 0;    /* Done sleeping, go ahead with next command */
+            start_us = INSTR_TIME_GET_MICROSEC(st->txn_begin_throttle);
+            if (start_us <= 0)
+                start_us = INSTR_TIME_GET_MICROSEC(thread->start_time);
+
+            if (st->throttling)
+            {
+                /* Measure lag of throttled transaction relative to target */
+                int64 lag = now_us - start_us - st->wait;
+
+                if (debug)
+                    fprintf(stderr, "stmt_begin: "INT64_FORMAT" now_us: "INT64_FORMAT" wait:"INT64_FORMAT"
until:"INT64_FORMAT"lag:"INT64_FORMAT"\n", start_us, now_us, st->wait, st->until, lag);

+
+                thread->throttle_lag += lag;
+                if (lag > thread->throttle_lag_max)
+                    thread->throttle_lag_max = lag;
+                st->throttling = false;
+            }
+        }        else
+        {
+            if (debug)
+                fprintf(stderr, "still sleeping\n");
+            return true;        /* Still sleeping, nothing to do here */
+        }    }    if (st->listen)
@@ -1095,6 +1172,15 @@ top:            st->state = 0;            st->use_file = (int) getrand(thread, 0, num_files -
1);           commands = sql_files[st->use_file];

+            st->is_throttled = false;
+            /*
+             * No transaction is underway anymore, which means there is nothing
+             * to listen to right now.  When throttling rate limits are active,
+             * a sleep will happen next, as the next transaction starts.  And
+             * then in any case the next SQL command will set listen back to 1.
+             */
+            st->listen = 0;
+            trans_needs_throttle = (throttle_delay>0);        }    }
@@ -1113,6 +1199,16 @@ top:        INSTR_TIME_ACCUM_DIFF(*conn_time, end, start);    }
+    /*
+     * This ensures that a throttling delay is inserted before proceeding
+     * with sql commands, after the first transaction. The first transaction
+     * throttling is performed when first entering doCustom.
+     */
+    if (trans_needs_throttle) {
+        trans_needs_throttle = false;
+        goto top;
+    }
+    /* Record transaction start time if logging is enabled */    if (logfile && st->state == 0)
INSTR_TIME_SET_CURRENT(st->txn_begin);
@@ -1121,6 +1217,9 @@ top:    if (is_latencies)        INSTR_TIME_SET_CURRENT(st->stmt_begin);
+    if (throttle_delay)
+        INSTR_TIME_SET_CURRENT(st->txn_begin_throttle);
+    if (commands[st->state]->type == SQL_COMMAND)    {        const Command *command = commands[st->state];
@@ -2017,7 +2116,8 @@ process_builtin(char *tb)static voidprintResults(int ttype, int normal_xacts, int nclients,
     TState *threads, int nthreads,

-             instr_time total_time, instr_time conn_total_time)
+             instr_time total_time, instr_time conn_total_time,
+             int64 throttle_lag, int64 throttle_lag_max){    double        time_include,                tps_include,
@@ -2055,6 +2155,19 @@ printResults(int ttype, int normal_xacts, int nclients,        printf("number of transactions
actuallyprocessed: %d\n",               normal_xacts);    }

+
+    if (throttle_delay)
+    {
+        /*
+         * Report average transaction lag under rate limit throttling.  This
+         * is the delay between scheduled and actual start times for the
+         * transaction.  The measured lag may be caused by thread/client load,
+         * the database load, or the Poisson throttling process.
+         */
+        printf("average rate limit lag: %.3f ms (max %.3f ms)\n",
+               0.001 * throttle_lag / normal_xacts, 0.001 * throttle_lag_max);
+    }
+    printf("tps = %f (including connections establishing)\n", tps_include);    printf("tps = %f (excluding connections
establishing)\n",tps_exclude);

@@ -2140,6 +2253,7 @@ main(int argc, char **argv)        {"unlogged-tables", no_argument, &unlogged_tables, 1},
{"sampling-rate",required_argument, NULL, 4},        {"aggregate-interval", required_argument, NULL, 5},

+        {"rate", required_argument, NULL, 'R'},        {NULL, 0, NULL, 0}    };
@@ -2162,6 +2276,8 @@ main(int argc, char **argv)    instr_time    total_time;    instr_time    conn_total_time;    int
          total_xacts;

+    int64       throttle_lag = 0;
+    int64       throttle_lag_max = 0;    int            i;
@@ -2206,7 +2322,7 @@ main(int argc, char **argv)    state = (CState *) pg_malloc(sizeof(CState));    memset(state, 0,
sizeof(CState));
-    while ((c = getopt_long(argc, argv, "ih:nvp:dqSNc:j:Crs:t:T:U:lf:D:F:M:P:", long_options, &optindex)) != -1)
+    while ((c = getopt_long(argc, argv, "ih:nvp:dqSNc:j:Crs:t:T:U:lf:D:F:M:P:R:", long_options, &optindex)) != -1)
{       switch (c)        {

@@ -2371,6 +2487,19 @@ main(int argc, char **argv)                    exit(1);                }                break;
+            case 'R':
+            {
+                /* get a double from the beginning of option value */
+                double throttle_value = atof(optarg);
+                if (throttle_value <= 0.0)
+                {
+                    fprintf(stderr, "invalid rate limit: %s\n", optarg);
+                    exit(1);
+                }
+                /* Invert rate limit into a time offset */
+                throttle_delay = (int64) (1000000.0 / throttle_value);
+            }
+                break;            case 0:                /* This covers long options which take no argument. */
       break;

@@ -2408,6 +2537,9 @@ main(int argc, char **argv)        }    }
+    /* compute a per thread delay */
+    throttle_delay *= nthreads;
+    if (argc > optind)        dbName = argv[optind];    else
@@ -2721,6 +2853,9 @@ main(int argc, char **argv)            TResult    *r = (TResult *) ret;            total_xacts +=
r->xacts;
+            throttle_lag += r->throttle_lag;
+            if (r->throttle_lag_max > throttle_lag_max)
+                throttle_lag_max = r->throttle_lag_max;            INSTR_TIME_ADD(conn_total_time, r->conn_time);
     free(ret);        }

@@ -2731,7 +2866,7 @@ main(int argc, char **argv)    INSTR_TIME_SET_CURRENT(total_time);
INSTR_TIME_SUBTRACT(total_time,start_time);    printResults(ttype, total_xacts, nclients, threads, nthreads,

-                 total_time, conn_total_time);
+                 total_time, conn_total_time, throttle_lag, throttle_lag_max);    return 0;}
@@ -2756,6 +2891,17 @@ threadRun(void *arg)    AggVals        aggs;
+    /*
+     * Initialize throttling rate target for all of the thread's clients.  It
+     * might be a little more accurate to reset thread->start_time here too.
+     * The possible drift seems too small relative to typical throttle delay
+     * times to worry about it.
+     */
+    INSTR_TIME_SET_CURRENT(start);
+    thread->throttle_trigger = INSTR_TIME_GET_MICROSEC(start);
+    thread->throttle_lag = 0;
+    thread->throttle_lag_max = 0;
+    result = pg_malloc(sizeof(TResult));    INSTR_TIME_SET_ZERO(result->conn_time);
@@ -2831,25 +2977,38 @@ threadRun(void *arg)            Command   **commands = sql_files[st->use_file];            int
         sock;

-            if (st->sleeping)
+            if (st->con == NULL)            {
-                int            this_usec;
-
-                if (min_usec == INT64_MAX)
+                continue;
+            }
+            else if (st->sleeping)
+            {
+                if (st->throttling && timer_exceeded)                {
-                    instr_time    now;
-
-                    INSTR_TIME_SET_CURRENT(now);
-                    now_usec = INSTR_TIME_GET_MICROSEC(now);
+                    /* interrupt client which has not started a transaction */
+                    remains--;
+                    st->sleeping = 0;
+                    st->throttling = false;
+                    PQfinish(st->con);
+                    st->con = NULL;
+                    continue;                }
+                else /* just a nap from the script */
+                {
+                    int            this_usec;
-                this_usec = st->until - now_usec;
-                if (min_usec > this_usec)
-                    min_usec = this_usec;
-            }
-            else if (st->con == NULL)
-            {
-                continue;
+                    if (min_usec == INT64_MAX)
+                    {
+                        instr_time    now;
+
+                        INSTR_TIME_SET_CURRENT(now);
+                        now_usec = INSTR_TIME_GET_MICROSEC(now);
+                    }
+
+                    this_usec = st->until - now_usec;
+                    if (min_usec > this_usec)
+                        min_usec = this_usec;
+                }            }            else if (commands[st->state]->type == META_COMMAND)            {
@@ -2986,6 +3145,8 @@ done:    result->xacts = 0;    for (i = 0; i < nstate; i++)        result->xacts +=
state[i].cnt;
+    result->throttle_lag = thread->throttle_lag;
+    result->throttle_lag_max = thread->throttle_lag_max;    INSTR_TIME_SET_CURRENT(end);
INSTR_TIME_ACCUM_DIFF(result->conn_time,end, start);    if (logfile)
Hello Tatsuo,

> I think I'm starting to understand what's going on.  Suppose there are
> n transactions be issued by pgbench and it decides each schedule d(0),
> d(1)... d(n). Actually the schedule d(i) (which is stored in
> st->until) is decided by the following code:
>
>         int64 wait = (int64)
>             throttle_delay * -log(getrand(thread, 1, 1000)/1000.0);
>         thread->throttle_trigger += wait;
>         st->until = thread->throttle_trigger;

Yep. Let us say d(i) is the target starting time for transaction i, that
is "throttle_trigger" above.

> st->until represents the time for a transaction to be finished by the
> time. Now the transaction i finishes at t(i).

No, it is the time for the **start** of the transaction. The client is
sleeping "until" this time. We can only try to control the beginning of
the transaction. It ends when it ends!

> So the lag l(i) = t(i) -d(i) if the transaction is behind.

Transaction i "lags behind" if it *starts* later that d(i). If it start
effectively at t(i), t(i)>=d(i), lag l(i) = t(i)-d(i). When it completes
is not the problem of the scheduler.

> Then next transaction i+1 begins. The lag l(i+1) = t(i+1) - d(i+1) and
> so on. At the end of pgbench, it shows the average lag as
> sum(l(0)...l(n))/n.

Yes.

> Now suppose we have 3 transactions and each has following values:
>
> d(0) = 10
> d(1) = 20
> d(2) = 30
>
> t(0) = 100
> t(1) = 110
> t(2) = 120
>
> That says pgbench expects the duration 10 for each transaction.

pgbench does not expect any duration, but your proposed scheduling d(i)
cannot be followed if the duration is more than 10.

With your above figures, with d(i) the expected start time and t(i) the
actual start time, then for some reason pgbench was not around to start
transaction before time 100 (maybe the OS switched the process off to
attend to other stuff) although it should have started at 10, so l(0) =
90. Then the second transaction starts readily at 110, but was expected at
20 nevertheless, 90 lag again. Same for the last one. All transactions
started 90 units after their scheduled time, the cumulative lag is 270,
the average lag is 90.

If I take another example.
 - Scheduled start time d(0 .. 3) = 0 20 40 60 - Durations D(0 .. 3) = 15 25 50 10 - Actual start time for transactions
 t(0) = 3 (it is late by 3 for some reason), completes by 18   t(1) = t(0)+D(0) + some more lag for some reason = 21,
completesby 46   t(2) = t(1)+D(1) + no additional lag here = 46, completes by 96   t(3) = t(2)+D(2) + some more lag for
somereason = 97, completes by 107


The l(0 .. 3) = 3-0, 21-20, 46-40, 97-60

Total lag is 3 + 1 + 6 + 37 = 48

Average lag = 48/4 = 12

In this example, some lag is due to the process (3 at the beginning, 1 on
the second transaction), some other is due to a transaction duration which
impact the following transactions.

> However actually pgbench calculates like this:
>
> average lag = (t(0)-d(0) + t(1)-d(1) + t(2)-d(2))/3
>            = (100-10 + 110-20 + 120-30)/3
>            = (90 + 90 + 90)/3
>            = 90

Yes, this is correct.

> Looks like too much lag calculated. The difference between the lag
> which pgbench calculates and the expected one will be growing if a lag
> happens eariler. I guess why my Linux box shows bigger lag than Mac OS
> X is, the first transaction or early transactions run slowly than the
> ones run later.

Possibly.

> Of course this conclusion depends on the definition of the "average
> rate limit lag" of pgbench. So you might have other opinion. However
> the way how pgbench calculates the average lag is not expected at
> least for me.

Indeed, I think that it really depends on your definition of lag. The lag
I defined is the time between the scheduled transaction start time and the
actual transaction start time. This is a measure of how well pgbench is
able to follow the stochastic process, and if pgbench is constantly late
then it cumulates a lot, but that basically mean that there is not enough
(cpu) resources to run pgbench cleanly.

What you seem to expect is the average transaction latency. This is also a
useful measure, and I'm planning to add a clean measure of that when under
throttling, and also with --progress, as the current computation based on
tps is not significant under throttling.

But that is a plan for the next commitfest!

--
Fabien.
Hello Greg,

> The lag computation was not the interesting part of this feature to me.  As I
> said before, I considered it more of a debugging level thing than a number
> people would analyze as much as you did.  I understand why you don't like it
> though.  If the reference time was moved forward to match the transaction end
> each time, I think that would give the lag definition you're looking for.
> That's fine to me too, if Fabien doesn't have a good reason to reject the
> idea.  We would need to make sure that doesn't break some part of the design
> too.

I really thing that the information currently computed is useful. First,
as you note, for debug, not really debugging the throttling feature which
works fine, but being able to debug performance if something goes wrong
while running a bench. Another reason why it is useful is that from a
client perspective it measures whether the database system is coping with
the load without incurring additional delays by processing clients
requests (say from the web server) far behind their actual (i.e.
scheduled) occurences.

So my recommendation is : please keep this measure as it, and if you want
the other lag measure, why not add it as well next to the previous one?

--
Fabien.
Fabien,

> Hello again Tatsuo,
>
>> For your information, included is the patch against git master head to
>> implement the lag in a way what I proposed. With the patch, I get more
>> consistent number on Linux (and Mac OS X).
>
> I must disagree with your proposal: At least, it does not provide the
> information I want, but another one.
>
> ISTM that this patch measures the lag which is due to pgbench thread
> coming around to deal with a transaction after sleeping. I would
> expect that to be quite small most of the time, so I agree that it
> must be reassuringly consistent.
>
> However it does not provide the information I want, which is the
> measure of the health of pgbench with respect to the stochastic
> process scheduled transactions.
>
> Basically you propose a partial lag measure, which will be smaller,
> but which does not tell whether pgbench is able to follow the
> schedule, which is the information I find useful in this context to
> appreciate if the throttling is going well.

I don't care what kind of measurement is provided by pgbench. However
I *do* care about what the measurement means is clearly described in
the doc as a committer. I think current measurement method will give
enough confusion if it's not provided with detailed explanation. Could
you please provide doc updatation?
--
Tatsuo Ishii
SRA OSS, Inc. Japan
English: http://www.sraoss.co.jp/index_en.php
Japanese: http://www.sraoss.co.jp
Hello Tatsuo

> I think current measurement method will give enough confusion if it's
> not provided with detailed explanation. Could you please provide doc
> updatation?

Please find a v17 proposition with an updated and extended documentation,
focussed on clarifying the lag measure and its implications, and taking
into account the recent discussion on the list with you & Greg.

However I'm not a native English speaker, if you find that some part are
not clear enough, please tell me what can be improved further.

--
Fabien.
Hello again Tatsuo,

> For your information, included is the patch against git master head to
> implement the lag in a way what I proposed. With the patch, I get more
> consistent number on Linux (and Mac OS X).

I must disagree with your proposal: At least, it does not provide the
information I want, but another one.

ISTM that this patch measures the lag which is due to pgbench thread
coming around to deal with a transaction after sleeping. I would expect
that to be quite small most of the time, so I agree that it must be
reassuringly consistent.

However it does not provide the information I want, which is the measure
of the health of pgbench with respect to the stochastic process scheduled
transactions.

Basically you propose a partial lag measure, which will be smaller, but
which does not tell whether pgbench is able to follow the schedule, which
is the information I find useful in this context to appreciate if the
throttling is going well.

--
Fabien.
> Hello Tatsuo
>
>> I think current measurement method will give enough confusion if it's
>> not provided with detailed explanation. Could you please provide doc
>> updatation?
>
> Please find a v17 proposition with an updated and extended
> documentation, focussed on clarifying the lag measure and its
> implications, and taking into account the recent discussion on the
> list with you & Greg.

Thanks!

> However I'm not a native English speaker, if you find that some part
> are not clear enough, please tell me what can be improved further.

I'm not a native English speaker either... Greg, could you please
review the document?
--
Tatsuo Ishii
SRA OSS, Inc. Japan
English: http://www.sraoss.co.jp/index_en.php
Japanese: http://www.sraoss.co.jp
On 7/18/13 6:45 PM, Tatsuo Ishii wrote:
> I'm not a native English speaker either... Greg, could you please
> review the document?

Yes, I already took at look at it briefly.  The updates move in the
right direction, but I can edit them usefully before commit.  I'll have
that done by tomorrow and send out a new version.  I'm hopeful that v18
will finally be the one that everyone likes.

--
Greg Smith   2ndQuadrant US    greg@2ndQuadrant.com   Baltimore, MD
PostgreSQL Training, Services, and 24x7 Support www.2ndQuadrant.com
>> I'm not a native English speaker either... Greg, could you please
>> review the document?
>
> Yes, I already took at look at it briefly.  The updates move in the right
> direction, but I can edit them usefully before commit.

Great, thanks for your help!

--
Fabien.
Greg,

> Yes, I already took at look at it briefly.  The updates move in the
> right direction, but I can edit them usefully before commit.  I'll
> have that done by tomorrow and send out a new version.  I'm hopeful
> that v18 will finally be the one that everyone likes.

Have you done it?
--
Tatsuo Ishii
SRA OSS, Inc. Japan
English: http://www.sraoss.co.jp/index_en.php
Japanese: http://www.sraoss.co.jp
Attached is an update that I think sorts out all of the documentation
concerns.  I broke this section into paragraphs now that it's getting so
long too.

The only code change is that this now labels the controversial lag here
"average rate limit schedule lag".  That way if someone wants to
introduce other measures of rate limit lag, like a more transaction
oriented one, you might call that "average rate limit transaction lag"
and tell the two apart.

The rewritten documentation here tries to communicate that there is a
schedule that acts like it was pre-computed at the start of each client
too.  It's not ever adjusted based on what individual transactions do.
I also noted the way this can cause schedule lag for some time after a
slow transaction finishes, since that's the main issue observed so far.

--
Greg Smith   2ndQuadrant US    greg@2ndQuadrant.com   Baltimore, MD
PostgreSQL Training, Services, and 24x7 Support www.2ndQuadrant.com
Вложения
Hello Greg,

Thanks for the improvement!


I have a small reservation about "finish/end time schedule" in the second
paragraph, or maybe there is something that I do not understand. There is
no schedule for finishing anything, only start times are scheduled, so I
wish the text could avoid suggesting that finish time are scheduled.

> The rate is targeted by starting transactions along a
> Poisson-distributed schedule time line.  The expected

> finish time schedule

-> start time schedule

> moves forward based on when the client first started, not when
> the previous transaction ended.


> That approach means that when transactions go past their original
> scheduled end time, it is possible for later ones to catch up again.

-> That approach means that long transactions can result in later
transactions to be late with respect to the schedule, while short
transactions makes it possible for late ones to catch up again.

Would you be ok with that?

--
Fabien.
Greg Smith wrote:

Thanks.  I didn't look at the code, but while trying to read the docs:

> +        <para>
> +         High rate limit schedule lag values, that is values not small with
> +         respect to the actual transaction latency, indicate that something is
> +         amiss in the throttling process.

I couldn't really parse the above.  Of the first six words, which one is
a verb?  Is there a noun that needs to be plural?  Is there a word that
shouldn't be there?

... Oh, I think it makes sense if I assume that "rate limit schedule lag"
is a single concept .. but if so, that phrase seems too many words for it.
(So when the RLSL values are high, this indicates a problem.  Is that
what the above means?)

Also, it took me a while to understand what "values not small" means.  I
think there must be a way to phrase this that's easier to understand.

>                                            High lag can highlight a subtle
> +         problem there even if the target rate limit is met in the end.  One
> +         possible cause of schedule lage is insufficient pgbench threads to
> +         handle all of the clients.

typo "lage" above.

>                                       To improve that, consider reducing the
> +         number of clients, increasing the number of threads in pgbench, or
> +         running pgbench on a separate host.  Another possibility is that the
> +         database is not keeping up with the load at some point.  When that
> +         happens, you will have to reduce the expected transaction rate to
> +         lower schedule lag.
> +        </para>

Thanks

--
Álvaro Herrera                http://www.2ndQuadrant.com/
PostgreSQL Development, 24x7 Support, Training & Services
Hello Alvaro,

> Thanks.  I didn't look at the code, but while trying to read the docs:
>
>> +        <para>
>> +         High rate limit schedule lag values, that is values not small with
>> +         respect to the actual transaction latency, indicate that something is
>> +         amiss in the throttling process.
>
> I couldn't really parse the above.  Of the first six words, which one is
> a verb?

None. "High values for the time lag measured with respect to the <rate
limit schedule>".

> Is there a noun that needs to be plural?  Is there a word that shouldn't
> be there?

I do not think so.

> ... Oh, I think it makes sense if I assume that "rate limit schedule lag"
> is a single concept .. but if so, that phrase seems too many words for it.
> (So when the RLSL values are high, this indicates a problem.  Is that
> what the above means?)

Yep!

> Also, it took me a while to understand what "values not small" means.  I
> think there must be a way to phrase this that's easier to understand.

That's what we are trying to do, but we still need to be precise. With
less words it seems more understandable, but previous versions suggested
that the meaning with ambiguous, that is people put their own intuitive
definition of lag, which resulted in surprises at the measures and
cumulative behavior. The alternative was either to change what is
measured, but I insisted that this measure is the useful one, or to try to
reduce the ambiguity of the documentation, the result of efforts by Greg &
myself your helping to debug:-)

>>                                            High lag can highlight a subtle
>> +         problem there even if the target rate limit is met in the end.

I'm fine with that, if it is clear from the context that the lag we're
talking about is the one defined on the preceeding paragraph. Greg what
do you think?

>> + One possible cause of schedule lage is insufficient pgbench threads
>> to handle all of the clients.
>
> typo "lage" above.

Indeed.

>>                                       To improve that, consider
>> reducing the + number of clients, increasing the number of threads in
>> pgbench, or + running pgbench on a separate host.  Another possibility
>> is that the + database is not keeping up with the load at some point.
>> When that + happens, you will have to reduce the expected transaction
>> rate to + lower schedule lag. + </para>

Thanks for your help!

--
Fabien.
Very minor update with V19 here, to reflect Alvaro's comments.  The
tricky part now reads like this:

High rate limit schedule lag values, that is lag values that are large
compared to the actual transaction latency, indicate that something is
amiss in the throttling process.  High schedule lag can highlight a
subtle problem there even if the target rate limit is met in the end.

--
Greg Smith   2ndQuadrant US    greg@2ndQuadrant.com   Baltimore, MD
PostgreSQL Training, Services, and 24x7 Support www.2ndQuadrant.com
Вложения
On Mon, Jul 22, 2013 at 01:49:39PM -0400, Greg Smith wrote:
> Very minor update with V19 here, to reflect Alvaro's comments.  The
> tricky part now reads like this:
>
> High rate limit schedule lag values,

"High values of the rate limit schedule lag measurement?"

> that is lag values that are large compared to the actual transaction
> latency, indicate that something is amiss in the throttling process.
> High schedule lag can highlight a subtle problem there even if the
> target rate limit is met in the end.

Cheers,
David.
--
David Fetter <david@fetter.org> http://fetter.org/
Phone: +1 415 235 3778  AIM: dfetter666  Yahoo!: dfetter
Skype: davidfetter      XMPP: david.fetter@gmail.com
iCal: webcal://www.tripit.com/feed/ical/people/david74/tripit.ics

Remember to vote!
Consider donating to Postgres: http://www.postgresql.org/about/donate
> Very minor update with V19 here, to reflect Alvaro's comments.  The
> tricky part now reads like this:
>
> High rate limit schedule lag values, that is lag values that are large
> compared to the actual transaction latency, indicate that something is
> amiss in the throttling process.  High schedule lag can highlight a
> subtle problem there even if the target rate limit is met in the end.

I have committed this along with slight modification. I changed
"--rate rate" to "--rate=rate" to follow option style of pgbench.

Also I have removed a space in "--progress= sec" in the doc, which is
probably mistakenly added by previous commit.
--
Tatsuo Ishii
SRA OSS, Inc. Japan
English: http://www.sraoss.co.jp/index_en.php
Japanese: http://www.sraoss.co.jp