Обсуждение: Re: [pgadmin-support] Issue with a hanging apply process on the replica db after vacuum works on primary
Hi Radovan !
Thank you for the reply. The question is that this table is not a subject for a massive updates/deletes.
Is there any additional traces except from perf or pg_top to trace what replica is doing at the particular moment when we are lagging in replay? To see locks or spins or sleeps etc..
Thank you!
Thank you for the reply. The question is that this table is not a subject for a massive updates/deletes.
Is there any additional traces except from perf or pg_top to trace what replica is doing at the particular moment when we are lagging in replay? To see locks or spins or sleeps etc..
Thank you!
-

Best regards,
Sergey Shchukin
24.02.2015 19:05, Radovan Jablonovsky пишет:
This looks like more issue for pgsql-general mailing list.Possible solutions1) Set specific autovacuum parameters on the big table. The autovacuum could vacuum table on multiple runs based on the thresholds and cost settingsExample of setting specific values of autovacuum and analyze for table. It should be adjusted for your system, work load, table usage, etc:alter table "my_schema"."my_big_table" set (fillfactor = 80, autovacuum_enabled = true, autovacuum_vacuum_threshold = 200, autovacuum_analyze_threshold = 400, autovacuum_vacuum_scale_factor = 0.05, autovacuum_analyze_scale_factor = 0.005, autovacuum_vacuum_cost_delay = 10, autovacuum_vacuum_cost_limit = 5000);2) Could be to partition the large table on master site and vacuum it partition by partition.On Tue, Feb 24, 2015 at 6:42 AM, Sergey Shchukin <shchukin.s.a@gmail.com> wrote:Hi all!
May someone help me with the issue in the apply process on the replica. We have a stream replication and after vacuum stops working with a big table we get a "freeze" in applying data on the replica database. It looks like this:
Tue Feb 24 15:04:51 MSK 2015 Stream: MASTER-masterdb:79607136410456 SLAVE:79607136410456 Replay:79607136339456 :: REPLAY 69 KBytes (00:00:00.294485 seconds)
Tue Feb 24 15:04:52 MSK 2015 Stream: MASTER-masterdb:79607137892672 SLAVE:79607137715392 Replay:79607137715392 :: REPLAY 173 KBytes (00:00:00.142605 seconds)
Tue Feb 24 15:04:53 MSK 2015 Stream: MASTER-masterdb:79607139327776 SLAVE:79607139241816 Replay:79607139241816 :: REPLAY 84 KBytes (00:00:00.05223 seconds)
Tue Feb 24 15:04:54 MSK 2015 Stream: MASTER-masterdb:79607141134776 SLAVE:79607141073344 Replay:79607141080032 :: REPLAY 54 KBytes (00:00:00.010603 seconds)
Tue Feb 24 15:04:55 MSK 2015 Stream: MASTER-masterdb:79607143085176 SLAVE:79607143026440 Replay:79607143038040 :: REPLAY 46 KBytes (00:00:00.009506 seconds)
Tue Feb 24 15:04:56 MSK 2015 Stream: MASTER-masterdb:79607145111280 SLAVE:79607145021384 Replay:79607145025664 :: REPLAY 83 KBytes (00:00:00.006795 seconds)
Tue Feb 24 15:04:57 MSK 2015 Stream: MASTER-masterdb:79607146564424 SLAVE:79607146478336 Replay:79607146501264 :: REPLAY 61 KBytes (00:00:00.00701 seconds)
Tue Feb 24 15:04:58 MSK 2015 Stream: MASTER-masterdb:79607148160680 SLAVE:79607148108352 Replay:79607147369320 :: REPLAY 773 KBytes (00:00:00.449702 seconds)
Tue Feb 24 15:04:59 MSK 2015 Stream: MASTER-masterdb:79607150220688 SLAVE:79607150159632 Replay:79607150171312 :: REPLAY 48 KBytes (00:00:00.006594 seconds)
Tue Feb 24 15:05:00 MSK 2015 Stream: MASTER-masterdb:79607152365360 SLAVE:79607152262696 Replay:79607152285240 :: REPLAY 78 KBytes (00:00:00.007042 seconds)
Tue Feb 24 15:05:02 MSK 2015 Stream: MASTER-masterdb:79607154049848 SLAVE:79607154012624 Replay:79607153446800 :: REPLAY 589 KBytes (00:00:00.513637 seconds)
Tue Feb 24 15:05:03 MSK 2015 Stream: MASTER-masterdb:79607155229992 SLAVE:79607155187864 Replay:79607155188312 :: REPLAY 41 KBytes (00:00:00.004773 seconds)
Tue Feb 24 15:05:04 MSK 2015 Stream: MASTER-masterdb:79607156833968 SLAVE:79607156764128 Replay:79607156785488 :: REPLAY 47 KBytes (00:00:00.006846 seconds)
Tue Feb 24 15:05:05 MSK 2015 Stream: MASTER-masterdb:79607158419848 SLAVE:79607158344856 Replay:79607158396352 :: REPLAY 23 KBytes (00:00:00.005228 seconds)
Tue Feb 24 15:05:06 MSK 2015 Stream: MASTER-masterdb:79607160004776 SLAVE:79607159962400 Replay:79607159988888 :: REPLAY 16 KBytes (00:00:00.003162 seconds)
--here apply process just stops
Tue Feb 24 15:05:07 MSK 2015 Stream: MASTER-masterdb:79607161592048 SLAVE:79607161550576 Replay:79607160986064 :: REPLAY 592 KBytes (00:00:00.398376 seconds)
Tue Feb 24 15:05:08 MSK 2015 Stream: MASTER-masterdb:79607163272840 SLAVE:79607163231384 Replay:79607160986064 :: REPLAY 2233 KBytes (00:00:01.446759 seconds)
Tue Feb 24 15:05:09 MSK 2015 Stream: MASTER-masterdb:79607164958632 SLAVE:79607164904448 Replay:79607160986064 :: REPLAY 3879 KBytes (00:00:02.497181 seconds)
Tue Feb 24 15:05:10 MSK 2015 Stream: MASTER-masterdb:79607166819560 SLAVE:79607166777712 Replay:79607160986064 :: REPLAY 5697 KBytes (00:00:03.543107 seconds)
Tue Feb 24 15:05:11 MSK 2015 Stream: MASTER-masterdb:79607168595280 SLAVE:79607168566536 Replay:79607160986064 :: REPLAY 7431 KBytes (00:00:04.589736 seconds)
Tue Feb 24 15:05:12 MSK 2015 Stream: MASTER-masterdb:79607170372064 SLAVE:79607170252480 Replay:79607160986064 :: REPLAY 9166 KBytes (00:00:05.635918 seconds)
Tue Feb 24 15:05:13 MSK 2015 Stream: MASTER-masterdb:79607171829480 SLAVE:79607171714144 Replay:79607160986064 :: REPLAY 10589 KBytes (00:00:06.688115 seconds)
Tue Feb 24 15:05:14 MSK 2015 Stream: MASTER-masterdb:79607173152488 SLAVE:79607173152488 Replay:79607160986064 :: REPLAY 11881 KBytes (00:00:07.736993 seconds)
Tue Feb 24 15:05:15 MSK 2015 Stream: MASTER-masterdb:79607174149968 SLAVE:79607174149968 Replay:79607160986064 :: REPLAY 12855 KBytes (00:00:08.78538 seconds)
Tue Feb 24 15:05:16 MSK 2015 Stream: MASTER-masterdb:79607176448344 SLAVE:79607176252088 Replay:79607160986064 :: REPLAY 15100 KBytes (00:00:09.835184 seconds)
Tue Feb 24 15:05:17 MSK 2015 Stream: MASTER-masterdb:79607177632216 SLAVE:79607177608224 Replay:79607160986064 :: REPLAY 16256 KBytes (00:00:10.926493 seconds)
Tue Feb 24 15:05:18 MSK 2015 Stream: MASTER-masterdb:79607179432960 SLAVE:79607179378096 Replay:79607160986064 :: REPLAY 18015 KBytes (00:00:11.97989 seconds)
Tue Feb 24 15:05:19 MSK 2015 Stream: MASTER-masterdb:79607180893384 SLAVE:79607180874256 Replay:79607160986064 :: REPLAY 19441 KBytes (00:00:13.028921 seconds)
Tue Feb 24 15:05:20 MSK 2015 Stream: MASTER-masterdb:79607182596224 SLAVE:79607182552272 Replay:79607160986064 :: REPLAY 21104 KBytes (00:00:14.079497 seconds)
Tue Feb 24 15:05:21 MSK 2015 Stream: MASTER-masterdb:79607183935312 SLAVE:79607183902592 Replay:79607160986064 :: REPLAY 22411 KBytes (00:00:15.127679 seconds)
Tue Feb 24 15:05:23 MSK 2015 Stream: MASTER-masterdb:79607185165880 SLAVE:79607185094032 Replay:79607160986064 :: REPLAY 23613 KBytes (00:00:16.175132 seconds)
Tue Feb 24 15:05:24 MSK 2015 Stream: MASTER-masterdb:79607187196920 SLAVE:79607187169368 Replay:79607160986064 :: REPLAY 25596 KBytes (00:00:17.221981 seconds)
Tue Feb 24 15:05:25 MSK 2015 Stream: MASTER-masterdb:79607188943856 SLAVE:79607188885952 Replay:79607160986064 :: REPLAY 27302 KBytes (00:00:18.274362 seconds)
Tue Feb 24 15:05:26 MSK 2015 Stream: MASTER-masterdb:79607190489400 SLAVE:79607190443160 Replay:79607160986064 :: REPLAY 28812 KBytes (00:00:19.319987 seconds)
Tue Feb 24 15:05:27 MSK 2015 Stream: MASTER-masterdb:79607192089312 SLAVE:79607192054048 Replay:79607160986064 :: REPLAY 30374 KBytes (00:00:20.372305 seconds)
Tue Feb 24 15:05:28 MSK 2015 Stream: MASTER-masterdb:79607193736800 SLAVE:79607193690056 Replay:79607160986064 :: REPLAY 31983 KBytes (00:00:21.421359 seconds)
Tue Feb 24 15:05:29 MSK 2015 Stream: MASTER-masterdb:79607195968648 SLAVE:79607195901296 Replay:79607160986064 :: REPLAY 34163 KBytes (00:00:22.471334 seconds)
Tue Feb 24 15:05:30 MSK 2015 Stream: MASTER-masterdb:79607197808840 SLAVE:79607197737720 Replay:79607160986064 :: REPLAY 35960 KBytes (00:00:23.52269 seconds)
Tue Feb 24 15:05:31 MSK 2015 Stream: MASTER-masterdb:79607199571144 SLAVE:79607199495976 Replay:79607160986064 :: REPLAY 37681 KBytes (00:00:24.577615 seconds)
Tue Feb 24 15:05:32 MSK 2015 Stream: MASTER-masterdb:79607201206104 SLAVE:79607201100392 Replay:79607160986064 :: REPLAY 39277 KBytes (00:00:25.624604 seconds)
Tue Feb 24 15:05:33 MSK 2015 Stream: MASTER-masterdb:79607203174208 SLAVE:79607203111136 Replay:79607160986064 :: REPLAY 41199 KBytes (00:00:26.67059 seconds)
Tue Feb 24 15:05:34 MSK 2015 Stream: MASTER-masterdb:79607204792888 SLAVE:79607204741600 Replay:79607160986064 :: REPLAY 42780 KBytes (00:00:27.719088 seconds)
Tue Feb 24 15:05:35 MSK 2015 Stream: MASTER-masterdb:79607206453216 SLAVE:79607206409032 Replay:79607160986064 :: REPLAY 44401 KBytes (00:00:28.766647 seconds)
Tue Feb 24 15:05:36 MSK 2015 Stream: MASTER-masterdb:79607208225344 SLAVE:79607208142176 Replay:79607160986064 :: REPLAY 46132 KBytes (00:00:29.811434 seconds)
perf shows the following functions on the top
+ 22.50% postmaster [kernel.kallsyms] [k] copy_user_generic_string
+ 8.48% postmaster postgres [.] hash_search_with_hash_value
after 10 minutes or so the apply process continue to work
Tue Feb 24 15:13:25 MSK 2015 Stream: MASTER-masterdb:79608758742560 SLAVE:79608758718008 Replay:79607160986064 :: REPLAY 1560309 KBytes (00:08:19.009653 seconds)
Tue Feb 24 15:13:26 MSK 2015 Stream: MASTER-masterdb:79608759203608 SLAVE:79608759189680 Replay:79607160986064 :: REPLAY 1560759 KBytes (00:08:20.057877 seconds)
Tue Feb 24 15:13:27 MSK 2015 Stream: MASTER-masterdb:79608759639680 SLAVE:79608759633224 Replay:79607160986064 :: REPLAY 1561185 KBytes (00:08:21.104723 seconds)
Tue Feb 24 15:13:28 MSK 2015 Stream: MASTER-masterdb:79608760271200 SLAVE:79608760264128 Replay:79607160986064 :: REPLAY 1561802 KBytes (00:08:22.148546 seconds)
Tue Feb 24 15:13:30 MSK 2015 Stream: MASTER-masterdb:79608760622920 SLAVE:79608760616656 Replay:79607160986064 :: REPLAY 1562145 KBytes (00:08:23.196645 seconds)
Tue Feb 24 15:13:31 MSK 2015 Stream: MASTER-masterdb:79608761122040 SLAVE:79608761084584 Replay:79607160986064 :: REPLAY 1562633 KBytes (00:08:24.240653 seconds)
Tue Feb 24 15:13:32 MSK 2015 Stream: MASTER-masterdb:79608761434200 SLAVE:79608761426080 Replay:79607160986064 :: REPLAY 1562938 KBytes (00:08:25.289429 seconds)
Tue Feb 24 15:13:33 MSK 2015 Stream: MASTER-masterdb:79608761931008 SLAVE:79608761904808 Replay:79607160986064 :: REPLAY 1563423 KBytes (00:08:26.338498 seconds)
--apply starts
Tue Feb 24 15:13:34 MSK 2015 Stream: MASTER-masterdb:79608762360568 SLAVE:79608762325712 Replay:79607163554680 :: REPLAY 1561334 KBytes (00:08:25.702423 seconds)
Tue Feb 24 15:13:35 MSK 2015 Stream: MASTER-masterdb:79608762891224 SLAVE:79608762885928 Replay:79607166466488 :: REPLAY 1559008 KBytes (00:08:25.011046 seconds)
Tue Feb 24 15:13:36 MSK 2015 Stream: MASTER-masterdb:79608763681920 SLAVE:79608763667256 Replay:79607167054056 :: REPLAY 1559207 KBytes (00:08:25.827531 seconds)
Tue Feb 24 15:13:37 MSK 2015 Stream: MASTER-masterdb:79608764207088 SLAVE:79608764197744 Replay:79607175610296 :: REPLAY 1551364 KBytes (00:08:21.182428 seconds)
Tue Feb 24 15:13:38 MSK 2015 Stream: MASTER-masterdb:79608764857920 SLAVE:79608764832432 Replay:79607183599632 :: REPLAY 1544197 KBytes (00:08:16.742467 seconds)
Tue Feb 24 15:13:39 MSK 2015 Stream: MASTER-masterdb:79608765323360 SLAVE:79608765281408 Replay:79607186862176 :: REPLAY 1541466 KBytes (00:08:15.569874 seconds)
Tue Feb 24 15:13:40 MSK 2015 Stream: MASTER-masterdb:79608765848240 SLAVE:79608765824520 Replay:79607186862176 :: REPLAY 1541978 KBytes (00:08:16.620932 seconds)
All this is a result of completion of "vacuum verbose analyze master_table" on the master site
Any help would be appreciated-- Best regards, Sergey Shchukin--Radovan Jablonovsky | SaaS DBA | Phone 1-403-262-6519 (ext. 7256) | Fax 1-403-233-8046
Replicon | Hassle-Free Time & Expense Management Software - 7,300 Customers - 70 Countries
www.replicon.com | facebook | twitter | blog | contact usWe are hiring! | search jobs
On 2/26/15 12:25 AM, Sergey Shchukin wrote: > Hi Radovan ! > > Thank you for the reply. The question is that this table is not a > subject for a massive updates/deletes. > > Is there any additional traces except from perf or pg_top to trace what > replica is doing at the particular moment when we are lagging in replay? > To see locks or spins or sleeps etc.. Please don't top-post. What version is this? What is max_standby_streaming_delay set to? > Thank you! > > - > > Best regards, > Sergey Shchukin > > 24.02.2015 19:05, Radovan Jablonovsky пишет: >> This looks like more issue for pgsql-general mailing list. >> >> Possible solutions >> 1) Set specific autovacuum parameters on the big table. The autovacuum >> could vacuum table on multiple runs based on the thresholds and cost >> settings >> Example of setting specific values of autovacuum and analyze for >> table. It should be adjusted for your system, work load, table usage, etc: >> alter table "my_schema"."my_big_table" set (fillfactor = 80, >> autovacuum_enabled = true, autovacuum_vacuum_threshold = 200, >> autovacuum_analyze_threshold = 400, autovacuum_vacuum_scale_factor = >> 0.05, autovacuum_analyze_scale_factor = 0.005, >> autovacuum_vacuum_cost_delay = 10, autovacuum_vacuum_cost_limit = 5000); >> >> 2) Could be to partition the large table on master site and vacuum it >> partition by partition. >> >> On Tue, Feb 24, 2015 at 6:42 AM, Sergey Shchukin >> <shchukin.s.a@gmail.com <mailto:shchukin.s.a@gmail.com>> wrote: >> >> Hi all! >> >> May someone help me with the issue in the apply process on the >> replica. We have a stream replication and after vacuum stops >> working with a big table we get a "freeze" in applying data on the >> replica database. It looks like this: >> >> Tue Feb 24 15:04:51 MSK 2015 Stream: >> MASTER-masterdb:79607136410456 SLAVE:79607136410456 >> Replay:79607136339456 :: REPLAY 69 KBytes (00:00:00.294485 seconds) >> Tue Feb 24 15:04:52 MSK 2015 Stream: >> MASTER-masterdb:79607137892672 SLAVE:79607137715392 >> Replay:79607137715392 :: REPLAY 173 KBytes (00:00:00.142605 seconds) >> Tue Feb 24 15:04:53 MSK 2015 Stream: >> MASTER-masterdb:79607139327776 SLAVE:79607139241816 >> Replay:79607139241816 :: REPLAY 84 KBytes (00:00:00.05223 seconds) >> Tue Feb 24 15:04:54 MSK 2015 Stream: >> MASTER-masterdb:79607141134776 SLAVE:79607141073344 >> Replay:79607141080032 :: REPLAY 54 KBytes (00:00:00.010603 seconds) >> Tue Feb 24 15:04:55 MSK 2015 Stream: >> MASTER-masterdb:79607143085176 SLAVE:79607143026440 >> Replay:79607143038040 :: REPLAY 46 KBytes (00:00:00.009506 seconds) >> Tue Feb 24 15:04:56 MSK 2015 Stream: >> MASTER-masterdb:79607145111280 SLAVE:79607145021384 >> Replay:79607145025664 :: REPLAY 83 KBytes (00:00:00.006795 seconds) >> Tue Feb 24 15:04:57 MSK 2015 Stream: >> MASTER-masterdb:79607146564424 SLAVE:79607146478336 >> Replay:79607146501264 :: REPLAY 61 KBytes (00:00:00.00701 seconds) >> Tue Feb 24 15:04:58 MSK 2015 Stream: >> MASTER-masterdb:79607148160680 SLAVE:79607148108352 >> Replay:79607147369320 :: REPLAY 773 KBytes (00:00:00.449702 seconds) >> Tue Feb 24 15:04:59 MSK 2015 Stream: >> MASTER-masterdb:79607150220688 SLAVE:79607150159632 >> Replay:79607150171312 :: REPLAY 48 KBytes (00:00:00.006594 seconds) >> Tue Feb 24 15:05:00 MSK 2015 Stream: >> MASTER-masterdb:79607152365360 SLAVE:79607152262696 >> Replay:79607152285240 :: REPLAY 78 KBytes (00:00:00.007042 seconds) >> Tue Feb 24 15:05:02 MSK 2015 Stream: >> MASTER-masterdb:79607154049848 SLAVE:79607154012624 >> Replay:79607153446800 :: REPLAY 589 KBytes (00:00:00.513637 seconds) >> Tue Feb 24 15:05:03 MSK 2015 Stream: >> MASTER-masterdb:79607155229992 SLAVE:79607155187864 >> Replay:79607155188312 :: REPLAY 41 KBytes (00:00:00.004773 seconds) >> Tue Feb 24 15:05:04 MSK 2015 Stream: >> MASTER-masterdb:79607156833968 SLAVE:79607156764128 >> Replay:79607156785488 :: REPLAY 47 KBytes (00:00:00.006846 seconds) >> Tue Feb 24 15:05:05 MSK 2015 Stream: >> MASTER-masterdb:79607158419848 SLAVE:79607158344856 >> Replay:79607158396352 :: REPLAY 23 KBytes (00:00:00.005228 seconds) >> Tue Feb 24 15:05:06 MSK 2015 Stream: >> MASTER-masterdb:79607160004776 SLAVE:79607159962400 >> Replay:79607159988888 :: REPLAY 16 KBytes (00:00:00.003162 seconds) >> *--here apply process just stops* >> >> Tue Feb 24 15:05:07 MSK 2015 Stream: >> MASTER-masterdb:79607161592048 SLAVE:79607161550576 >> Replay:79607160986064 :: REPLAY 592 KBytes (00:00:00.398376 seconds) >> Tue Feb 24 15:05:08 MSK 2015 Stream: >> MASTER-masterdb:79607163272840 SLAVE:79607163231384 >> Replay:79607160986064 :: REPLAY 2233 KBytes (00:00:01.446759 seconds) >> Tue Feb 24 15:05:09 MSK 2015 Stream: >> MASTER-masterdb:79607164958632 SLAVE:79607164904448 >> Replay:79607160986064 :: REPLAY 3879 KBytes (00:00:02.497181 seconds) >> Tue Feb 24 15:05:10 MSK 2015 Stream: >> MASTER-masterdb:79607166819560 SLAVE:79607166777712 >> Replay:79607160986064 :: REPLAY 5697 KBytes (00:00:03.543107 seconds) >> Tue Feb 24 15:05:11 MSK 2015 Stream: >> MASTER-masterdb:79607168595280 SLAVE:79607168566536 >> Replay:79607160986064 :: REPLAY 7431 KBytes (00:00:04.589736 seconds) >> Tue Feb 24 15:05:12 MSK 2015 Stream: >> MASTER-masterdb:79607170372064 SLAVE:79607170252480 >> Replay:79607160986064 :: REPLAY 9166 KBytes (00:00:05.635918 seconds) >> Tue Feb 24 15:05:13 MSK 2015 Stream: >> MASTER-masterdb:79607171829480 SLAVE:79607171714144 >> Replay:79607160986064 :: REPLAY 10589 KBytes (00:00:06.688115 seconds) >> Tue Feb 24 15:05:14 MSK 2015 Stream: >> MASTER-masterdb:79607173152488 SLAVE:79607173152488 >> Replay:79607160986064 :: REPLAY 11881 KBytes (00:00:07.736993 seconds) >> Tue Feb 24 15:05:15 MSK 2015 Stream: >> MASTER-masterdb:79607174149968 SLAVE:79607174149968 >> Replay:79607160986064 :: REPLAY 12855 KBytes (00:00:08.78538 seconds) >> Tue Feb 24 15:05:16 MSK 2015 Stream: >> MASTER-masterdb:79607176448344 SLAVE:79607176252088 >> Replay:79607160986064 :: REPLAY 15100 KBytes (00:00:09.835184 seconds) >> Tue Feb 24 15:05:17 MSK 2015 Stream: >> MASTER-masterdb:79607177632216 SLAVE:79607177608224 >> Replay:79607160986064 :: REPLAY 16256 KBytes (00:00:10.926493 seconds) >> Tue Feb 24 15:05:18 MSK 2015 Stream: >> MASTER-masterdb:79607179432960 SLAVE:79607179378096 >> Replay:79607160986064 :: REPLAY 18015 KBytes (00:00:11.97989 seconds) >> Tue Feb 24 15:05:19 MSK 2015 Stream: >> MASTER-masterdb:79607180893384 SLAVE:79607180874256 >> Replay:79607160986064 :: REPLAY 19441 KBytes (00:00:13.028921 seconds) >> Tue Feb 24 15:05:20 MSK 2015 Stream: >> MASTER-masterdb:79607182596224 SLAVE:79607182552272 >> Replay:79607160986064 :: REPLAY 21104 KBytes (00:00:14.079497 seconds) >> Tue Feb 24 15:05:21 MSK 2015 Stream: >> MASTER-masterdb:79607183935312 SLAVE:79607183902592 >> Replay:79607160986064 :: REPLAY 22411 KBytes (00:00:15.127679 seconds) >> Tue Feb 24 15:05:23 MSK 2015 Stream: >> MASTER-masterdb:79607185165880 SLAVE:79607185094032 >> Replay:79607160986064 :: REPLAY 23613 KBytes (00:00:16.175132 seconds) >> Tue Feb 24 15:05:24 MSK 2015 Stream: >> MASTER-masterdb:79607187196920 SLAVE:79607187169368 >> Replay:79607160986064 :: REPLAY 25596 KBytes (00:00:17.221981 seconds) >> Tue Feb 24 15:05:25 MSK 2015 Stream: >> MASTER-masterdb:79607188943856 SLAVE:79607188885952 >> Replay:79607160986064 :: REPLAY 27302 KBytes (00:00:18.274362 seconds) >> Tue Feb 24 15:05:26 MSK 2015 Stream: >> MASTER-masterdb:79607190489400 SLAVE:79607190443160 >> Replay:79607160986064 :: REPLAY 28812 KBytes (00:00:19.319987 seconds) >> Tue Feb 24 15:05:27 MSK 2015 Stream: >> MASTER-masterdb:79607192089312 SLAVE:79607192054048 >> Replay:79607160986064 :: REPLAY 30374 KBytes (00:00:20.372305 seconds) >> Tue Feb 24 15:05:28 MSK 2015 Stream: >> MASTER-masterdb:79607193736800 SLAVE:79607193690056 >> Replay:79607160986064 :: REPLAY 31983 KBytes (00:00:21.421359 seconds) >> Tue Feb 24 15:05:29 MSK 2015 Stream: >> MASTER-masterdb:79607195968648 SLAVE:79607195901296 >> Replay:79607160986064 :: REPLAY 34163 KBytes (00:00:22.471334 seconds) >> Tue Feb 24 15:05:30 MSK 2015 Stream: >> MASTER-masterdb:79607197808840 SLAVE:79607197737720 >> Replay:79607160986064 :: REPLAY 35960 KBytes (00:00:23.52269 seconds) >> Tue Feb 24 15:05:31 MSK 2015 Stream: >> MASTER-masterdb:79607199571144 SLAVE:79607199495976 >> Replay:79607160986064 :: REPLAY 37681 KBytes (00:00:24.577615 seconds) >> Tue Feb 24 15:05:32 MSK 2015 Stream: >> MASTER-masterdb:79607201206104 SLAVE:79607201100392 >> Replay:79607160986064 :: REPLAY 39277 KBytes (00:00:25.624604 seconds) >> Tue Feb 24 15:05:33 MSK 2015 Stream: >> MASTER-masterdb:79607203174208 SLAVE:79607203111136 >> Replay:79607160986064 :: REPLAY 41199 KBytes (00:00:26.67059 seconds) >> Tue Feb 24 15:05:34 MSK 2015 Stream: >> MASTER-masterdb:79607204792888 SLAVE:79607204741600 >> Replay:79607160986064 :: REPLAY 42780 KBytes (00:00:27.719088 seconds) >> Tue Feb 24 15:05:35 MSK 2015 Stream: >> MASTER-masterdb:79607206453216 SLAVE:79607206409032 >> Replay:79607160986064 :: REPLAY 44401 KBytes (00:00:28.766647 seconds) >> Tue Feb 24 15:05:36 MSK 2015 Stream: >> MASTER-masterdb:79607208225344 SLAVE:79607208142176 >> Replay:79607160986064 :: REPLAY 46132 KBytes (00:00:29.811434 seconds) >> >> >> perf shows the following functions on the top >> + 22.50% postmaster [kernel.kallsyms] [k] copy_user_generic_string >> + 8.48% postmaster postgres [.] >> hash_search_with_hash_value >> >> >> after 10 minutes or so the apply process continue to work >> >> Tue Feb 24 15:13:25 MSK 2015 Stream: >> MASTER-masterdb:79608758742560 SLAVE:79608758718008 >> Replay:79607160986064 :: REPLAY 1560309 KBytes (00:08:19.009653 >> seconds) >> Tue Feb 24 15:13:26 MSK 2015 Stream: >> MASTER-masterdb:79608759203608 SLAVE:79608759189680 >> Replay:79607160986064 :: REPLAY 1560759 KBytes (00:08:20.057877 >> seconds) >> Tue Feb 24 15:13:27 MSK 2015 Stream: >> MASTER-masterdb:79608759639680 SLAVE:79608759633224 >> Replay:79607160986064 :: REPLAY 1561185 KBytes (00:08:21.104723 >> seconds) >> Tue Feb 24 15:13:28 MSK 2015 Stream: >> MASTER-masterdb:79608760271200 SLAVE:79608760264128 >> Replay:79607160986064 :: REPLAY 1561802 KBytes (00:08:22.148546 >> seconds) >> Tue Feb 24 15:13:30 MSK 2015 Stream: >> MASTER-masterdb:79608760622920 SLAVE:79608760616656 >> Replay:79607160986064 :: REPLAY 1562145 KBytes (00:08:23.196645 >> seconds) >> Tue Feb 24 15:13:31 MSK 2015 Stream: >> MASTER-masterdb:79608761122040 SLAVE:79608761084584 >> Replay:79607160986064 :: REPLAY 1562633 KBytes (00:08:24.240653 >> seconds) >> Tue Feb 24 15:13:32 MSK 2015 Stream: >> MASTER-masterdb:79608761434200 SLAVE:79608761426080 >> Replay:79607160986064 :: REPLAY 1562938 KBytes (00:08:25.289429 >> seconds) >> Tue Feb 24 15:13:33 MSK 2015 Stream: >> MASTER-masterdb:79608761931008 SLAVE:79608761904808 >> Replay:79607160986064 :: REPLAY 1563423 KBytes (00:08:26.338498 >> seconds) >> *--apply starts* >> Tue Feb 24 15:13:34 MSK 2015 Stream: >> MASTER-masterdb:79608762360568 SLAVE:79608762325712 >> Replay:79607163554680 :: REPLAY 1561334 KBytes (00:08:25.702423 >> seconds) >> Tue Feb 24 15:13:35 MSK 2015 Stream: >> MASTER-masterdb:79608762891224 SLAVE:79608762885928 >> Replay:79607166466488 :: REPLAY 1559008 KBytes (00:08:25.011046 >> seconds) >> Tue Feb 24 15:13:36 MSK 2015 Stream: >> MASTER-masterdb:79608763681920 SLAVE:79608763667256 >> Replay:79607167054056 :: REPLAY 1559207 KBytes (00:08:25.827531 >> seconds) >> Tue Feb 24 15:13:37 MSK 2015 Stream: >> MASTER-masterdb:79608764207088 SLAVE:79608764197744 >> Replay:79607175610296 :: REPLAY 1551364 KBytes (00:08:21.182428 >> seconds) >> Tue Feb 24 15:13:38 MSK 2015 Stream: >> MASTER-masterdb:79608764857920 SLAVE:79608764832432 >> Replay:79607183599632 :: REPLAY 1544197 KBytes (00:08:16.742467 >> seconds) >> Tue Feb 24 15:13:39 MSK 2015 Stream: >> MASTER-masterdb:79608765323360 SLAVE:79608765281408 >> Replay:79607186862176 :: REPLAY 1541466 KBytes (00:08:15.569874 >> seconds) >> Tue Feb 24 15:13:40 MSK 2015 Stream: >> MASTER-masterdb:79608765848240 SLAVE:79608765824520 >> Replay:79607186862176 :: REPLAY 1541978 KBytes (00:08:16.620932 >> seconds) >> >> >> All this is a result of completion of "vacuum verbose analyze >> master_table" on the master site >> >> Any help would be appreciated >> >> -- >> Best regards, >> Sergey Shchukin >> >> >> >> >> -- >> >> *Radovan Jablonovsky* | SaaS DBA | Phone 1-403-262-6519 (ext. 7256) | >> Fax 1-403-233-8046 >> >> >> * >> >> *Replicon* | Hassle-Free Time & Expense Management Software - 7,300 >> Customers - 70 Countries >> www.replicon.com <http://www.replicon.com/> | facebook >> <http://www.facebook.com/Replicon.inc> | twitter >> <http://twitter.com/Replicon> | blog <http://www.replicon.com/blog/> | >> contact us <http://www.replicon.com/about_replicon/contact_us.aspx> >> >> *We are hiring!* | search jobs >> <http://tbe.taleo.net/NA2/ats/careers/searchResults.jsp?org=REPLICON&cws=1&act=sort&sortColumn=1&__utma=1.651918544.1299001662.1299170819.1299174966.10&__utmb=1.8.10.1299174966&__utmc=1&__utmx=-&__utmz=1.1299174985.10.3.utmcsr=google%7Cutmccn=%28organic%29%7Cutmcmd=organic%7Cutmctr=replicon%20careers&__utmv=1.%7C3=Visitor%20Type=Prospects=1,&__utmk=40578466> >> >> * > -- Jim Nasby, Data Architect, Blue Treble Consulting Data in Trouble? Get it in Treble! http://BlueTreble.com
27.02.2015 11:52, Jim Nasby пишет:
On 2/26/15 12:25 AM, Sergey Shchukin wrote:Hi Jim,Hi Radovan !
Thank you for the reply. The question is that this table is not a
subject for a massive updates/deletes.
Is there any additional traces except from perf or pg_top to trace what
replica is doing at the particular moment when we are lagging in replay?
To see locks or spins or sleeps etc..
Please don't top-post.
What version is this? What is max_standby_streaming_delay set to?Thank you!
-
Best regards,
Sergey Shchukin
24.02.2015 19:05, Radovan Jablonovsky пишет:This looks like more issue for pgsql-general mailing list.
Possible solutions
1) Set specific autovacuum parameters on the big table. The autovacuum
could vacuum table on multiple runs based on the thresholds and cost
settings
Example of setting specific values of autovacuum and analyze for
table. It should be adjusted for your system, work load, table usage, etc:
alter table "my_schema"."my_big_table" set (fillfactor = 80,
autovacuum_enabled = true, autovacuum_vacuum_threshold = 200,
autovacuum_analyze_threshold = 400, autovacuum_vacuum_scale_factor =
0.05, autovacuum_analyze_scale_factor = 0.005,
autovacuum_vacuum_cost_delay = 10, autovacuum_vacuum_cost_limit = 5000);
2) Could be to partition the large table on master site and vacuum it
partition by partition.
On Tue, Feb 24, 2015 at 6:42 AM, Sergey Shchukin
<shchukin.s.a@gmail.com <mailto:shchukin.s.a@gmail.com>> wrote:
Hi all!
May someone help me with the issue in the apply process on the
replica. We have a stream replication and after vacuum stops
working with a big table we get a "freeze" in applying data on the
replica database. It looks like this:
Tue Feb 24 15:04:51 MSK 2015 Stream:
MASTER-masterdb:79607136410456 SLAVE:79607136410456
Replay:79607136339456 :: REPLAY 69 KBytes (00:00:00.294485 seconds)
Tue Feb 24 15:04:52 MSK 2015 Stream:
MASTER-masterdb:79607137892672 SLAVE:79607137715392
Replay:79607137715392 :: REPLAY 173 KBytes (00:00:00.142605 seconds)
Tue Feb 24 15:04:53 MSK 2015 Stream:
MASTER-masterdb:79607139327776 SLAVE:79607139241816
Replay:79607139241816 :: REPLAY 84 KBytes (00:00:00.05223 seconds)
Tue Feb 24 15:04:54 MSK 2015 Stream:
MASTER-masterdb:79607141134776 SLAVE:79607141073344
Replay:79607141080032 :: REPLAY 54 KBytes (00:00:00.010603 seconds)
Tue Feb 24 15:04:55 MSK 2015 Stream:
MASTER-masterdb:79607143085176 SLAVE:79607143026440
Replay:79607143038040 :: REPLAY 46 KBytes (00:00:00.009506 seconds)
Tue Feb 24 15:04:56 MSK 2015 Stream:
MASTER-masterdb:79607145111280 SLAVE:79607145021384
Replay:79607145025664 :: REPLAY 83 KBytes (00:00:00.006795 seconds)
Tue Feb 24 15:04:57 MSK 2015 Stream:
MASTER-masterdb:79607146564424 SLAVE:79607146478336
Replay:79607146501264 :: REPLAY 61 KBytes (00:00:00.00701 seconds)
Tue Feb 24 15:04:58 MSK 2015 Stream:
MASTER-masterdb:79607148160680 SLAVE:79607148108352
Replay:79607147369320 :: REPLAY 773 KBytes (00:00:00.449702 seconds)
Tue Feb 24 15:04:59 MSK 2015 Stream:
MASTER-masterdb:79607150220688 SLAVE:79607150159632
Replay:79607150171312 :: REPLAY 48 KBytes (00:00:00.006594 seconds)
Tue Feb 24 15:05:00 MSK 2015 Stream:
MASTER-masterdb:79607152365360 SLAVE:79607152262696
Replay:79607152285240 :: REPLAY 78 KBytes (00:00:00.007042 seconds)
Tue Feb 24 15:05:02 MSK 2015 Stream:
MASTER-masterdb:79607154049848 SLAVE:79607154012624
Replay:79607153446800 :: REPLAY 589 KBytes (00:00:00.513637 seconds)
Tue Feb 24 15:05:03 MSK 2015 Stream:
MASTER-masterdb:79607155229992 SLAVE:79607155187864
Replay:79607155188312 :: REPLAY 41 KBytes (00:00:00.004773 seconds)
Tue Feb 24 15:05:04 MSK 2015 Stream:
MASTER-masterdb:79607156833968 SLAVE:79607156764128
Replay:79607156785488 :: REPLAY 47 KBytes (00:00:00.006846 seconds)
Tue Feb 24 15:05:05 MSK 2015 Stream:
MASTER-masterdb:79607158419848 SLAVE:79607158344856
Replay:79607158396352 :: REPLAY 23 KBytes (00:00:00.005228 seconds)
Tue Feb 24 15:05:06 MSK 2015 Stream:
MASTER-masterdb:79607160004776 SLAVE:79607159962400
Replay:79607159988888 :: REPLAY 16 KBytes (00:00:00.003162 seconds)
*--here apply process just stops*
Tue Feb 24 15:05:07 MSK 2015 Stream:
MASTER-masterdb:79607161592048 SLAVE:79607161550576
Replay:79607160986064 :: REPLAY 592 KBytes (00:00:00.398376 seconds)
Tue Feb 24 15:05:08 MSK 2015 Stream:
MASTER-masterdb:79607163272840 SLAVE:79607163231384
Replay:79607160986064 :: REPLAY 2233 KBytes (00:00:01.446759 seconds)
Tue Feb 24 15:05:09 MSK 2015 Stream:
MASTER-masterdb:79607164958632 SLAVE:79607164904448
Replay:79607160986064 :: REPLAY 3879 KBytes (00:00:02.497181 seconds)
Tue Feb 24 15:05:10 MSK 2015 Stream:
MASTER-masterdb:79607166819560 SLAVE:79607166777712
Replay:79607160986064 :: REPLAY 5697 KBytes (00:00:03.543107 seconds)
Tue Feb 24 15:05:11 MSK 2015 Stream:
MASTER-masterdb:79607168595280 SLAVE:79607168566536
Replay:79607160986064 :: REPLAY 7431 KBytes (00:00:04.589736 seconds)
Tue Feb 24 15:05:12 MSK 2015 Stream:
MASTER-masterdb:79607170372064 SLAVE:79607170252480
Replay:79607160986064 :: REPLAY 9166 KBytes (00:00:05.635918 seconds)
Tue Feb 24 15:05:13 MSK 2015 Stream:
MASTER-masterdb:79607171829480 SLAVE:79607171714144
Replay:79607160986064 :: REPLAY 10589 KBytes (00:00:06.688115 seconds)
Tue Feb 24 15:05:14 MSK 2015 Stream:
MASTER-masterdb:79607173152488 SLAVE:79607173152488
Replay:79607160986064 :: REPLAY 11881 KBytes (00:00:07.736993 seconds)
Tue Feb 24 15:05:15 MSK 2015 Stream:
MASTER-masterdb:79607174149968 SLAVE:79607174149968
Replay:79607160986064 :: REPLAY 12855 KBytes (00:00:08.78538 seconds)
Tue Feb 24 15:05:16 MSK 2015 Stream:
MASTER-masterdb:79607176448344 SLAVE:79607176252088
Replay:79607160986064 :: REPLAY 15100 KBytes (00:00:09.835184 seconds)
Tue Feb 24 15:05:17 MSK 2015 Stream:
MASTER-masterdb:79607177632216 SLAVE:79607177608224
Replay:79607160986064 :: REPLAY 16256 KBytes (00:00:10.926493 seconds)
Tue Feb 24 15:05:18 MSK 2015 Stream:
MASTER-masterdb:79607179432960 SLAVE:79607179378096
Replay:79607160986064 :: REPLAY 18015 KBytes (00:00:11.97989 seconds)
Tue Feb 24 15:05:19 MSK 2015 Stream:
MASTER-masterdb:79607180893384 SLAVE:79607180874256
Replay:79607160986064 :: REPLAY 19441 KBytes (00:00:13.028921 seconds)
Tue Feb 24 15:05:20 MSK 2015 Stream:
MASTER-masterdb:79607182596224 SLAVE:79607182552272
Replay:79607160986064 :: REPLAY 21104 KBytes (00:00:14.079497 seconds)
Tue Feb 24 15:05:21 MSK 2015 Stream:
MASTER-masterdb:79607183935312 SLAVE:79607183902592
Replay:79607160986064 :: REPLAY 22411 KBytes (00:00:15.127679 seconds)
Tue Feb 24 15:05:23 MSK 2015 Stream:
MASTER-masterdb:79607185165880 SLAVE:79607185094032
Replay:79607160986064 :: REPLAY 23613 KBytes (00:00:16.175132 seconds)
Tue Feb 24 15:05:24 MSK 2015 Stream:
MASTER-masterdb:79607187196920 SLAVE:79607187169368
Replay:79607160986064 :: REPLAY 25596 KBytes (00:00:17.221981 seconds)
Tue Feb 24 15:05:25 MSK 2015 Stream:
MASTER-masterdb:79607188943856 SLAVE:79607188885952
Replay:79607160986064 :: REPLAY 27302 KBytes (00:00:18.274362 seconds)
Tue Feb 24 15:05:26 MSK 2015 Stream:
MASTER-masterdb:79607190489400 SLAVE:79607190443160
Replay:79607160986064 :: REPLAY 28812 KBytes (00:00:19.319987 seconds)
Tue Feb 24 15:05:27 MSK 2015 Stream:
MASTER-masterdb:79607192089312 SLAVE:79607192054048
Replay:79607160986064 :: REPLAY 30374 KBytes (00:00:20.372305 seconds)
Tue Feb 24 15:05:28 MSK 2015 Stream:
MASTER-masterdb:79607193736800 SLAVE:79607193690056
Replay:79607160986064 :: REPLAY 31983 KBytes (00:00:21.421359 seconds)
Tue Feb 24 15:05:29 MSK 2015 Stream:
MASTER-masterdb:79607195968648 SLAVE:79607195901296
Replay:79607160986064 :: REPLAY 34163 KBytes (00:00:22.471334 seconds)
Tue Feb 24 15:05:30 MSK 2015 Stream:
MASTER-masterdb:79607197808840 SLAVE:79607197737720
Replay:79607160986064 :: REPLAY 35960 KBytes (00:00:23.52269 seconds)
Tue Feb 24 15:05:31 MSK 2015 Stream:
MASTER-masterdb:79607199571144 SLAVE:79607199495976
Replay:79607160986064 :: REPLAY 37681 KBytes (00:00:24.577615 seconds)
Tue Feb 24 15:05:32 MSK 2015 Stream:
MASTER-masterdb:79607201206104 SLAVE:79607201100392
Replay:79607160986064 :: REPLAY 39277 KBytes (00:00:25.624604 seconds)
Tue Feb 24 15:05:33 MSK 2015 Stream:
MASTER-masterdb:79607203174208 SLAVE:79607203111136
Replay:79607160986064 :: REPLAY 41199 KBytes (00:00:26.67059 seconds)
Tue Feb 24 15:05:34 MSK 2015 Stream:
MASTER-masterdb:79607204792888 SLAVE:79607204741600
Replay:79607160986064 :: REPLAY 42780 KBytes (00:00:27.719088 seconds)
Tue Feb 24 15:05:35 MSK 2015 Stream:
MASTER-masterdb:79607206453216 SLAVE:79607206409032
Replay:79607160986064 :: REPLAY 44401 KBytes (00:00:28.766647 seconds)
Tue Feb 24 15:05:36 MSK 2015 Stream:
MASTER-masterdb:79607208225344 SLAVE:79607208142176
Replay:79607160986064 :: REPLAY 46132 KBytes (00:00:29.811434 seconds)
perf shows the following functions on the top
+ 22.50% postmaster [kernel.kallsyms] [k] copy_user_generic_string
+ 8.48% postmaster postgres [.]
hash_search_with_hash_value
after 10 minutes or so the apply process continue to work
Tue Feb 24 15:13:25 MSK 2015 Stream:
MASTER-masterdb:79608758742560 SLAVE:79608758718008
Replay:79607160986064 :: REPLAY 1560309 KBytes (00:08:19.009653
seconds)
Tue Feb 24 15:13:26 MSK 2015 Stream:
MASTER-masterdb:79608759203608 SLAVE:79608759189680
Replay:79607160986064 :: REPLAY 1560759 KBytes (00:08:20.057877
seconds)
Tue Feb 24 15:13:27 MSK 2015 Stream:
MASTER-masterdb:79608759639680 SLAVE:79608759633224
Replay:79607160986064 :: REPLAY 1561185 KBytes (00:08:21.104723
seconds)
Tue Feb 24 15:13:28 MSK 2015 Stream:
MASTER-masterdb:79608760271200 SLAVE:79608760264128
Replay:79607160986064 :: REPLAY 1561802 KBytes (00:08:22.148546
seconds)
Tue Feb 24 15:13:30 MSK 2015 Stream:
MASTER-masterdb:79608760622920 SLAVE:79608760616656
Replay:79607160986064 :: REPLAY 1562145 KBytes (00:08:23.196645
seconds)
Tue Feb 24 15:13:31 MSK 2015 Stream:
MASTER-masterdb:79608761122040 SLAVE:79608761084584
Replay:79607160986064 :: REPLAY 1562633 KBytes (00:08:24.240653
seconds)
Tue Feb 24 15:13:32 MSK 2015 Stream:
MASTER-masterdb:79608761434200 SLAVE:79608761426080
Replay:79607160986064 :: REPLAY 1562938 KBytes (00:08:25.289429
seconds)
Tue Feb 24 15:13:33 MSK 2015 Stream:
MASTER-masterdb:79608761931008 SLAVE:79608761904808
Replay:79607160986064 :: REPLAY 1563423 KBytes (00:08:26.338498
seconds)
*--apply starts*
Tue Feb 24 15:13:34 MSK 2015 Stream:
MASTER-masterdb:79608762360568 SLAVE:79608762325712
Replay:79607163554680 :: REPLAY 1561334 KBytes (00:08:25.702423
seconds)
Tue Feb 24 15:13:35 MSK 2015 Stream:
MASTER-masterdb:79608762891224 SLAVE:79608762885928
Replay:79607166466488 :: REPLAY 1559008 KBytes (00:08:25.011046
seconds)
Tue Feb 24 15:13:36 MSK 2015 Stream:
MASTER-masterdb:79608763681920 SLAVE:79608763667256
Replay:79607167054056 :: REPLAY 1559207 KBytes (00:08:25.827531
seconds)
Tue Feb 24 15:13:37 MSK 2015 Stream:
MASTER-masterdb:79608764207088 SLAVE:79608764197744
Replay:79607175610296 :: REPLAY 1551364 KBytes (00:08:21.182428
seconds)
Tue Feb 24 15:13:38 MSK 2015 Stream:
MASTER-masterdb:79608764857920 SLAVE:79608764832432
Replay:79607183599632 :: REPLAY 1544197 KBytes (00:08:16.742467
seconds)
Tue Feb 24 15:13:39 MSK 2015 Stream:
MASTER-masterdb:79608765323360 SLAVE:79608765281408
Replay:79607186862176 :: REPLAY 1541466 KBytes (00:08:15.569874
seconds)
Tue Feb 24 15:13:40 MSK 2015 Stream:
MASTER-masterdb:79608765848240 SLAVE:79608765824520
Replay:79607186862176 :: REPLAY 1541978 KBytes (00:08:16.620932
seconds)
All this is a result of completion of "vacuum verbose analyze
master_table" on the master site
Any help would be appreciated
--
Best regards,
Sergey Shchukin
--
*Radovan Jablonovsky* | SaaS DBA | Phone 1-403-262-6519 (ext. 7256) |
Fax 1-403-233-8046
The version is PostgreSQL 9.3.6 on x86_64 RHEL 6.6
show max_standby_streaming_delay;
max_standby_streaming_delay
-----------------------------
30s
-
Best regards,
Sergey Shchukin
27.02.2015 14:11, Sergey Shchukin пишет:
27.02.2015 11:52, Jim Nasby пишет:On 2/26/15 12:25 AM, Sergey Shchukin wrote:Hi Jim,Hi Radovan !
Thank you for the reply. The question is that this table is not a
subject for a massive updates/deletes.
Is there any additional traces except from perf or pg_top to trace what
replica is doing at the particular moment when we are lagging in replay?
To see locks or spins or sleeps etc..
Please don't top-post.
What version is this? What is max_standby_streaming_delay set to?Thank you!
-
Best regards,
Sergey Shchukin
24.02.2015 19:05, Radovan Jablonovsky пишет:This looks like more issue for pgsql-general mailing list.
Possible solutions
1) Set specific autovacuum parameters on the big table. The autovacuum
could vacuum table on multiple runs based on the thresholds and cost
settings
Example of setting specific values of autovacuum and analyze for
table. It should be adjusted for your system, work load, table usage, etc:
alter table "my_schema"."my_big_table" set (fillfactor = 80,
autovacuum_enabled = true, autovacuum_vacuum_threshold = 200,
autovacuum_analyze_threshold = 400, autovacuum_vacuum_scale_factor =
0.05, autovacuum_analyze_scale_factor = 0.005,
autovacuum_vacuum_cost_delay = 10, autovacuum_vacuum_cost_limit = 5000);
2) Could be to partition the large table on master site and vacuum it
partition by partition.
On Tue, Feb 24, 2015 at 6:42 AM, Sergey Shchukin
<shchukin.s.a@gmail.com <mailto:shchukin.s.a@gmail.com>> wrote:
Hi all!
May someone help me with the issue in the apply process on the
replica. We have a stream replication and after vacuum stops
working with a big table we get a "freeze" in applying data on the
replica database. It looks like this:
Tue Feb 24 15:04:51 MSK 2015 Stream:
MASTER-masterdb:79607136410456 SLAVE:79607136410456
Replay:79607136339456 :: REPLAY 69 KBytes (00:00:00.294485 seconds)
Tue Feb 24 15:04:52 MSK 2015 Stream:
MASTER-masterdb:79607137892672 SLAVE:79607137715392
Replay:79607137715392 :: REPLAY 173 KBytes (00:00:00.142605 seconds)
Tue Feb 24 15:04:53 MSK 2015 Stream:
MASTER-masterdb:79607139327776 SLAVE:79607139241816
Replay:79607139241816 :: REPLAY 84 KBytes (00:00:00.05223 seconds)
Tue Feb 24 15:04:54 MSK 2015 Stream:
MASTER-masterdb:79607141134776 SLAVE:79607141073344
Replay:79607141080032 :: REPLAY 54 KBytes (00:00:00.010603 seconds)
Tue Feb 24 15:04:55 MSK 2015 Stream:
MASTER-masterdb:79607143085176 SLAVE:79607143026440
Replay:79607143038040 :: REPLAY 46 KBytes (00:00:00.009506 seconds)
Tue Feb 24 15:04:56 MSK 2015 Stream:
MASTER-masterdb:79607145111280 SLAVE:79607145021384
Replay:79607145025664 :: REPLAY 83 KBytes (00:00:00.006795 seconds)
Tue Feb 24 15:04:57 MSK 2015 Stream:
MASTER-masterdb:79607146564424 SLAVE:79607146478336
Replay:79607146501264 :: REPLAY 61 KBytes (00:00:00.00701 seconds)
Tue Feb 24 15:04:58 MSK 2015 Stream:
MASTER-masterdb:79607148160680 SLAVE:79607148108352
Replay:79607147369320 :: REPLAY 773 KBytes (00:00:00.449702 seconds)
Tue Feb 24 15:04:59 MSK 2015 Stream:
MASTER-masterdb:79607150220688 SLAVE:79607150159632
Replay:79607150171312 :: REPLAY 48 KBytes (00:00:00.006594 seconds)
Tue Feb 24 15:05:00 MSK 2015 Stream:
MASTER-masterdb:79607152365360 SLAVE:79607152262696
Replay:79607152285240 :: REPLAY 78 KBytes (00:00:00.007042 seconds)
Tue Feb 24 15:05:02 MSK 2015 Stream:
MASTER-masterdb:79607154049848 SLAVE:79607154012624
Replay:79607153446800 :: REPLAY 589 KBytes (00:00:00.513637 seconds)
Tue Feb 24 15:05:03 MSK 2015 Stream:
MASTER-masterdb:79607155229992 SLAVE:79607155187864
Replay:79607155188312 :: REPLAY 41 KBytes (00:00:00.004773 seconds)
Tue Feb 24 15:05:04 MSK 2015 Stream:
MASTER-masterdb:79607156833968 SLAVE:79607156764128
Replay:79607156785488 :: REPLAY 47 KBytes (00:00:00.006846 seconds)
Tue Feb 24 15:05:05 MSK 2015 Stream:
MASTER-masterdb:79607158419848 SLAVE:79607158344856
Replay:79607158396352 :: REPLAY 23 KBytes (00:00:00.005228 seconds)
Tue Feb 24 15:05:06 MSK 2015 Stream:
MASTER-masterdb:79607160004776 SLAVE:79607159962400
Replay:79607159988888 :: REPLAY 16 KBytes (00:00:00.003162 seconds)
*--here apply process just stops*
Tue Feb 24 15:05:07 MSK 2015 Stream:
MASTER-masterdb:79607161592048 SLAVE:79607161550576
Replay:79607160986064 :: REPLAY 592 KBytes (00:00:00.398376 seconds)
Tue Feb 24 15:05:08 MSK 2015 Stream:
MASTER-masterdb:79607163272840 SLAVE:79607163231384
Replay:79607160986064 :: REPLAY 2233 KBytes (00:00:01.446759 seconds)
Tue Feb 24 15:05:09 MSK 2015 Stream:
MASTER-masterdb:79607164958632 SLAVE:79607164904448
Replay:79607160986064 :: REPLAY 3879 KBytes (00:00:02.497181 seconds)
Tue Feb 24 15:05:10 MSK 2015 Stream:
MASTER-masterdb:79607166819560 SLAVE:79607166777712
Replay:79607160986064 :: REPLAY 5697 KBytes (00:00:03.543107 seconds)
Tue Feb 24 15:05:11 MSK 2015 Stream:
MASTER-masterdb:79607168595280 SLAVE:79607168566536
Replay:79607160986064 :: REPLAY 7431 KBytes (00:00:04.589736 seconds)
Tue Feb 24 15:05:12 MSK 2015 Stream:
MASTER-masterdb:79607170372064 SLAVE:79607170252480
Replay:79607160986064 :: REPLAY 9166 KBytes (00:00:05.635918 seconds)
Tue Feb 24 15:05:13 MSK 2015 Stream:
MASTER-masterdb:79607171829480 SLAVE:79607171714144
Replay:79607160986064 :: REPLAY 10589 KBytes (00:00:06.688115 seconds)
Tue Feb 24 15:05:14 MSK 2015 Stream:
MASTER-masterdb:79607173152488 SLAVE:79607173152488
Replay:79607160986064 :: REPLAY 11881 KBytes (00:00:07.736993 seconds)
Tue Feb 24 15:05:15 MSK 2015 Stream:
MASTER-masterdb:79607174149968 SLAVE:79607174149968
Replay:79607160986064 :: REPLAY 12855 KBytes (00:00:08.78538 seconds)
Tue Feb 24 15:05:16 MSK 2015 Stream:
MASTER-masterdb:79607176448344 SLAVE:79607176252088
Replay:79607160986064 :: REPLAY 15100 KBytes (00:00:09.835184 seconds)
Tue Feb 24 15:05:17 MSK 2015 Stream:
MASTER-masterdb:79607177632216 SLAVE:79607177608224
Replay:79607160986064 :: REPLAY 16256 KBytes (00:00:10.926493 seconds)
Tue Feb 24 15:05:18 MSK 2015 Stream:
MASTER-masterdb:79607179432960 SLAVE:79607179378096
Replay:79607160986064 :: REPLAY 18015 KBytes (00:00:11.97989 seconds)
Tue Feb 24 15:05:19 MSK 2015 Stream:
MASTER-masterdb:79607180893384 SLAVE:79607180874256
Replay:79607160986064 :: REPLAY 19441 KBytes (00:00:13.028921 seconds)
Tue Feb 24 15:05:20 MSK 2015 Stream:
MASTER-masterdb:79607182596224 SLAVE:79607182552272
Replay:79607160986064 :: REPLAY 21104 KBytes (00:00:14.079497 seconds)
Tue Feb 24 15:05:21 MSK 2015 Stream:
MASTER-masterdb:79607183935312 SLAVE:79607183902592
Replay:79607160986064 :: REPLAY 22411 KBytes (00:00:15.127679 seconds)
Tue Feb 24 15:05:23 MSK 2015 Stream:
MASTER-masterdb:79607185165880 SLAVE:79607185094032
Replay:79607160986064 :: REPLAY 23613 KBytes (00:00:16.175132 seconds)
Tue Feb 24 15:05:24 MSK 2015 Stream:
MASTER-masterdb:79607187196920 SLAVE:79607187169368
Replay:79607160986064 :: REPLAY 25596 KBytes (00:00:17.221981 seconds)
Tue Feb 24 15:05:25 MSK 2015 Stream:
MASTER-masterdb:79607188943856 SLAVE:79607188885952
Replay:79607160986064 :: REPLAY 27302 KBytes (00:00:18.274362 seconds)
Tue Feb 24 15:05:26 MSK 2015 Stream:
MASTER-masterdb:79607190489400 SLAVE:79607190443160
Replay:79607160986064 :: REPLAY 28812 KBytes (00:00:19.319987 seconds)
Tue Feb 24 15:05:27 MSK 2015 Stream:
MASTER-masterdb:79607192089312 SLAVE:79607192054048
Replay:79607160986064 :: REPLAY 30374 KBytes (00:00:20.372305 seconds)
Tue Feb 24 15:05:28 MSK 2015 Stream:
MASTER-masterdb:79607193736800 SLAVE:79607193690056
Replay:79607160986064 :: REPLAY 31983 KBytes (00:00:21.421359 seconds)
Tue Feb 24 15:05:29 MSK 2015 Stream:
MASTER-masterdb:79607195968648 SLAVE:79607195901296
Replay:79607160986064 :: REPLAY 34163 KBytes (00:00:22.471334 seconds)
Tue Feb 24 15:05:30 MSK 2015 Stream:
MASTER-masterdb:79607197808840 SLAVE:79607197737720
Replay:79607160986064 :: REPLAY 35960 KBytes (00:00:23.52269 seconds)
Tue Feb 24 15:05:31 MSK 2015 Stream:
MASTER-masterdb:79607199571144 SLAVE:79607199495976
Replay:79607160986064 :: REPLAY 37681 KBytes (00:00:24.577615 seconds)
Tue Feb 24 15:05:32 MSK 2015 Stream:
MASTER-masterdb:79607201206104 SLAVE:79607201100392
Replay:79607160986064 :: REPLAY 39277 KBytes (00:00:25.624604 seconds)
Tue Feb 24 15:05:33 MSK 2015 Stream:
MASTER-masterdb:79607203174208 SLAVE:79607203111136
Replay:79607160986064 :: REPLAY 41199 KBytes (00:00:26.67059 seconds)
Tue Feb 24 15:05:34 MSK 2015 Stream:
MASTER-masterdb:79607204792888 SLAVE:79607204741600
Replay:79607160986064 :: REPLAY 42780 KBytes (00:00:27.719088 seconds)
Tue Feb 24 15:05:35 MSK 2015 Stream:
MASTER-masterdb:79607206453216 SLAVE:79607206409032
Replay:79607160986064 :: REPLAY 44401 KBytes (00:00:28.766647 seconds)
Tue Feb 24 15:05:36 MSK 2015 Stream:
MASTER-masterdb:79607208225344 SLAVE:79607208142176
Replay:79607160986064 :: REPLAY 46132 KBytes (00:00:29.811434 seconds)
perf shows the following functions on the top
+ 22.50% postmaster [kernel.kallsyms] [k] copy_user_generic_string
+ 8.48% postmaster postgres [.]
hash_search_with_hash_value
after 10 minutes or so the apply process continue to work
Tue Feb 24 15:13:25 MSK 2015 Stream:
MASTER-masterdb:79608758742560 SLAVE:79608758718008
Replay:79607160986064 :: REPLAY 1560309 KBytes (00:08:19.009653
seconds)
Tue Feb 24 15:13:26 MSK 2015 Stream:
MASTER-masterdb:79608759203608 SLAVE:79608759189680
Replay:79607160986064 :: REPLAY 1560759 KBytes (00:08:20.057877
seconds)
Tue Feb 24 15:13:27 MSK 2015 Stream:
MASTER-masterdb:79608759639680 SLAVE:79608759633224
Replay:79607160986064 :: REPLAY 1561185 KBytes (00:08:21.104723
seconds)
Tue Feb 24 15:13:28 MSK 2015 Stream:
MASTER-masterdb:79608760271200 SLAVE:79608760264128
Replay:79607160986064 :: REPLAY 1561802 KBytes (00:08:22.148546
seconds)
Tue Feb 24 15:13:30 MSK 2015 Stream:
MASTER-masterdb:79608760622920 SLAVE:79608760616656
Replay:79607160986064 :: REPLAY 1562145 KBytes (00:08:23.196645
seconds)
Tue Feb 24 15:13:31 MSK 2015 Stream:
MASTER-masterdb:79608761122040 SLAVE:79608761084584
Replay:79607160986064 :: REPLAY 1562633 KBytes (00:08:24.240653
seconds)
Tue Feb 24 15:13:32 MSK 2015 Stream:
MASTER-masterdb:79608761434200 SLAVE:79608761426080
Replay:79607160986064 :: REPLAY 1562938 KBytes (00:08:25.289429
seconds)
Tue Feb 24 15:13:33 MSK 2015 Stream:
MASTER-masterdb:79608761931008 SLAVE:79608761904808
Replay:79607160986064 :: REPLAY 1563423 KBytes (00:08:26.338498
seconds)
*--apply starts*
Tue Feb 24 15:13:34 MSK 2015 Stream:
MASTER-masterdb:79608762360568 SLAVE:79608762325712
Replay:79607163554680 :: REPLAY 1561334 KBytes (00:08:25.702423
seconds)
Tue Feb 24 15:13:35 MSK 2015 Stream:
MASTER-masterdb:79608762891224 SLAVE:79608762885928
Replay:79607166466488 :: REPLAY 1559008 KBytes (00:08:25.011046
seconds)
Tue Feb 24 15:13:36 MSK 2015 Stream:
MASTER-masterdb:79608763681920 SLAVE:79608763667256
Replay:79607167054056 :: REPLAY 1559207 KBytes (00:08:25.827531
seconds)
Tue Feb 24 15:13:37 MSK 2015 Stream:
MASTER-masterdb:79608764207088 SLAVE:79608764197744
Replay:79607175610296 :: REPLAY 1551364 KBytes (00:08:21.182428
seconds)
Tue Feb 24 15:13:38 MSK 2015 Stream:
MASTER-masterdb:79608764857920 SLAVE:79608764832432
Replay:79607183599632 :: REPLAY 1544197 KBytes (00:08:16.742467
seconds)
Tue Feb 24 15:13:39 MSK 2015 Stream:
MASTER-masterdb:79608765323360 SLAVE:79608765281408
Replay:79607186862176 :: REPLAY 1541466 KBytes (00:08:15.569874
seconds)
Tue Feb 24 15:13:40 MSK 2015 Stream:
MASTER-masterdb:79608765848240 SLAVE:79608765824520
Replay:79607186862176 :: REPLAY 1541978 KBytes (00:08:16.620932
seconds)
All this is a result of completion of "vacuum verbose analyze
master_table" on the master site
Any help would be appreciated
--
Best regards,
Sergey Shchukin
--
*Radovan Jablonovsky* | SaaS DBA | Phone 1-403-262-6519 (ext. 7256) |
Fax 1-403-233-8046
The version is PostgreSQL 9.3.6 on x86_64 RHEL 6.6
show max_standby_streaming_delay;
max_standby_streaming_delay
-----------------------------
30s
Again, after the vacuum finished on my table I got locks in apply process on replica - see lag_byte
masterdb01d/masterdb M # vacuum verbose rtable.rtable_uidl;
INFO: 00000: vacuuming "rtable.rtable_uidl"
LOCATION: lazy_scan_heap, vacuumlazy.c:438
INFO: 00000: scanned index "pk_rtable_uidl" to remove 6 row versions
DETAIL: CPU 240.80s/183.19u sec elapsed 703.85 sec.
LOCATION: lazy_vacuum_index, vacuumlazy.c:1335
INFO: 00000: "rtable_uidl": removed 6 row versions in 6 pages
DETAIL: CPU 0.00s/0.00u sec elapsed 0.00 sec.
LOCATION: lazy_vacuum_heap, vacuumlazy.c:1169
INFO: 00000: index "pk_rtable_uidl" now contains 3763411079 row versions in 32755911 pages
DETAIL: 0 index row versions were removed.
0 index pages have been deleted, 0 are currently reusable.
CPU 0.00s/0.00u sec elapsed 0.00 sec.
LOCATION: lazy_cleanup_index, vacuumlazy.c:1387
INFO: 00000: "rtable_uidl": found 6 removable, 1426488 nonremovable row versions in 12734 out of 26047416 pages
DETAIL: 0 dead row versions cannot be removed yet.
There were 3 unused item pointers.
0 pages are entirely empty.
CPU 241.37s/184.04u sec elapsed 705.45 sec.
LOCATION: lazy_scan_heap, vacuumlazy.c:1101
VACUUM
Time: 705685.954 ms
masterdb01d/postgres M # \g
-[ RECORD 1 ]----+------------------------------
procpid | 21487
usesysid | 16413
usename | repl
application_name | walreceiver
client_addr |
client_hostname | masterdb01e
client_port | 35261
backend_start | 2015-02-27 13:02:27.203938+03
state | streaming
sent_location | 494B/CB30B530
write_location | 494B/CB30B530
flush_location | 494B/CB30B530
replay_location | 494B/A02B9070 <<< stopped here!1
sync_priority | 0
sync_state | async
total_lag_byte | 721757376
total_lag_nice | 688 MB
lag_byte | 721757376
lag_byte_nice | 688 MB
--
Best regards,
Sergey Shchukin
27.02.2015 14:42, Sergey Shchukin пишет:
27.02.2015 14:11, Sergey Shchukin пишет:27.02.2015 11:52, Jim Nasby пишет:On 2/26/15 12:25 AM, Sergey Shchukin wrote:Hi Jim,Hi Radovan !
Thank you for the reply. The question is that this table is not a
subject for a massive updates/deletes.
Is there any additional traces except from perf or pg_top to trace what
replica is doing at the particular moment when we are lagging in replay?
To see locks or spins or sleeps etc..
Please don't top-post.
What version is this? What is max_standby_streaming_delay set to?Thank you!
-
Best regards,
Sergey Shchukin
24.02.2015 19:05, Radovan Jablonovsky пишет:This looks like more issue for pgsql-general mailing list.
Possible solutions
1) Set specific autovacuum parameters on the big table. The autovacuum
could vacuum table on multiple runs based on the thresholds and cost
settings
Example of setting specific values of autovacuum and analyze for
table. It should be adjusted for your system, work load, table usage, etc:
alter table "my_schema"."my_big_table" set (fillfactor = 80,
autovacuum_enabled = true, autovacuum_vacuum_threshold = 200,
autovacuum_analyze_threshold = 400, autovacuum_vacuum_scale_factor =
0.05, autovacuum_analyze_scale_factor = 0.005,
autovacuum_vacuum_cost_delay = 10, autovacuum_vacuum_cost_limit = 5000);
2) Could be to partition the large table on master site and vacuum it
partition by partition.
On Tue, Feb 24, 2015 at 6:42 AM, Sergey Shchukin
<shchukin.s.a@gmail.com <mailto:shchukin.s.a@gmail.com>> wrote:
Hi all!
May someone help me with the issue in the apply process on the
replica. We have a stream replication and after vacuum stops
working with a big table we get a "freeze" in applying data on the
replica database. It looks like this:
Tue Feb 24 15:04:51 MSK 2015 Stream:
MASTER-masterdb:79607136410456 SLAVE:79607136410456
Replay:79607136339456 :: REPLAY 69 KBytes (00:00:00.294485 seconds)
Tue Feb 24 15:04:52 MSK 2015 Stream:
MASTER-masterdb:79607137892672 SLAVE:79607137715392
Replay:79607137715392 :: REPLAY 173 KBytes (00:00:00.142605 seconds)
Tue Feb 24 15:04:53 MSK 2015 Stream:
MASTER-masterdb:79607139327776 SLAVE:79607139241816
Replay:79607139241816 :: REPLAY 84 KBytes (00:00:00.05223 seconds)
Tue Feb 24 15:04:54 MSK 2015 Stream:
MASTER-masterdb:79607141134776 SLAVE:79607141073344
Replay:79607141080032 :: REPLAY 54 KBytes (00:00:00.010603 seconds)
Tue Feb 24 15:04:55 MSK 2015 Stream:
MASTER-masterdb:79607143085176 SLAVE:79607143026440
Replay:79607143038040 :: REPLAY 46 KBytes (00:00:00.009506 seconds)
Tue Feb 24 15:04:56 MSK 2015 Stream:
MASTER-masterdb:79607145111280 SLAVE:79607145021384
Replay:79607145025664 :: REPLAY 83 KBytes (00:00:00.006795 seconds)
Tue Feb 24 15:04:57 MSK 2015 Stream:
MASTER-masterdb:79607146564424 SLAVE:79607146478336
Replay:79607146501264 :: REPLAY 61 KBytes (00:00:00.00701 seconds)
Tue Feb 24 15:04:58 MSK 2015 Stream:
MASTER-masterdb:79607148160680 SLAVE:79607148108352
Replay:79607147369320 :: REPLAY 773 KBytes (00:00:00.449702 seconds)
Tue Feb 24 15:04:59 MSK 2015 Stream:
MASTER-masterdb:79607150220688 SLAVE:79607150159632
Replay:79607150171312 :: REPLAY 48 KBytes (00:00:00.006594 seconds)
Tue Feb 24 15:05:00 MSK 2015 Stream:
MASTER-masterdb:79607152365360 SLAVE:79607152262696
Replay:79607152285240 :: REPLAY 78 KBytes (00:00:00.007042 seconds)
Tue Feb 24 15:05:02 MSK 2015 Stream:
MASTER-masterdb:79607154049848 SLAVE:79607154012624
Replay:79607153446800 :: REPLAY 589 KBytes (00:00:00.513637 seconds)
Tue Feb 24 15:05:03 MSK 2015 Stream:
MASTER-masterdb:79607155229992 SLAVE:79607155187864
Replay:79607155188312 :: REPLAY 41 KBytes (00:00:00.004773 seconds)
Tue Feb 24 15:05:04 MSK 2015 Stream:
MASTER-masterdb:79607156833968 SLAVE:79607156764128
Replay:79607156785488 :: REPLAY 47 KBytes (00:00:00.006846 seconds)
Tue Feb 24 15:05:05 MSK 2015 Stream:
MASTER-masterdb:79607158419848 SLAVE:79607158344856
Replay:79607158396352 :: REPLAY 23 KBytes (00:00:00.005228 seconds)
Tue Feb 24 15:05:06 MSK 2015 Stream:
MASTER-masterdb:79607160004776 SLAVE:79607159962400
Replay:79607159988888 :: REPLAY 16 KBytes (00:00:00.003162 seconds)
*--here apply process just stops*
Tue Feb 24 15:05:07 MSK 2015 Stream:
MASTER-masterdb:79607161592048 SLAVE:79607161550576
Replay:79607160986064 :: REPLAY 592 KBytes (00:00:00.398376 seconds)
Tue Feb 24 15:05:08 MSK 2015 Stream:
MASTER-masterdb:79607163272840 SLAVE:79607163231384
Replay:79607160986064 :: REPLAY 2233 KBytes (00:00:01.446759 seconds)
Tue Feb 24 15:05:09 MSK 2015 Stream:
MASTER-masterdb:79607164958632 SLAVE:79607164904448
Replay:79607160986064 :: REPLAY 3879 KBytes (00:00:02.497181 seconds)
Tue Feb 24 15:05:10 MSK 2015 Stream:
MASTER-masterdb:79607166819560 SLAVE:79607166777712
Replay:79607160986064 :: REPLAY 5697 KBytes (00:00:03.543107 seconds)
Tue Feb 24 15:05:11 MSK 2015 Stream:
MASTER-masterdb:79607168595280 SLAVE:79607168566536
Replay:79607160986064 :: REPLAY 7431 KBytes (00:00:04.589736 seconds)
Tue Feb 24 15:05:12 MSK 2015 Stream:
MASTER-masterdb:79607170372064 SLAVE:79607170252480
Replay:79607160986064 :: REPLAY 9166 KBytes (00:00:05.635918 seconds)
Tue Feb 24 15:05:13 MSK 2015 Stream:
MASTER-masterdb:79607171829480 SLAVE:79607171714144
Replay:79607160986064 :: REPLAY 10589 KBytes (00:00:06.688115 seconds)
Tue Feb 24 15:05:14 MSK 2015 Stream:
MASTER-masterdb:79607173152488 SLAVE:79607173152488
Replay:79607160986064 :: REPLAY 11881 KBytes (00:00:07.736993 seconds)
Tue Feb 24 15:05:15 MSK 2015 Stream:
MASTER-masterdb:79607174149968 SLAVE:79607174149968
Replay:79607160986064 :: REPLAY 12855 KBytes (00:00:08.78538 seconds)
Tue Feb 24 15:05:16 MSK 2015 Stream:
MASTER-masterdb:79607176448344 SLAVE:79607176252088
Replay:79607160986064 :: REPLAY 15100 KBytes (00:00:09.835184 seconds)
Tue Feb 24 15:05:17 MSK 2015 Stream:
MASTER-masterdb:79607177632216 SLAVE:79607177608224
Replay:79607160986064 :: REPLAY 16256 KBytes (00:00:10.926493 seconds)
Tue Feb 24 15:05:18 MSK 2015 Stream:
MASTER-masterdb:79607179432960 SLAVE:79607179378096
Replay:79607160986064 :: REPLAY 18015 KBytes (00:00:11.97989 seconds)
Tue Feb 24 15:05:19 MSK 2015 Stream:
MASTER-masterdb:79607180893384 SLAVE:79607180874256
Replay:79607160986064 :: REPLAY 19441 KBytes (00:00:13.028921 seconds)
Tue Feb 24 15:05:20 MSK 2015 Stream:
MASTER-masterdb:79607182596224 SLAVE:79607182552272
Replay:79607160986064 :: REPLAY 21104 KBytes (00:00:14.079497 seconds)
Tue Feb 24 15:05:21 MSK 2015 Stream:
MASTER-masterdb:79607183935312 SLAVE:79607183902592
Replay:79607160986064 :: REPLAY 22411 KBytes (00:00:15.127679 seconds)
Tue Feb 24 15:05:23 MSK 2015 Stream:
MASTER-masterdb:79607185165880 SLAVE:79607185094032
Replay:79607160986064 :: REPLAY 23613 KBytes (00:00:16.175132 seconds)
Tue Feb 24 15:05:24 MSK 2015 Stream:
MASTER-masterdb:79607187196920 SLAVE:79607187169368
Replay:79607160986064 :: REPLAY 25596 KBytes (00:00:17.221981 seconds)
Tue Feb 24 15:05:25 MSK 2015 Stream:
MASTER-masterdb:79607188943856 SLAVE:79607188885952
Replay:79607160986064 :: REPLAY 27302 KBytes (00:00:18.274362 seconds)
Tue Feb 24 15:05:26 MSK 2015 Stream:
MASTER-masterdb:79607190489400 SLAVE:79607190443160
Replay:79607160986064 :: REPLAY 28812 KBytes (00:00:19.319987 seconds)
Tue Feb 24 15:05:27 MSK 2015 Stream:
MASTER-masterdb:79607192089312 SLAVE:79607192054048
Replay:79607160986064 :: REPLAY 30374 KBytes (00:00:20.372305 seconds)
Tue Feb 24 15:05:28 MSK 2015 Stream:
MASTER-masterdb:79607193736800 SLAVE:79607193690056
Replay:79607160986064 :: REPLAY 31983 KBytes (00:00:21.421359 seconds)
Tue Feb 24 15:05:29 MSK 2015 Stream:
MASTER-masterdb:79607195968648 SLAVE:79607195901296
Replay:79607160986064 :: REPLAY 34163 KBytes (00:00:22.471334 seconds)
Tue Feb 24 15:05:30 MSK 2015 Stream:
MASTER-masterdb:79607197808840 SLAVE:79607197737720
Replay:79607160986064 :: REPLAY 35960 KBytes (00:00:23.52269 seconds)
Tue Feb 24 15:05:31 MSK 2015 Stream:
MASTER-masterdb:79607199571144 SLAVE:79607199495976
Replay:79607160986064 :: REPLAY 37681 KBytes (00:00:24.577615 seconds)
Tue Feb 24 15:05:32 MSK 2015 Stream:
MASTER-masterdb:79607201206104 SLAVE:79607201100392
Replay:79607160986064 :: REPLAY 39277 KBytes (00:00:25.624604 seconds)
Tue Feb 24 15:05:33 MSK 2015 Stream:
MASTER-masterdb:79607203174208 SLAVE:79607203111136
Replay:79607160986064 :: REPLAY 41199 KBytes (00:00:26.67059 seconds)
Tue Feb 24 15:05:34 MSK 2015 Stream:
MASTER-masterdb:79607204792888 SLAVE:79607204741600
Replay:79607160986064 :: REPLAY 42780 KBytes (00:00:27.719088 seconds)
Tue Feb 24 15:05:35 MSK 2015 Stream:
MASTER-masterdb:79607206453216 SLAVE:79607206409032
Replay:79607160986064 :: REPLAY 44401 KBytes (00:00:28.766647 seconds)
Tue Feb 24 15:05:36 MSK 2015 Stream:
MASTER-masterdb:79607208225344 SLAVE:79607208142176
Replay:79607160986064 :: REPLAY 46132 KBytes (00:00:29.811434 seconds)
perf shows the following functions on the top
+ 22.50% postmaster [kernel.kallsyms] [k] copy_user_generic_string
+ 8.48% postmaster postgres [.]
hash_search_with_hash_value
after 10 minutes or so the apply process continue to work
Tue Feb 24 15:13:25 MSK 2015 Stream:
MASTER-masterdb:79608758742560 SLAVE:79608758718008
Replay:79607160986064 :: REPLAY 1560309 KBytes (00:08:19.009653
seconds)
Tue Feb 24 15:13:26 MSK 2015 Stream:
MASTER-masterdb:79608759203608 SLAVE:79608759189680
Replay:79607160986064 :: REPLAY 1560759 KBytes (00:08:20.057877
seconds)
Tue Feb 24 15:13:27 MSK 2015 Stream:
MASTER-masterdb:79608759639680 SLAVE:79608759633224
Replay:79607160986064 :: REPLAY 1561185 KBytes (00:08:21.104723
seconds)
Tue Feb 24 15:13:28 MSK 2015 Stream:
MASTER-masterdb:79608760271200 SLAVE:79608760264128
Replay:79607160986064 :: REPLAY 1561802 KBytes (00:08:22.148546
seconds)
Tue Feb 24 15:13:30 MSK 2015 Stream:
MASTER-masterdb:79608760622920 SLAVE:79608760616656
Replay:79607160986064 :: REPLAY 1562145 KBytes (00:08:23.196645
seconds)
Tue Feb 24 15:13:31 MSK 2015 Stream:
MASTER-masterdb:79608761122040 SLAVE:79608761084584
Replay:79607160986064 :: REPLAY 1562633 KBytes (00:08:24.240653
seconds)
Tue Feb 24 15:13:32 MSK 2015 Stream:
MASTER-masterdb:79608761434200 SLAVE:79608761426080
Replay:79607160986064 :: REPLAY 1562938 KBytes (00:08:25.289429
seconds)
Tue Feb 24 15:13:33 MSK 2015 Stream:
MASTER-masterdb:79608761931008 SLAVE:79608761904808
Replay:79607160986064 :: REPLAY 1563423 KBytes (00:08:26.338498
seconds)
*--apply starts*
Tue Feb 24 15:13:34 MSK 2015 Stream:
MASTER-masterdb:79608762360568 SLAVE:79608762325712
Replay:79607163554680 :: REPLAY 1561334 KBytes (00:08:25.702423
seconds)
Tue Feb 24 15:13:35 MSK 2015 Stream:
MASTER-masterdb:79608762891224 SLAVE:79608762885928
Replay:79607166466488 :: REPLAY 1559008 KBytes (00:08:25.011046
seconds)
Tue Feb 24 15:13:36 MSK 2015 Stream:
MASTER-masterdb:79608763681920 SLAVE:79608763667256
Replay:79607167054056 :: REPLAY 1559207 KBytes (00:08:25.827531
seconds)
Tue Feb 24 15:13:37 MSK 2015 Stream:
MASTER-masterdb:79608764207088 SLAVE:79608764197744
Replay:79607175610296 :: REPLAY 1551364 KBytes (00:08:21.182428
seconds)
Tue Feb 24 15:13:38 MSK 2015 Stream:
MASTER-masterdb:79608764857920 SLAVE:79608764832432
Replay:79607183599632 :: REPLAY 1544197 KBytes (00:08:16.742467
seconds)
Tue Feb 24 15:13:39 MSK 2015 Stream:
MASTER-masterdb:79608765323360 SLAVE:79608765281408
Replay:79607186862176 :: REPLAY 1541466 KBytes (00:08:15.569874
seconds)
Tue Feb 24 15:13:40 MSK 2015 Stream:
MASTER-masterdb:79608765848240 SLAVE:79608765824520
Replay:79607186862176 :: REPLAY 1541978 KBytes (00:08:16.620932
seconds)
All this is a result of completion of "vacuum verbose analyze
master_table" on the master site
Any help would be appreciated
--
Best regards,
Sergey Shchukin
--
*Radovan Jablonovsky* | SaaS DBA | Phone 1-403-262-6519 (ext. 7256) |
Fax 1-403-233-8046
The version is PostgreSQL 9.3.6 on x86_64 RHEL 6.6
show max_standby_streaming_delay;
max_standby_streaming_delay
-----------------------------
30s
Again, after the vacuum finished on my table I got locks in apply process on replica - see lag_byte
masterdb01d/masterdb M # vacuum verbose rtable.rtable_uidl;
INFO: 00000: vacuuming "rtable.rtable_uidl"
LOCATION: lazy_scan_heap, vacuumlazy.c:438
INFO: 00000: scanned index "pk_rtable_uidl" to remove 6 row versions
DETAIL: CPU 240.80s/183.19u sec elapsed 703.85 sec.
LOCATION: lazy_vacuum_index, vacuumlazy.c:1335
INFO: 00000: "rtable_uidl": removed 6 row versions in 6 pages
DETAIL: CPU 0.00s/0.00u sec elapsed 0.00 sec.
LOCATION: lazy_vacuum_heap, vacuumlazy.c:1169
INFO: 00000: index "pk_rtable_uidl" now contains 3763411079 row versions in 32755911 pages
DETAIL: 0 index row versions were removed.
0 index pages have been deleted, 0 are currently reusable.
CPU 0.00s/0.00u sec elapsed 0.00 sec.
LOCATION: lazy_cleanup_index, vacuumlazy.c:1387
INFO: 00000: "rtable_uidl": found 6 removable, 1426488 nonremovable row versions in 12734 out of 26047416 pages
DETAIL: 0 dead row versions cannot be removed yet.
There were 3 unused item pointers.
0 pages are entirely empty.
CPU 241.37s/184.04u sec elapsed 705.45 sec.
LOCATION: lazy_scan_heap, vacuumlazy.c:1101
VACUUM
Time: 705685.954 ms
masterdb01d/postgres M # \g
-[ RECORD 1 ]----+------------------------------
procpid | 21487
usesysid | 16413
usename | repl
application_name | walreceiver
client_addr |
client_hostname | masterdb01e
client_port | 35261
backend_start | 2015-02-27 13:02:27.203938+03
state | streaming
sent_location | 494B/CB30B530
write_location | 494B/CB30B530
flush_location | 494B/CB30B530
replay_location | 494B/A02B9070 <<< stopped here!1
sync_priority | 0
sync_state | async
total_lag_byte | 721757376
total_lag_nice | 688 MB
lag_byte | 721757376
lag_byte_nice | 688 MB
--
Best regards,
Sergey Shchukin
Hi All!
The issue is repeating still...
Some updates:
The size of the rtable_uidl is about 3 773 185 761 rows, quite a big
Before vacuum
schema_size | schema_size_with_indexes
-------------+--------------------------
199 GB | 450 GB
rtabledb01e/rtabledb R # select * from pg_stat_all_tables where schemaname = 'rtable' and relname ='rtable_uidl';
-[ RECORD 1 ]-----+-----------
relid | 16511
schemaname | rtable
relname | rtable_uidl
seq_scan | 2
seq_tup_read | 7546016953
idx_scan | 3008619
idx_tup_fetch | 44139478
n_tup_ins | 0
n_tup_upd | 0
n_tup_del | 0
n_tup_hot_upd | 0
n_live_tup | 0
n_dead_tup | 0
last_vacuum | [null]
last_autovacuum | [null]
last_analyze | [null]
last_autoanalyze | [null]
vacuum_count | 0
autovacuum_count | 0
analyze_count | 0
autoanalyze_count | 0
Server spec: 2 Xeon E5-2660, 128GB RAM, disk subsystem
/dev/md2 /var/lib/pgsql/9.3/data
/dev/md3 /var/lib/pgsql/9.3/data/pg_xlog
raids are raid10 on top of 8x300GB intel SSD disks. Both raids use the same disks which are split into two parts (ex. md2:sdb1.., md3:sdb2...).
It should be mentioned that we see significant disc activity on replica DBS during the lockup of apply process (see disks_load.png)
OS: RHEL 6.6
Non default parameters - please check the attachment
After the vacuum
rtabledb01d/rtabledb M # vacuum verbose rtable.rtable_uidl;
INFO: 00000: vacuuming "rtable.rtable_uidl"
LOCATION: lazy_scan_heap, vacuumlazy.c:438
INFO: 00000: scanned index "pk_rtable_uidl" to remove 3 row versions
DETAIL: CPU 251.85s/165.91u sec elapsed 743.44 sec.
LOCATION: lazy_vacuum_index, vacuumlazy.c:1335
INFO: 00000: "rtable_uidl": removed 3 row versions in 3 pages
DETAIL: CPU 0.00s/0.00u sec elapsed 0.00 sec.
LOCATION: lazy_vacuum_heap, vacuumlazy.c:1169
INFO: 00000: index "pk_rtable_uidl" now contains 3773254753 row versions in 32846328 pages
DETAIL: 0 index row versions were removed.
0 index pages have been deleted, 0 are currently reusable.
CPU 0.00s/0.00u sec elapsed 0.00 sec.
LOCATION: lazy_cleanup_index, vacuumlazy.c:1387
INFO: 00000: "rtable_uidl": found 3 removable, 2589545 nonremovable row versions in 20398 out of 26102225 pages
DETAIL: 0 dead row versions cannot be removed yet.
There were 0 unused item pointers.
0 pages are entirely empty.
CPU 253.20s/167.60u sec elapsed 749.44 sec.
LOCATION: lazy_scan_heap, vacuumlazy.c:1101
VACUUM
Time: 750141.401 ms
date
------------
2015-03-03
(1 row)
timetz
--------------------
16:35:50.245227+03
(1 row)
Replay stopped on replicas
Tue Mar 3 16:35:12 MSK 2015 Stream: MASTER-rtabledb01d:81829147840528 SLAVE:81829147765224 Replay:81827156622184 :: REPLAY 1944550 KBytes (00:07:49.816045 seconds)
Tue Mar 3 16:35:17 MSK 2015 Stream: MASTER-rtabledb01d:81829156031576 SLAVE:81829155989056 Replay:81827156622184 :: REPLAY 1952549 KBytes (00:07:54.87067 seconds)
Tue Mar 3 16:35:22 MSK 2015 Stream: MASTER-rtabledb01d:81829165013208 SLAVE:81829164949312 Replay:81827156622184 :: REPLAY 1961320 KBytes (00:07:59.927685 seconds)
Tue Mar 3 16:35:27 MSK 2015 Stream: MASTER-rtabledb01d:81829172941288 SLAVE:81829172887000 Replay:81827156622184 :: REPLAY 1969062 KBytes (00:08:04.977663 seconds)
Tue Mar 3 16:35:32 MSK 2015 Stream: MASTER-rtabledb01d:81829181088512 SLAVE:81829181063304 Replay:81827156622184 :: REPLAY 1977018 KBytes (00:08:10.033499 seconds)
Tue Mar 3 16:35:37 MSK 2015 Stream: MASTER-rtabledb01d:81829191442216 SLAVE:81829191364192 Replay:81827156622184 :: REPLAY 1987129 KBytes (00:08:15.085862 seconds)
Tue Mar 3 16:35:42 MSK 2015 Stream: MASTER-rtabledb01d:81829204580736 SLAVE:81829204444136 Replay:81827156622184 :: REPLAY 1999960 KBytes (00:08:20.13815 seconds)
Tue Mar 3 16:35:47 MSK 2015 Stream: MASTER-rtabledb01d:81829218243240 SLAVE:81829218115272 Replay:81827156622184 :: REPLAY 2013302 KBytes (00:08:25.190515 seconds)
After the vacuum
schema_size | schema_size_with_indexes
-------------+--------------------------
199 GB | 450 GB
rtabledb01d/rtabledb M # select * from pg_stat_all_tables where schemaname = 'rtable' and relname ='rtable_uidl';
-[ RECORD 1 ]-----+------------------------------
relid | 16511
schemaname | rtable
relname | rtable_uidl
seq_scan | 1
seq_tup_read | 14223712
idx_scan | 1370133
idx_tup_fetch | 28596708
n_tup_ins | 12473820
n_tup_upd | 0
n_tup_del | 0
n_tup_hot_upd | 0
n_live_tup | 3771361529
n_dead_tup | 0
last_vacuum | 2015-03-03 16:27:23.231513+03
last_autovacuum | 2015-03-03 07:11:50.891016+03
last_analyze | 2015-02-26 19:50:28.097629+03
last_autoanalyze | 2015-03-03 14:09:14.463953+03
vacuum_count | 4
autovacuum_count | 5
analyze_count | 1
autoanalyze_count | 3
Thanks in advance!
Best regards,
Sergey Shchukin
Вложения
On 2/27/15 5:11 AM, Sergey Shchukin wrote:
>
> show max_standby_streaming_delay;
>   max_standby_streaming_delay
> -----------------------------
>   30s

We both need to be more clear about which server we're talking about
(master or replica).

What are max_standby_streaming_delay and max_standby_archive_delay set
to *on the replica*?

My hope is that one or both of those is set to somewhere around 8
minutes on the replica. That would explain everything.

If that's not the case then I suspect what's happening is there's
something running on the replica that isn't checking for interrupts
frequently enough. That would also explain it.

When replication hangs, is the replication process using a lot of CPU?
Or is it just sitting there? What's the process status for the replay
process show?

Can you get a trace of the replay process on the replica when this is
happening to see where it's spending all it's time?

How are you generating these log lines?
  Tue Feb 24 15:05:07 MSK 2015 Stream: MASTER-masterdb:79607161592048
SLAVE:79607161550576 Replay:79607160986064 :: REPLAY 592 KBytes
(00:00:00.398376 seconds)

Do you see the confl_* fields in pg_stat_database_conflicts on the
*replica* increasing?
--
Jim Nasby, Data Architect, Blue Treble Consulting
Data in Trouble? Get it in Treble! http://BlueTreble.com
05.03.2015 11:25, Jim Nasby пишет:
On 2/27/15 5:11 AM, Sergey Shchukin wrote:
show max_standby_streaming_delay;
max_standby_streaming_delay
-----------------------------
30s
We both need to be more clear about which server we're talking about (master or replica).
What are max_standby_streaming_delay and max_standby_archive_delay set to *on the replica*?
My hope is that one or both of those is set to somewhere around 8 minutes on the replica. That would explain everything.
If that's not the case then I suspect what's happening is there's something running on the replica that isn't checking for interrupts frequently enough. That would also explain it.
When replication hangs, is the replication process using a lot of CPU? Or is it just sitting there? What's the process status for the replay process show?
Can you get a trace of the replay process on the replica when this is happening to see where it's spending all it's time?
How are you generating these log lines?
Tue Feb 24 15:05:07 MSK 2015 Stream: MASTER-masterdb:79607161592048 SLAVE:79607161550576 Replay:79607160986064 :: REPLAY 592 KBytes (00:00:00.398376 seconds)
Do you see the confl_* fields in pg_stat_database_conflicts on the *replica* increasing?
Hi Jim,
max_standby_streaming_delay and max_standby_archive_delay both are 30s on master and replica dbs
I don't see any specific or heavy workload during this issue with a hanging apply process. Just a normal queries as usual.
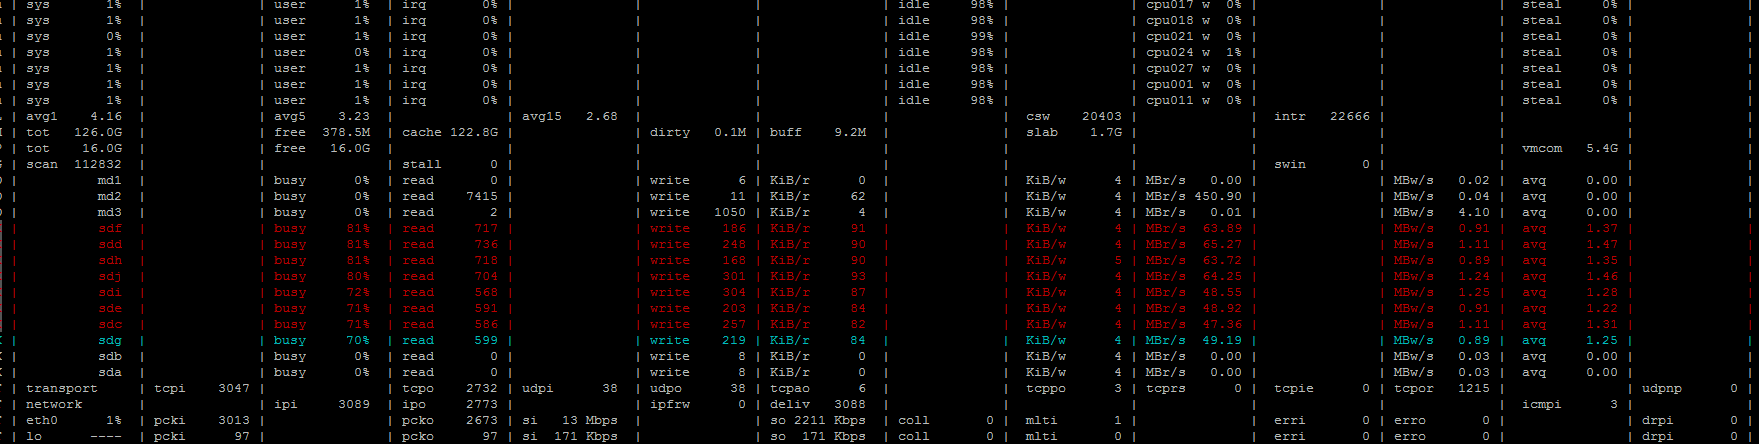
But I see an increased disk activity during the time when the apply issue is ongoing
DSK | sdc | | busy 61% | read 11511 | | write 4534 | KiB/r 46 | | KiB/w 4 | MBr/s 52.78 | | MBw/s 1.88 | avq 1.45 | | avio 0.38 ms |
DSK | sde | | busy 60% | read 11457 | | write 4398 | KiB/r 46 | | KiB/w 4 | MBr/s 51.97 | | MBw/s 1.83 | avq 1.47 | | avio 0.38 ms |
DSK | sdd | | busy 60% | read 9673 | | write 4538 | KiB/r 61 | | KiB/w 4 | MBr/s 58.24 | | MBw/s 1.88 | avq 1.47 | | avio 0.42 ms |
DSK | sdj | | busy 59% | read 9576 | | write 4177 | KiB/r 63 | | KiB/w 4 | MBr/s 59.30 | | MBw/s 1.75 | avq 1.48 | | avio 0.43 ms |
DSK | sdh | | busy 59% | read 9615 | | write 4305 | KiB/r 63 | | KiB/w 4 | MBr/s 59.23 | | MBw/s 1.80 | avq 1.48 | | avio 0.42 ms |
DSK | sdf | | busy 59% | read 9483 | | write 4404 | KiB/r 63 | | KiB/w 4 | MBr/s 59.11 | | MBw/s 1.83 | avq 1.47 | | avio 0.42 ms |
DSK | sdi | | busy 59% | read 11273 | | write 4173 | KiB/r 46 | | KiB/w 4 | MBr/s 51.50 | | MBw/s 1.75 | avq 1.43 | | avio 0.38 ms |
DSK | sdg | | busy 59% | read 11406 | | write 4297 | KiB/r 46 | | KiB/w 4 | MBr/s 51.66 | | MBw/s 1.80 | avq 1.46 | | avio 0.37 ms |
Although it's not seems to be an upper IO limit.
Normally disks are busy at 20-45%
DSK | sde | | busy 29% | read 6524 | | write 14426 | KiB/r 26 | | KiB/w 5 | MBr/s 17.08 | | MBw/s 7.78 | avq 10.46 | | avio 0.14 ms |
DSK | sdi | | busy 29% | read 6590 | | write 14391 | KiB/r 26 | | KiB/w 5 | MBr/s 17.19 | | MBw/s 7.76 | avq 8.75 | | avio 0.14 ms |
DSK | sdg | | busy 29% | read 6547 | | write 14401 | KiB/r 26 | | KiB/w 5 | MBr/s 16.94 | | MBw/s 7.60 | avq 7.28 | | avio 0.14 ms |
DSK | sdc | | busy 29% | read 6835 | | write 14283 | KiB/r 27 | | KiB/w 5 | MBr/s 18.08 | | MBw/s 7.74 | avq 8.77 | | avio 0.14 ms |
DSK | sdf | | busy 23% | read 3808 | | write 14391 | KiB/r 36 | | KiB/w 5 | MBr/s 13.49 | | MBw/s 7.78 | avq 12.88 | | avio 0.13 ms |
DSK | sdd | | busy 23% | read 3747 | | write 14229 | KiB/r 33 | | KiB/w 5 | MBr/s 12.32 | | MBw/s 7.74 | avq 10.07 | | avio 0.13 ms |
DSK | sdj | | busy 23% | read 3737 | | write 14336 | KiB/r 36 | | KiB/w 5 | MBr/s 13.16 | | MBw/s 7.76 | avq 10.48 | | avio 0.13 ms |
DSK | sdh | | busy 23% | read 3793 | | write 14362 | KiB/r 35 | | KiB/w 5 | MBr/s 13.29 | | MBw/s 7.60 | avq 8.61 | | avio 0.13 ms |
Also during the issue perf shows [k] copy_user_generic_string on the top positions
14.09% postmaster postgres [.] 0x00000000001b4569
10.25% postmaster [kernel.kallsyms] [k] copy_user_generic_string
4.15% postmaster postgres [.] hash_search_with_hash_value
2.08% postmaster postgres [.] SearchCatCache
1.79% postmaster postgres [.] LWLockAcquire
1.18% postmaster libc-2.12.so [.] memcpy
1.12% postmaster postgres [.] mdnblocks
Issue starts: at 19:43
Mon Mar 16 19:43:04 MSK 2015 Stream: MASTER-rdb04d:70837172337784 SLAVE:70837172314864 Replay:70837172316512 :: REPLAY 21 KBytes (00:00:00.006225 seconds)
Mon Mar 16 19:43:09 MSK 2015 Stream: MASTER-rdb04d:70837177455624 SLAVE:70837177390968 Replay:70837176794376 :: REPLAY 646 KBytes (00:00:00.367305 seconds)
Mon Mar 16 19:43:14 MSK 2015 Stream: MASTER-rdb04d:70837185005120 SLAVE:70837184961280 Replay:70837183253896 :: REPLAY 1710 KBytes (00:00:00.827881 seconds)
Mon Mar 16 19:43:19 MSK 2015 Stream: MASTER-rdb04d:70837190417984 SLAVE:70837190230232 Replay:70837183253896 :: REPLAY 6996 KBytes (00:00:05.873169 seconds)
Mon Mar 16 19:43:24 MSK 2015 Stream: MASTER-rdb04d:70837198538232 SLAVE:70837198485000 Replay:70837183253896 :: REPLAY 14926 KBytes (00:00:11.025561 seconds)
Mon Mar 16 19:43:29 MSK 2015 Stream: MASTER-rdb04d:70837209961192 SLAVE:70837209869384 Replay:70837183253896 :: REPLAY 26081 KBytes (00:00:16.068014 seconds)
We see [k] copy_user_generic_string
12.90% postmaster [kernel.kallsyms] [k] copy_user_generic_string
11.49% postmaster postgres [.] 0x00000000001f40c1
4.74% postmaster postgres [.] hash_search_with_hash_value
1.86% postmaster postgres [.] mdnblocks
1.73% postmaster postgres [.] LWLockAcquire
1.67% postmaster postgres [.] SearchCatCache
25.71% postmaster [kernel.kallsyms] [k] copy_user_generic_string
7.89% postmaster postgres [.] hash_search_with_hash_value
4.66% postmaster postgres [.] 0x00000000002108da
4.51% postmaster postgres [.] mdnblocks
3.36% postmaster [kernel.kallsyms] [k] put_page
Issue stops: at 19:51:39
Mon Mar 16 19:51:24 MSK 2015 Stream: MASTER-rdb04d:70838904179344 SLAVE:70838903934392 Replay:70837183253896 :: REPLAY 1680591 KBytes (00:08:10.384679 seconds)
Mon Mar 16 19:51:29 MSK 2015 Stream: MASTER-rdb04d:70838929994336 SLAVE:70838929873624 Replay:70837183253896 :: REPLAY 1705801 KBytes (00:08:15.428773 seconds)
Mon Mar 16 19:51:34 MSK 2015 Stream: MASTER-rdb04d:70838951993624 SLAVE:70838951899768 Replay:70837183253896 :: REPLAY 1727285 KBytes (00:08:20.472567 seconds)
Mon Mar 16 19:51:39 MSK 2015 Stream: MASTER-rdb04d:70838975297912 SLAVE:70838975180384 Replay:70837208050872 :: REPLAY 1725827 KBytes (00:08:10.256935 seconds)
Mon Mar 16 19:51:44 MSK 2015 Stream: MASTER-rdb04d:70839001502160 SLAVE:70839001412616 Replay:70837260116984 :: REPLAY 1700572 KBytes (00:07:49.849511 seconds)
Mon Mar 16 19:51:49 MSK 2015 Stream: MASTER-rdb04d:70839022866760 SLAVE:70839022751184 Replay:70837276732880 :: REPLAY 1705209 KBytes (00:07:42.307364 seconds)
And copy_user_generic_string goes down
+ 13.43% postmaster postgres [.] 0x000000000023dc9a
+ 3.71% postmaster [kernel.kallsyms] [k] copy_user_generic_string
+ 2.46% init [kernel.kallsyms] [k] intel_idle
+ 2.30% postmaster postgres [.] hash_search_with_hash_value
+ 2.01% postmaster postgres [.] SearchCatCache
Could you clarify what types of traces did you mean? GDB?
To calculate slave and apply lag I use the following query at the replica site
slave_lag=$($psql -U monitor -h$s_host -p$s_port -A -t -c "SELECT pg_xlog_location_diff(pg_last_xlog_receive_location(), '0/0') AS receive" $p_db)
replay_lag=$($psql -U monitor -h$s_host -p$s_port -A -t -c "SELECT pg_xlog_location_diff(pg_last_xlog_replay_location(), '0/0') AS replay" $p_db)
replay_timediff=$($psql -U monitor -h$s_host -p$s_port -A -t -c "SELECT NOW() - pg_last_xact_replay_timestamp() AS replication_delay" $p_db)
master_lag=$($psql -U monitor -h$p_host -p$p_port -A -t -c "SELECT pg_xlog_location_diff(pg_current_xlog_location(), '0/0') AS offset" $p_db)
echo "$(date) Stream: MASTER-$p_host:$master_lag SLAVE:$slave_lag Replay:$replay_lag :: REPLAY $(bc <<< $master_lag/1024-$replay_lag/1024) KBytes (${replay_timediff} seconds)"
-
Best regards,
Sergey Shchukin
17.03.2015 13:22, Sergey Shchukin пишет:
05.03.2015 11:25, Jim Nasby пишет:On 2/27/15 5:11 AM, Sergey Shchukin wrote:
show max_standby_streaming_delay;
max_standby_streaming_delay
-----------------------------
30s
We both need to be more clear about which server we're talking about (master or replica).
What are max_standby_streaming_delay and max_standby_archive_delay set to *on the replica*?
My hope is that one or both of those is set to somewhere around 8 minutes on the replica. That would explain everything.
If that's not the case then I suspect what's happening is there's something running on the replica that isn't checking for interrupts frequently enough. That would also explain it.
When replication hangs, is the replication process using a lot of CPU? Or is it just sitting there? What's the process status for the replay process show?
Can you get a trace of the replay process on the replica when this is happening to see where it's spending all it's time?
How are you generating these log lines?
Tue Feb 24 15:05:07 MSK 2015 Stream: MASTER-masterdb:79607161592048 SLAVE:79607161550576 Replay:79607160986064 :: REPLAY 592 KBytes (00:00:00.398376 seconds)
Do you see the confl_* fields in pg_stat_database_conflicts on the *replica* increasing?
Hi Jim,
max_standby_streaming_delay and max_standby_archive_delay both are 30s on master and replica dbs
I don't see any specific or heavy workload during this issue with a hanging apply process. Just a normal queries as usual.
But I see an increased disk activity during the time when the apply issue is ongoing
DSK | sdc | | busy 61% | read 11511 | | write 4534 | KiB/r 46 | | KiB/w 4 | MBr/s 52.78 | | MBw/s 1.88 | avq 1.45 | | avio 0.38 ms |
DSK | sde | | busy 60% | read 11457 | | write 4398 | KiB/r 46 | | KiB/w 4 | MBr/s 51.97 | | MBw/s 1.83 | avq 1.47 | | avio 0.38 ms |
DSK | sdd | | busy 60% | read 9673 | | write 4538 | KiB/r 61 | | KiB/w 4 | MBr/s 58.24 | | MBw/s 1.88 | avq 1.47 | | avio 0.42 ms |
DSK | sdj | | busy 59% | read 9576 | | write 4177 | KiB/r 63 | | KiB/w 4 | MBr/s 59.30 | | MBw/s 1.75 | avq 1.48 | | avio 0.43 ms |
DSK | sdh | | busy 59% | read 9615 | | write 4305 | KiB/r 63 | | KiB/w 4 | MBr/s 59.23 | | MBw/s 1.80 | avq 1.48 | | avio 0.42 ms |
DSK | sdf | | busy 59% | read 9483 | | write 4404 | KiB/r 63 | | KiB/w 4 | MBr/s 59.11 | | MBw/s 1.83 | avq 1.47 | | avio 0.42 ms |
DSK | sdi | | busy 59% | read 11273 | | write 4173 | KiB/r 46 | | KiB/w 4 | MBr/s 51.50 | | MBw/s 1.75 | avq 1.43 | | avio 0.38 ms |
DSK | sdg | | busy 59% | read 11406 | | write 4297 | KiB/r 46 | | KiB/w 4 | MBr/s 51.66 | | MBw/s 1.80 | avq 1.46 | | avio 0.37 ms |
Although it's not seems to be an upper IO limit.
Normally disks are busy at 20-45%
DSK | sde | | busy 29% | read 6524 | | write 14426 | KiB/r 26 | | KiB/w 5 | MBr/s 17.08 | | MBw/s 7.78 | avq 10.46 | | avio 0.14 ms |
DSK | sdi | | busy 29% | read 6590 | | write 14391 | KiB/r 26 | | KiB/w 5 | MBr/s 17.19 | | MBw/s 7.76 | avq 8.75 | | avio 0.14 ms |
DSK | sdg | | busy 29% | read 6547 | | write 14401 | KiB/r 26 | | KiB/w 5 | MBr/s 16.94 | | MBw/s 7.60 | avq 7.28 | | avio 0.14 ms |
DSK | sdc | | busy 29% | read 6835 | | write 14283 | KiB/r 27 | | KiB/w 5 | MBr/s 18.08 | | MBw/s 7.74 | avq 8.77 | | avio 0.14 ms |
DSK | sdf | | busy 23% | read 3808 | | write 14391 | KiB/r 36 | | KiB/w 5 | MBr/s 13.49 | | MBw/s 7.78 | avq 12.88 | | avio 0.13 ms |
DSK | sdd | | busy 23% | read 3747 | | write 14229 | KiB/r 33 | | KiB/w 5 | MBr/s 12.32 | | MBw/s 7.74 | avq 10.07 | | avio 0.13 ms |
DSK | sdj | | busy 23% | read 3737 | | write 14336 | KiB/r 36 | | KiB/w 5 | MBr/s 13.16 | | MBw/s 7.76 | avq 10.48 | | avio 0.13 ms |
DSK | sdh | | busy 23% | read 3793 | | write 14362 | KiB/r 35 | | KiB/w 5 | MBr/s 13.29 | | MBw/s 7.60 | avq 8.61 | | avio 0.13 ms |
Also during the issue perf shows [k] copy_user_generic_string on the top positions
14.09% postmaster postgres [.] 0x00000000001b4569
10.25% postmaster [kernel.kallsyms] [k] copy_user_generic_string
4.15% postmaster postgres [.] hash_search_with_hash_value
2.08% postmaster postgres [.] SearchCatCache
1.79% postmaster postgres [.] LWLockAcquire
1.18% postmaster libc-2.12.so [.] memcpy
1.12% postmaster postgres [.] mdnblocks
Issue starts: at 19:43
Mon Mar 16 19:43:04 MSK 2015 Stream: MASTER-rdb04d:70837172337784 SLAVE:70837172314864 Replay:70837172316512 :: REPLAY 21 KBytes (00:00:00.006225 seconds)
Mon Mar 16 19:43:09 MSK 2015 Stream: MASTER-rdb04d:70837177455624 SLAVE:70837177390968 Replay:70837176794376 :: REPLAY 646 KBytes (00:00:00.367305 seconds)
Mon Mar 16 19:43:14 MSK 2015 Stream: MASTER-rdb04d:70837185005120 SLAVE:70837184961280 Replay:70837183253896 :: REPLAY 1710 KBytes (00:00:00.827881 seconds)
Mon Mar 16 19:43:19 MSK 2015 Stream: MASTER-rdb04d:70837190417984 SLAVE:70837190230232 Replay:70837183253896 :: REPLAY 6996 KBytes (00:00:05.873169 seconds)
Mon Mar 16 19:43:24 MSK 2015 Stream: MASTER-rdb04d:70837198538232 SLAVE:70837198485000 Replay:70837183253896 :: REPLAY 14926 KBytes (00:00:11.025561 seconds)
Mon Mar 16 19:43:29 MSK 2015 Stream: MASTER-rdb04d:70837209961192 SLAVE:70837209869384 Replay:70837183253896 :: REPLAY 26081 KBytes (00:00:16.068014 seconds)
We see [k] copy_user_generic_string
12.90% postmaster [kernel.kallsyms] [k] copy_user_generic_string
11.49% postmaster postgres [.] 0x00000000001f40c1
4.74% postmaster postgres [.] hash_search_with_hash_value
1.86% postmaster postgres [.] mdnblocks
1.73% postmaster postgres [.] LWLockAcquire
1.67% postmaster postgres [.] SearchCatCache
25.71% postmaster [kernel.kallsyms] [k] copy_user_generic_string
7.89% postmaster postgres [.] hash_search_with_hash_value
4.66% postmaster postgres [.] 0x00000000002108da
4.51% postmaster postgres [.] mdnblocks
3.36% postmaster [kernel.kallsyms] [k] put_page
Issue stops: at 19:51:39
Mon Mar 16 19:51:24 MSK 2015 Stream: MASTER-rdb04d:70838904179344 SLAVE:70838903934392 Replay:70837183253896 :: REPLAY 1680591 KBytes (00:08:10.384679 seconds)
Mon Mar 16 19:51:29 MSK 2015 Stream: MASTER-rdb04d:70838929994336 SLAVE:70838929873624 Replay:70837183253896 :: REPLAY 1705801 KBytes (00:08:15.428773 seconds)
Mon Mar 16 19:51:34 MSK 2015 Stream: MASTER-rdb04d:70838951993624 SLAVE:70838951899768 Replay:70837183253896 :: REPLAY 1727285 KBytes (00:08:20.472567 seconds)
Mon Mar 16 19:51:39 MSK 2015 Stream: MASTER-rdb04d:70838975297912 SLAVE:70838975180384 Replay:70837208050872 :: REPLAY 1725827 KBytes (00:08:10.256935 seconds)
Mon Mar 16 19:51:44 MSK 2015 Stream: MASTER-rdb04d:70839001502160 SLAVE:70839001412616 Replay:70837260116984 :: REPLAY 1700572 KBytes (00:07:49.849511 seconds)
Mon Mar 16 19:51:49 MSK 2015 Stream: MASTER-rdb04d:70839022866760 SLAVE:70839022751184 Replay:70837276732880 :: REPLAY 1705209 KBytes (00:07:42.307364 seconds)
And copy_user_generic_string goes down
+ 13.43% postmaster postgres [.] 0x000000000023dc9a
+ 3.71% postmaster [kernel.kallsyms] [k] copy_user_generic_string
+ 2.46% init [kernel.kallsyms] [k] intel_idle
+ 2.30% postmaster postgres [.] hash_search_with_hash_value
+ 2.01% postmaster postgres [.] SearchCatCache
Could you clarify what types of traces did you mean? GDB?
To calculate slave and apply lag I use the following query at the replica site
slave_lag=$($psql -U monitor -h$s_host -p$s_port -A -t -c "SELECT pg_xlog_location_diff(pg_last_xlog_receive_location(), '0/0') AS receive" $p_db)
replay_lag=$($psql -U monitor -h$s_host -p$s_port -A -t -c "SELECT pg_xlog_location_diff(pg_last_xlog_replay_location(), '0/0') AS replay" $p_db)
replay_timediff=$($psql -U monitor -h$s_host -p$s_port -A -t -c "SELECT NOW() - pg_last_xact_replay_timestamp() AS replication_delay" $p_db)
master_lag=$($psql -U monitor -h$p_host -p$p_port -A -t -c "SELECT pg_xlog_location_diff(pg_current_xlog_location(), '0/0') AS offset" $p_db)
echo "$(date) Stream: MASTER-$p_host:$master_lag SLAVE:$slave_lag Replay:$replay_lag :: REPLAY $(bc <<< $master_lag/1024-$replay_lag/1024) KBytes (${replay_timediff} seconds)"- Best regards, Sergey Shchukin
One more thing
We have upgraded one of our shards to 9.4.1 and expectedly that did not help.

A few things to notice which may be useful.

1. When replay stops, startup process reads a lot from array with $PGDATA. In iotop and iostat we see the following:

Total DISK READ: 490.42 M/s | Total DISK WRITE: 3.82 M/s TID  PRIO  USER    DISK READ>  DISK WRITE  SWAPIN      IO    COMMAND  3316 be/4 postgres  492.34 M/s    0.00 B/s  0.00 % 39.91 % postgres: startup process  <...>
  Device:         rrqm/s   wrqm/s     r/s     w/s    rMB/s    wMB/s avgrq-sz avgqu-sz   await  svctm  %util  <...>  md2               0.00     0.00 6501.00    7.00   339.90     0.03   106.97     0.00    0.00   0.00   0.00  md3               0.00     0.00    0.00 1739.00     0.00     6.79     8.00     0.00    0.00   0.00   0.00
  root@rpopdb04g ~ # fgrep 9.4 /proc/mounts  /dev/md2 /var/lib/pgsql/9.4/data ext4 rw,noatime,nodiratime,barrier=1,stripe=64,data=ordered 0 0  /dev/md3 /var/lib/pgsql/9.4/data/pg_xlog ext4 rw,noatime,nodiratime,barrier=0,stripe=64,data=ordered 0 0  root@rpopdb04g ~ #

2. The state of the startup process is changing in such a way:
  root@rpopdb04g ~ # while true; do ps aux | grep '[s]tartup'; sleep 1; done  postgres  3316 26.6  3.2 4732052 4299260 ?     Rs   18:04   8:11 postgres: startup process  postgres  3316 26.6  3.2 4732052 4299260 ?     Ts   18:04   8:11 postgres: startup process  postgres  3316 26.6  3.2 4732052 4299260 ?     Rs   18:04   8:12 postgres: startup process  postgres  3316 26.6  3.2 4732052 4299260 ?     Ds   18:04   8:12 postgres: startup process  postgres  3316 26.6  3.2 4732052 4299260 ?     Rs   18:04   8:13 postgres: startup process  postgres  3316 26.6  3.2 4732052 4299260 ?     Rs   18:04   8:13 postgres: startup process  postgres  3316 26.6  3.2 4732052 4299260 ?     Rs   18:04   8:14 postgres: startup process  postgres  3316 26.6  3.2 4732052 4299260 ?     Ts   18:04   8:14 postgres: startup process  postgres  3316 26.6  3.2 4732052 4299260 ?     Ds   18:04   8:15 postgres: startup process  postgres  3316 26.6  3.2 4732052 4299260 ?     Rs   18:04   8:15 postgres: startup process  postgres  3316 26.7  3.2 4732052 4299260 ?     Ds   18:04   8:15 postgres: startup process  postgres  3316 26.7  3.2 4732052 4299260 ?     Ds   18:04   8:16 postgres: startup process  postgres  3316 26.7  3.2 4732052 4299260 ?     Rs   18:04   8:16 postgres: startup process  postgres  3316 26.7  3.2 4732052 4299260 ?     Rs   18:04   8:17 postgres: startup process  postgres  3316 26.7  3.2 4732052 4299260 ?     Ts   18:04   8:17 postgres: startup process  postgres  3316 26.7  3.2 4732052 4299260 ?     Rs   18:04   8:18 postgres: startup process  postgres  3316 26.7  3.2 4732052 4299260 ?     Rs   18:04   8:18 postgres: startup process  postgres  3316 26.7  3.2 4732052 4299260 ?     Ds   18:04   8:19 postgres: startup process  postgres  3316 26.8  3.2 4732052 4299260 ?     Rs   18:04   8:19 postgres: startup process  postgres  3316 26.8  3.2 4732052 4299260 ?     Rs   18:04   8:20 postgres: startup process  postgres  3316 26.8  3.2 4732052 4299260 ?     Rs   18:04   8:20 postgres: startup process  postgres  3316 26.8  3.2 4732052 4299260 ?     Ds   18:04   8:21 postgres: startup process  postgres  3316 26.8  3.2 4732052 4299260 ?     Ds   18:04   8:22 postgres: startup process  postgres  3316 26.8  3.2 4732052 4299260 ?     Rs   18:04   8:22 postgres: startup process  postgres  3316 26.8  3.2 4732052 4299260 ?     Rs   18:04   8:23 postgres: startup process  postgres  3316 26.9  3.2 4732052 4299260 ?     Rs   18:04   8:23 postgres: startup process  postgres  3316 26.9  3.2 4732052 4299260 ?     Rs   18:04   8:24 postgres: startup process  postgres  3316 26.9  3.2 4732052 4299260 ?     Ts   18:04   8:24 postgres: startup process  postgres  3316 26.9  3.2 4732052 4299260 ?     Rs   18:04   8:25 postgres: startup process  ^C  root@rpopdb04g ~ #

3. confl* fields in pg_stat_database_conflicts are always zero during the pausing of replay.

4. The stack-traces taken with GDB are not really informative. We will recompile PostgreSQL with —enable-debug option and run it on one of our replicas if needed. Since it is a production system we would like to do it last of all. But we will do it if anybody would not give us any ideas.

5. In one of the experiments replay stopped on 4115/56126DC0 xlog position. Here is a bit of pg_xlogdump output:
   rpopdb04d/rpopdb M # select pg_xlogfile_name('4115/56126DC0');    pg_xlogfile_name    --------------------------     000000060000411500000056     (1 row)
     Time: 0.496 ms     rpopdb04d/rpopdb M #
   root@pg-backup04h /u0/rpopdb04/wals/0000000600004115 # /usr/pgsql-9.4/bin/pg_xlogdump 000000060000411500000056 000000060000411500000056 | fgrep 4115/56126DC0 -C10   rmgr: Heap        len (rec/tot):     36/  3948, tx: 3930143874, lsn: 4115/561226C8, prev 4115/56122698, bkp: 1000, desc: hot_update: rel 1663/16420/16737; tid 196267/4 xmax 3930143874 ; new tid 196267/10 xmax 0   rmgr: Transaction len (rec/tot):     12/    44, tx: 3930143874, lsn: 4115/56123638, prev 4115/561226C8, bkp: 0000, desc: commit: 2015-03-19 18:26:27.725158 MSK   rmgr: Heap        len (rec/tot):     58/    90, tx: 3930143875, lsn: 4115/56123668, prev 4115/56123638, bkp: 0000, desc: hot_update: rel 1663/16420/16737; tid 23624/3 xmax 3930143875 ; new tid 23624/21 xmax 0   rmgr: Transaction len (rec/tot):     12/    44, tx: 3930143875, lsn: 4115/561236C8, prev 4115/56123668, bkp: 0000, desc: commit: 2015-03-19 18:26:27.726432 MSK   rmgr: Heap        len (rec/tot):     36/  2196, tx: 3930143876, lsn: 4115/561236F8, prev 4115/561236C8, bkp: 1000, desc: hot_update: rel 1663/16420/16737; tid 123008/4 xmax 3930143876 ; new tid 123008/5 xmax 0   rmgr: Transaction len (rec/tot):     12/    44, tx: 3930143876, lsn: 4115/56123F90, prev 4115/561236F8, bkp: 0000, desc: commit: 2015-03-19 18:26:27.727088 MSK   rmgr: Heap        len (rec/tot):     36/  7108, tx: 3930143877, lsn: 4115/56123FC0, prev 4115/56123F90, bkp: 1000, desc: hot_update: rel 1663/16420/16737; tid 34815/6 xmax 3930143877 ; new tid 34815/16 xmax 0   rmgr: Transaction len (rec/tot):     12/    44, tx: 3930143877, lsn: 4115/56125BA0, prev 4115/56123FC0, bkp: 0000, desc: commit: 2015-03-19 18:26:27.728178 MSK   rmgr: Heap        len (rec/tot):     36/  4520, tx: 3930143878, lsn: 4115/56125BD0, prev 4115/56125BA0, bkp: 1000, desc: hot_update: rel 1663/16420/16737; tid 147863/5 xmax 3930143878 ; new tid 147863/16 xmax 0   rmgr: Transaction len (rec/tot):     12/    44, tx: 3930143878, lsn: 4115/56126D90, prev 4115/56125BD0, bkp: 0000, desc: commit: 2015-03-19 18:26:27.728339 MSK   rmgr: Btree       len (rec/tot):     20/    52, tx:          0, lsn: 4115/56126DC0, prev 4115/56126D90, bkp: 0000, desc: vacuum: rel 1663/16420/16796; blk 31222118, lastBlockVacuumed 0   rmgr: Heap        len (rec/tot):     36/  6112, tx: 3930143879, lsn: 4115/56126DF8, prev 4115/56126DC0, bkp: 1000, desc: hot_update: rel 1663/16420/16737; tid 23461/26 xmax 3930143879 ; new tid 23461/22 xmax 0   rmgr: Heap2       len (rec/tot):     24/  8160, tx:          0, lsn: 4115/561285F0, prev 4115/56126DF8, bkp: 1000, desc: clean: rel 1663/16420/16782; blk 21997709 remxid 0   rmgr: Transaction len (rec/tot):     12/    44, tx: 3930143879, lsn: 4115/5612A5E8, prev 4115/561285F0, bkp: 0000, desc: commit: 2015-03-19 18:26:27.728805 MSK   rmgr: Heap2       len (rec/tot):     20/  8268, tx:          0, lsn: 4115/5612A618, prev 4115/5612A5E8, bkp: 1000, desc: visible: rel 1663/16420/16782; blk 21997709   rmgr: Heap        len (rec/tot):     36/  7420, tx: 3930143880, lsn: 4115/5612C680, prev 4115/5612A618, bkp: 1000, desc: hot_update: rel 1663/16420/16737; tid 37456/8 xmax 3930143880 ; new tid 37456/29 xmax 0   rmgr: Transaction len (rec/tot):     12/    44, tx: 3930143880, lsn: 4115/5612E398, prev 4115/5612C680, bkp: 0000, desc: commit: 2015-03-19 18:26:27.729141 MSK   rmgr: Heap        len (rec/tot):     36/  7272, tx: 3930143881, lsn: 4115/5612E3C8, prev 4115/5612E398, bkp: 1000, desc: hot_update: rel 1663/16420/16737; tid 23614/2 xmax 3930143881 ; new tid 23614/22 xmax 0   rmgr: Heap        len (rec/tot):    150/   182, tx:          0, lsn: 4115/56130048, prev 4115/5612E3C8, bkp: 0000, desc: inplace: rel 1663/16420/12764; tid 11/31   rmgr: Transaction len (rec/tot):     12/    44, tx: 3930143881, lsn: 4115/56130100, prev 4115/56130048, bkp: 0000, desc: commit: 2015-03-19 18:26:27.729340 MSK   rmgr: Heap        len (rec/tot):     43/    75, tx: 3930143882, lsn: 4115/56130130, prev 4115/56130100, bkp: 0000, desc: insert: rel 1663/16420/16773; tid 10159950/26   rmgr: Btree       len (rec/tot):     42/    74, tx: 3930143882, lsn: 4115/56130180, prev 4115/56130130, bkp: 0000, desc: insert: rel 1663/16420/16800; tid 12758988/260   root@pg-backup04h /u0/rpopdb04/wals/0000000600004115 #

Any help would be really appropriate. Thanks in advance.
Re: [pgadmin-support] Issue with a hanging apply process on the replica db after vacuum works on primary
От
Vladimir Borodin
Дата:
19 марта 2015 г., в 20:30, Sergey Shchukin <shchukin.s.a@gmail.com> написал(а):17.03.2015 13:22, Sergey Shchukin пишет:05.03.2015 11:25, Jim Nasby пишет:On 2/27/15 5:11 AM, Sergey Shchukin wrote:
show max_standby_streaming_delay;
max_standby_streaming_delay
-----------------------------
30s
We both need to be more clear about which server we're talking about (master or replica).
What are max_standby_streaming_delay and max_standby_archive_delay set to *on the replica*?
My hope is that one or both of those is set to somewhere around 8 minutes on the replica. That would explain everything.
If that's not the case then I suspect what's happening is there's something running on the replica that isn't checking for interrupts frequently enough. That would also explain it.
When replication hangs, is the replication process using a lot of CPU? Or is it just sitting there? What's the process status for the replay process show?
Can you get a trace of the replay process on the replica when this is happening to see where it's spending all it's time?
How are you generating these log lines?
Tue Feb 24 15:05:07 MSK 2015 Stream: MASTER-masterdb:79607161592048 SLAVE:79607161550576 Replay:79607160986064 :: REPLAY 592 KBytes (00:00:00.398376 seconds)
Do you see the confl_* fields in pg_stat_database_conflicts on the *replica* increasing?
Hi Jim,
max_standby_streaming_delay and max_standby_archive_delay both are 30s on master and replica dbs
I don't see any specific or heavy workload during this issue with a hanging apply process. Just a normal queries as usual.
But I see an increased disk activity during the time when the apply issue is ongoing
DSK | sdc | | busy 61% | read 11511 | | write 4534 | KiB/r 46 | | KiB/w 4 | MBr/s 52.78 | | MBw/s 1.88 | avq 1.45 | | avio 0.38 ms |
DSK | sde | | busy 60% | read 11457 | | write 4398 | KiB/r 46 | | KiB/w 4 | MBr/s 51.97 | | MBw/s 1.83 | avq 1.47 | | avio 0.38 ms |
DSK | sdd | | busy 60% | read 9673 | | write 4538 | KiB/r 61 | | KiB/w 4 | MBr/s 58.24 | | MBw/s 1.88 | avq 1.47 | | avio 0.42 ms |
DSK | sdj | | busy 59% | read 9576 | | write 4177 | KiB/r 63 | | KiB/w 4 | MBr/s 59.30 | | MBw/s 1.75 | avq 1.48 | | avio 0.43 ms |
DSK | sdh | | busy 59% | read 9615 | | write 4305 | KiB/r 63 | | KiB/w 4 | MBr/s 59.23 | | MBw/s 1.80 | avq 1.48 | | avio 0.42 ms |
DSK | sdf | | busy 59% | read 9483 | | write 4404 | KiB/r 63 | | KiB/w 4 | MBr/s 59.11 | | MBw/s 1.83 | avq 1.47 | | avio 0.42 ms |
DSK | sdi | | busy 59% | read 11273 | | write 4173 | KiB/r 46 | | KiB/w 4 | MBr/s 51.50 | | MBw/s 1.75 | avq 1.43 | | avio 0.38 ms |
DSK | sdg | | busy 59% | read 11406 | | write 4297 | KiB/r 46 | | KiB/w 4 | MBr/s 51.66 | | MBw/s 1.80 | avq 1.46 | | avio 0.37 ms |
Although it's not seems to be an upper IO limit.
Normally disks are busy at 20-45%
DSK | sde | | busy 29% | read 6524 | | write 14426 | KiB/r 26 | | KiB/w 5 | MBr/s 17.08 | | MBw/s 7.78 | avq 10.46 | | avio 0.14 ms |
DSK | sdi | | busy 29% | read 6590 | | write 14391 | KiB/r 26 | | KiB/w 5 | MBr/s 17.19 | | MBw/s 7.76 | avq 8.75 | | avio 0.14 ms |
DSK | sdg | | busy 29% | read 6547 | | write 14401 | KiB/r 26 | | KiB/w 5 | MBr/s 16.94 | | MBw/s 7.60 | avq 7.28 | | avio 0.14 ms |
DSK | sdc | | busy 29% | read 6835 | | write 14283 | KiB/r 27 | | KiB/w 5 | MBr/s 18.08 | | MBw/s 7.74 | avq 8.77 | | avio 0.14 ms |
DSK | sdf | | busy 23% | read 3808 | | write 14391 | KiB/r 36 | | KiB/w 5 | MBr/s 13.49 | | MBw/s 7.78 | avq 12.88 | | avio 0.13 ms |
DSK | sdd | | busy 23% | read 3747 | | write 14229 | KiB/r 33 | | KiB/w 5 | MBr/s 12.32 | | MBw/s 7.74 | avq 10.07 | | avio 0.13 ms |
DSK | sdj | | busy 23% | read 3737 | | write 14336 | KiB/r 36 | | KiB/w 5 | MBr/s 13.16 | | MBw/s 7.76 | avq 10.48 | | avio 0.13 ms |
DSK | sdh | | busy 23% | read 3793 | | write 14362 | KiB/r 35 | | KiB/w 5 | MBr/s 13.29 | | MBw/s 7.60 | avq 8.61 | | avio 0.13 ms |
Also during the issue perf shows [k] copy_user_generic_string on the top positions
14.09% postmaster postgres [.] 0x00000000001b4569
10.25% postmaster [kernel.kallsyms] [k] copy_user_generic_string
4.15% postmaster postgres [.] hash_search_with_hash_value
2.08% postmaster postgres [.] SearchCatCache
1.79% postmaster postgres [.] LWLockAcquire
1.18% postmaster libc-2.12.so [.] memcpy
1.12% postmaster postgres [.] mdnblocks
Issue starts: at 19:43
Mon Mar 16 19:43:04 MSK 2015 Stream: MASTER-rdb04d:70837172337784 SLAVE:70837172314864 Replay:70837172316512 :: REPLAY 21 KBytes (00:00:00.006225 seconds)
Mon Mar 16 19:43:09 MSK 2015 Stream: MASTER-rdb04d:70837177455624 SLAVE:70837177390968 Replay:70837176794376 :: REPLAY 646 KBytes (00:00:00.367305 seconds)
Mon Mar 16 19:43:14 MSK 2015 Stream: MASTER-rdb04d:70837185005120 SLAVE:70837184961280 Replay:70837183253896 :: REPLAY 1710 KBytes (00:00:00.827881 seconds)
Mon Mar 16 19:43:19 MSK 2015 Stream: MASTER-rdb04d:70837190417984 SLAVE:70837190230232 Replay:70837183253896 :: REPLAY 6996 KBytes (00:00:05.873169 seconds)
Mon Mar 16 19:43:24 MSK 2015 Stream: MASTER-rdb04d:70837198538232 SLAVE:70837198485000 Replay:70837183253896 :: REPLAY 14926 KBytes (00:00:11.025561 seconds)
Mon Mar 16 19:43:29 MSK 2015 Stream: MASTER-rdb04d:70837209961192 SLAVE:70837209869384 Replay:70837183253896 :: REPLAY 26081 KBytes (00:00:16.068014 seconds)
We see [k] copy_user_generic_string
12.90% postmaster [kernel.kallsyms] [k] copy_user_generic_string
11.49% postmaster postgres [.] 0x00000000001f40c1
4.74% postmaster postgres [.] hash_search_with_hash_value
1.86% postmaster postgres [.] mdnblocks
1.73% postmaster postgres [.] LWLockAcquire
1.67% postmaster postgres [.] SearchCatCache
25.71% postmaster [kernel.kallsyms] [k] copy_user_generic_string
7.89% postmaster postgres [.] hash_search_with_hash_value
4.66% postmaster postgres [.] 0x00000000002108da
4.51% postmaster postgres [.] mdnblocks
3.36% postmaster [kernel.kallsyms] [k] put_page
Issue stops: at 19:51:39
Mon Mar 16 19:51:24 MSK 2015 Stream: MASTER-rdb04d:70838904179344 SLAVE:70838903934392 Replay:70837183253896 :: REPLAY 1680591 KBytes (00:08:10.384679 seconds)
Mon Mar 16 19:51:29 MSK 2015 Stream: MASTER-rdb04d:70838929994336 SLAVE:70838929873624 Replay:70837183253896 :: REPLAY 1705801 KBytes (00:08:15.428773 seconds)
Mon Mar 16 19:51:34 MSK 2015 Stream: MASTER-rdb04d:70838951993624 SLAVE:70838951899768 Replay:70837183253896 :: REPLAY 1727285 KBytes (00:08:20.472567 seconds)
Mon Mar 16 19:51:39 MSK 2015 Stream: MASTER-rdb04d:70838975297912 SLAVE:70838975180384 Replay:70837208050872 :: REPLAY 1725827 KBytes (00:08:10.256935 seconds)
Mon Mar 16 19:51:44 MSK 2015 Stream: MASTER-rdb04d:70839001502160 SLAVE:70839001412616 Replay:70837260116984 :: REPLAY 1700572 KBytes (00:07:49.849511 seconds)
Mon Mar 16 19:51:49 MSK 2015 Stream: MASTER-rdb04d:70839022866760 SLAVE:70839022751184 Replay:70837276732880 :: REPLAY 1705209 KBytes (00:07:42.307364 seconds)
And copy_user_generic_string goes down
+ 13.43% postmaster postgres [.] 0x000000000023dc9a
+ 3.71% postmaster [kernel.kallsyms] [k] copy_user_generic_string
+ 2.46% init [kernel.kallsyms] [k] intel_idle
+ 2.30% postmaster postgres [.] hash_search_with_hash_value
+ 2.01% postmaster postgres [.] SearchCatCache
Could you clarify what types of traces did you mean? GDB?
To calculate slave and apply lag I use the following query at the replica site
slave_lag=$($psql -U monitor -h$s_host -p$s_port -A -t -c "SELECT pg_xlog_location_diff(pg_last_xlog_receive_location(), '0/0') AS receive" $p_db)
replay_lag=$($psql -U monitor -h$s_host -p$s_port -A -t -c "SELECT pg_xlog_location_diff(pg_last_xlog_replay_location(), '0/0') AS replay" $p_db)
replay_timediff=$($psql -U monitor -h$s_host -p$s_port -A -t -c "SELECT NOW() - pg_last_xact_replay_timestamp() AS replication_delay" $p_db)
master_lag=$($psql -U monitor -h$p_host -p$p_port -A -t -c "SELECT pg_xlog_location_diff(pg_current_xlog_location(), '0/0') AS offset" $p_db)
echo "$(date) Stream: MASTER-$p_host:$master_lag SLAVE:$slave_lag Replay:$replay_lag :: REPLAY $(bc <<< $master_lag/1024-$replay_lag/1024) KBytes (${replay_timediff} seconds)"- Best regards, Sergey Shchukin
One more thingWe have upgraded one of our shards to 9.4.1 and expectedly that did not help. A few things to notice which may be useful. 1. When replay stops, startup process reads a lot from array with $PGDATA. In iotop and iostat we see the following: Total DISK READ: 490.42 M/s | Total DISK WRITE: 3.82 M/s TID PRIO USER DISK READ> DISK WRITE SWAPIN IO COMMAND 3316 be/4 postgres 492.34 M/s 0.00 B/s 0.00 % 39.91 % postgres: startup process <...> Device: rrqm/s wrqm/s r/s w/s rMB/s wMB/s avgrq-sz avgqu-sz await svctm %util <...> md2 0.00 0.00 6501.00 7.00 339.90 0.03 106.97 0.00 0.00 0.00 0.00 md3 0.00 0.00 0.00 1739.00 0.00 6.79 8.00 0.00 0.00 0.00 0.00 root@rpopdb04g ~ # fgrep 9.4 /proc/mounts /dev/md2 /var/lib/pgsql/9.4/data ext4 rw,noatime,nodiratime,barrier=1,stripe=64,data=ordered 0 0 /dev/md3 /var/lib/pgsql/9.4/data/pg_xlog ext4 rw,noatime,nodiratime,barrier=0,stripe=64,data=ordered 0 0 root@rpopdb04g ~ # 2. The state of the startup process is changing in such a way: root@rpopdb04g ~ # while true; do ps aux | grep '[s]tartup'; sleep 1; done postgres 3316 26.6 3.2 4732052 4299260 ? Rs 18:04 8:11 postgres: startup process postgres 3316 26.6 3.2 4732052 4299260 ? Ts 18:04 8:11 postgres: startup process postgres 3316 26.6 3.2 4732052 4299260 ? Rs 18:04 8:12 postgres: startup process postgres 3316 26.6 3.2 4732052 4299260 ? Ds 18:04 8:12 postgres: startup process postgres 3316 26.6 3.2 4732052 4299260 ? Rs 18:04 8:13 postgres: startup process postgres 3316 26.6 3.2 4732052 4299260 ? Rs 18:04 8:13 postgres: startup process postgres 3316 26.6 3.2 4732052 4299260 ? Rs 18:04 8:14 postgres: startup process postgres 3316 26.6 3.2 4732052 4299260 ? Ts 18:04 8:14 postgres: startup process postgres 3316 26.6 3.2 4732052 4299260 ? Ds 18:04 8:15 postgres: startup process postgres 3316 26.6 3.2 4732052 4299260 ? Rs 18:04 8:15 postgres: startup process postgres 3316 26.7 3.2 4732052 4299260 ? Ds 18:04 8:15 postgres: startup process postgres 3316 26.7 3.2 4732052 4299260 ? Ds 18:04 8:16 postgres: startup process postgres 3316 26.7 3.2 4732052 4299260 ? Rs 18:04 8:16 postgres: startup process postgres 3316 26.7 3.2 4732052 4299260 ? Rs 18:04 8:17 postgres: startup process postgres 3316 26.7 3.2 4732052 4299260 ? Ts 18:04 8:17 postgres: startup process postgres 3316 26.7 3.2 4732052 4299260 ? Rs 18:04 8:18 postgres: startup process postgres 3316 26.7 3.2 4732052 4299260 ? Rs 18:04 8:18 postgres: startup process postgres 3316 26.7 3.2 4732052 4299260 ? Ds 18:04 8:19 postgres: startup process postgres 3316 26.8 3.2 4732052 4299260 ? Rs 18:04 8:19 postgres: startup process postgres 3316 26.8 3.2 4732052 4299260 ? Rs 18:04 8:20 postgres: startup process postgres 3316 26.8 3.2 4732052 4299260 ? Rs 18:04 8:20 postgres: startup process postgres 3316 26.8 3.2 4732052 4299260 ? Ds 18:04 8:21 postgres: startup process postgres 3316 26.8 3.2 4732052 4299260 ? Ds 18:04 8:22 postgres: startup process postgres 3316 26.8 3.2 4732052 4299260 ? Rs 18:04 8:22 postgres: startup process postgres 3316 26.8 3.2 4732052 4299260 ? Rs 18:04 8:23 postgres: startup process postgres 3316 26.9 3.2 4732052 4299260 ? Rs 18:04 8:23 postgres: startup process postgres 3316 26.9 3.2 4732052 4299260 ? Rs 18:04 8:24 postgres: startup process postgres 3316 26.9 3.2 4732052 4299260 ? Ts 18:04 8:24 postgres: startup process postgres 3316 26.9 3.2 4732052 4299260 ? Rs 18:04 8:25 postgres: startup process ^C root@rpopdb04g ~ # 3. confl* fields in pg_stat_database_conflicts are always zero during the pausing of replay. 4. The stack-traces taken with GDB are not really informative. We will recompile PostgreSQL with —enable-debug option and run it on one of our replicas if needed. Since it is a production system we would like to do it last of all. But we will do it if anybody would not give us any ideas.
We did it. Most of the backtraces (taken while replay_location was not changing) looks like that:
[Thread debugging using libthread_db enabled]
0x00007f54a71444c0 in __read_nocancel () from /lib64/libc.so.6
#0 0x00007f54a71444c0 in __read_nocancel () from /lib64/libc.so.6
#1 0x000000000065d2f5 in FileRead (file=<value optimized out>, buffer=0x7f5470e6ba20 "\004", amount=8192) at fd.c:1286
#2 0x000000000067acad in mdread (reln=<value optimized out>, forknum=<value optimized out>, blocknum=311995, buffer=0x7f5470e6ba20 "\004") at md.c:679
#3 0x0000000000659b4e in ReadBuffer_common (smgr=<value optimized out>, relpersistence=112 'p', forkNum=MAIN_FORKNUM, blockNum=311995, mode=RBM_NORMAL_NO_LOG, strategy=0x0, hit=0x7fff898a912f "") at bufmgr.c:476
#4 0x000000000065a61b in ReadBufferWithoutRelcache (rnode=..., forkNum=MAIN_FORKNUM, blockNum=311995, mode=<value optimized out>, strategy=<value optimized out>) at bufmgr.c:287
#5 0x00000000004cfb78 in XLogReadBufferExtended (rnode=..., forknum=MAIN_FORKNUM, blkno=311995, mode=RBM_NORMAL_NO_LOG) at xlogutils.c:324
#6 0x00000000004a3651 in btree_xlog_vacuum (lsn=71742288638464, record=0x1e48b78) at nbtxlog.c:522
#7 btree_redo (lsn=71742288638464, record=0x1e48b78) at nbtxlog.c:1144
#8 0x00000000004c903a in StartupXLOG () at xlog.c:6827
#9 0x000000000062f8bf in StartupProcessMain () at startup.c:224
#10 0x00000000004d3e9a in AuxiliaryProcessMain (argc=2, argv=0x7fff898a98a0) at bootstrap.c:416
#11 0x000000000062a99c in StartChildProcess (type=StartupProcess) at postmaster.c:5146
#12 0x000000000062e9e2 in PostmasterMain (argc=3, argv=<value optimized out>) at postmaster.c:1237
#13 0x00000000005c7d68 in main (argc=3, argv=0x1e22910) at main.c:228
So the problem seems to be in this part of code - http://git.postgresql.org/gitweb/?p=postgresql.git;a=blob;f=src/backend/access/nbtree/nbtxlog.c;h=5f9fc49e78ca1388ab482e24c8b5a873238ae0b6;hb=d0f83327d3739a45102fdd486947248c70e0249d#l507. I suppose, that answers the question why startup process reads a lot from disk while paused replay.
So the questions are:
1. Is there anything we can tune right now? Except for not reading from replicas and partitioning this table.
2. Isn’t there still a function to determine that a buffer is not pinned in shared_buffers without reading it from disk? To optimize current behaviour in the future.
5. In one of the experiments replay stopped on 4115/56126DC0 xlog position. Here is a bit of pg_xlogdump output:
   rpopdb04d/rpopdb M # select pg_xlogfile_name('4115/56126DC0');    pg_xlogfile_name    --------------------------     000000060000411500000056     (1 row)
     Time: 0.496 ms     rpopdb04d/rpopdb M #
   root@pg-backup04h /u0/rpopdb04/wals/0000000600004115 # /usr/pgsql-9.4/bin/pg_xlogdump 000000060000411500000056 000000060000411500000056 | fgrep 4115/56126DC0 -C10   rmgr: Heap        len (rec/tot):     36/  3948, tx: 3930143874, lsn: 4115/561226C8, prev 4115/56122698, bkp: 1000, desc: hot_update: rel 1663/16420/16737; tid 196267/4 xmax 3930143874 ; new tid 196267/10 xmax 0   rmgr: Transaction len (rec/tot):     12/    44, tx: 3930143874, lsn: 4115/56123638, prev 4115/561226C8, bkp: 0000, desc: commit: 2015-03-19 18:26:27.725158 MSK   rmgr: Heap        len (rec/tot):     58/    90, tx: 3930143875, lsn: 4115/56123668, prev 4115/56123638, bkp: 0000, desc: hot_update: rel 1663/16420/16737; tid 23624/3 xmax 3930143875 ; new tid 23624/21 xmax 0   rmgr: Transaction len (rec/tot):     12/    44, tx: 3930143875, lsn: 4115/561236C8, prev 4115/56123668, bkp: 0000, desc: commit: 2015-03-19 18:26:27.726432 MSK   rmgr: Heap        len (rec/tot):     36/  2196, tx: 3930143876, lsn: 4115/561236F8, prev 4115/561236C8, bkp: 1000, desc: hot_update: rel 1663/16420/16737; tid 123008/4 xmax 3930143876 ; new tid 123008/5 xmax 0   rmgr: Transaction len (rec/tot):     12/    44, tx: 3930143876, lsn: 4115/56123F90, prev 4115/561236F8, bkp: 0000, desc: commit: 2015-03-19 18:26:27.727088 MSK   rmgr: Heap        len (rec/tot):     36/  7108, tx: 3930143877, lsn: 4115/56123FC0, prev 4115/56123F90, bkp: 1000, desc: hot_update: rel 1663/16420/16737; tid 34815/6 xmax 3930143877 ; new tid 34815/16 xmax 0   rmgr: Transaction len (rec/tot):     12/    44, tx: 3930143877, lsn: 4115/56125BA0, prev 4115/56123FC0, bkp: 0000, desc: commit: 2015-03-19 18:26:27.728178 MSK   rmgr: Heap        len (rec/tot):     36/  4520, tx: 3930143878, lsn: 4115/56125BD0, prev 4115/56125BA0, bkp: 1000, desc: hot_update: rel 1663/16420/16737; tid 147863/5 xmax 3930143878 ; new tid 147863/16 xmax 0   rmgr: Transaction len (rec/tot):     12/    44, tx: 3930143878, lsn: 4115/56126D90, prev 4115/56125BD0, bkp: 0000, desc: commit: 2015-03-19 18:26:27.728339 MSK   rmgr: Btree       len (rec/tot):     20/    52, tx:          0, lsn: 4115/56126DC0, prev 4115/56126D90, bkp: 0000, desc: vacuum: rel 1663/16420/16796; blk 31222118, lastBlockVacuumed 0   rmgr: Heap        len (rec/tot):     36/  6112, tx: 3930143879, lsn: 4115/56126DF8, prev 4115/56126DC0, bkp: 1000, desc: hot_update: rel 1663/16420/16737; tid 23461/26 xmax 3930143879 ; new tid 23461/22 xmax 0   rmgr: Heap2       len (rec/tot):     24/  8160, tx:          0, lsn: 4115/561285F0, prev 4115/56126DF8, bkp: 1000, desc: clean: rel 1663/16420/16782; blk 21997709 remxid 0   rmgr: Transaction len (rec/tot):     12/    44, tx: 3930143879, lsn: 4115/5612A5E8, prev 4115/561285F0, bkp: 0000, desc: commit: 2015-03-19 18:26:27.728805 MSK   rmgr: Heap2       len (rec/tot):     20/  8268, tx:          0, lsn: 4115/5612A618, prev 4115/5612A5E8, bkp: 1000, desc: visible: rel 1663/16420/16782; blk 21997709   rmgr: Heap        len (rec/tot):     36/  7420, tx: 3930143880, lsn: 4115/5612C680, prev 4115/5612A618, bkp: 1000, desc: hot_update: rel 1663/16420/16737; tid 37456/8 xmax 3930143880 ; new tid 37456/29 xmax 0   rmgr: Transaction len (rec/tot):     12/    44, tx: 3930143880, lsn: 4115/5612E398, prev 4115/5612C680, bkp: 0000, desc: commit: 2015-03-19 18:26:27.729141 MSK   rmgr: Heap        len (rec/tot):     36/  7272, tx: 3930143881, lsn: 4115/5612E3C8, prev 4115/5612E398, bkp: 1000, desc: hot_update: rel 1663/16420/16737; tid 23614/2 xmax 3930143881 ; new tid 23614/22 xmax 0   rmgr: Heap        len (rec/tot):    150/   182, tx:          0, lsn: 4115/56130048, prev 4115/5612E3C8, bkp: 0000, desc: inplace: rel 1663/16420/12764; tid 11/31   rmgr: Transaction len (rec/tot):     12/    44, tx: 3930143881, lsn: 4115/56130100, prev 4115/56130048, bkp: 0000, desc: commit: 2015-03-19 18:26:27.729340 MSK   rmgr: Heap        len (rec/tot):     43/    75, tx: 3930143882, lsn: 4115/56130130, prev 4115/56130100, bkp: 0000, desc: insert: rel 1663/16420/16773; tid 10159950/26   rmgr: Btree       len (rec/tot):     42/    74, tx: 3930143882, lsn: 4115/56130180, prev 4115/56130130, bkp: 0000, desc: insert: rel 1663/16420/16800; tid 12758988/260   root@pg-backup04h /u0/rpopdb04/wals/0000000600004115 #

Any help would be really appropriate. Thanks in advance.