On Thu, Jun 18, 2020 at 6:05 PM Thomas Munro <thomas.munro@gmail.com> wrote:
> Here's a version that adds some documentation.
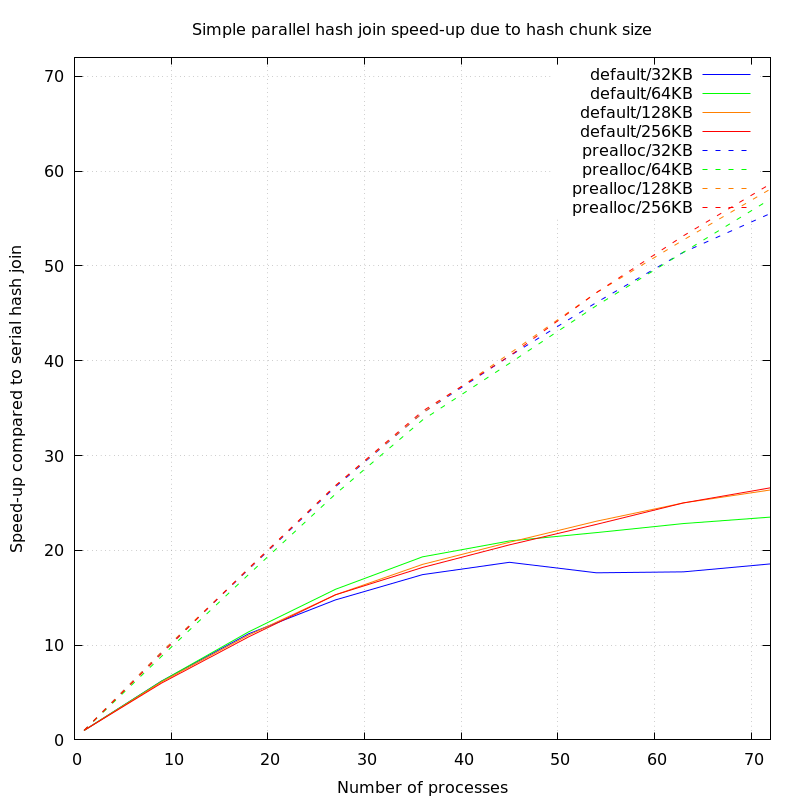
I jumped on a dual socket machine with 36 cores/72 threads and 144GB
of RAM (Azure F72s_v2) running Linux, configured with 50GB of huge
pages available, and I ran a very simple test: select count(*) from t
t1 join t t2 using (i), where the table was created with create table
t as select generate_series(1, 400000000)::int i, and then prewarmed
into 20GB of shared_buffers. I compared the default behaviour to
preallocate_dynamic_shared_memory=20GB, with work_mem set sky high so
that there would be no batching (you get a hash table of around 16GB),
and I set things up so that I could test with a range of worker
processes, and computed the speedup compared to a serial hash join.
Here's what I got:
Processes Default Preallocated
1 627.6s
9 101.3s = 6.1x 68.1s = 9.2x
18 56.1s = 11.1x 34.9s = 17.9x
27 42.5s = 14.7x 23.5s = 26.7x
36 36.0s = 17.4x 18.2s = 34.4x
45 33.5s = 18.7x 15.5s = 40.5x
54 35.6s = 17.6x 13.6s = 46.1x
63 35.4s = 17.7x 12.2s = 51.4x
72 33.8s = 18.5x 11.3s = 55.5x
It scaled nearly perfectly up to somewhere just under 36 threads, and
then the slope tapered off a bit so that each extra process was
supplying somewhere a bit over half of its potential. I can improve
the slope after the halfway point a bit by cranking HASH_CHUNK_SIZE up
to 128KB (and it doesn't get much better after that):
Processes Default Preallocated
1 627.6s
9 102.7s = 6.1x 67.7s = 9.2x
18 56.8s = 11.1x 34.8s = 18.0x
27 41.0s = 15.3x 23.4s = 26.8x
36 33.9s = 18.5x 18.2s = 34.4x
45 30.1s = 20.8x 15.4s = 40.7x
54 27.2s = 23.0x 13.3s = 47.1x
63 25.1s = 25.0x 11.9s = 52.7x
72 23.8s = 26.3x 10.8s = 58.1x
I don't claim that this is representative of any particular workload
or server configuration, but it's a good way to show that bottleneck,
and it's pretty cool to be able to run a query that previously took
over 10 minutes in 10 seconds. (I can shave a further 10% off these
times with my experimental hash join prefetching patch, but I'll
probably write about that separately when I've figured out why it's
not doing better than that...).