I wrote:
> [ slightly bogus graph ]
Ooops, it seems the ^ operator doesn't do what I thought in gnuplot.
Here's a corrected version.
regards, tom lane
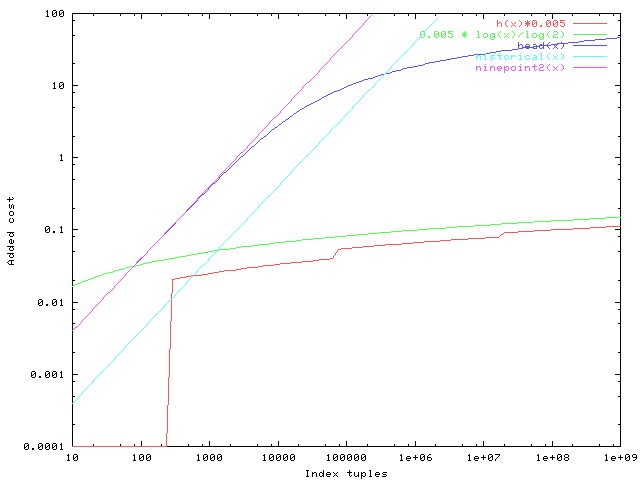
set terminal png small color
set output 'new_fudge.png'
set xlabel "Index tuples"
set ylabel "Added cost"
set logscale x
set logscale y
h(x) = (x <= 256) ? 0.0001/0.005 : (x <= 256*256) ? (1./2)*log(x)/log(2) : (x <= 256*256*256) ? (2./3)*log(x)/log(2) :
(x<= 256.0*256*256*256) ? (3./4)*log(x)/log(2) : (x <= 256.0*256*256*256*256) ? (4./5)*log(x)/log(2) :
(5./6)*log(x)/log(2)
historical(x) = (4 * x/100000) < 100 ? 4 * x/100000 : 1/0
ninepoint2(x) = (4 * x/10000) < 100 ? 4 * x/10000 : 1/0
head(x) = 4*log(1 + x/10000)
plot [10:1e9] h(x)*0.005, 0.005 * log(x)/log(2), head(x), historical(x), ninepoint2(x)