Re: BitmapHeapScan streaming read user and prelim refactoring
| От | Tomas Vondra |
|---|---|
| Тема | Re: BitmapHeapScan streaming read user and prelim refactoring |
| Дата | |
| Msg-id | 86ddff18-175b-4ae7-a039-129eaf4abe8f@enterprisedb.com обсуждение |
| Ответ на | Re: BitmapHeapScan streaming read user and prelim refactoring (Melanie Plageman <melanieplageman@gmail.com>) |
| Список | pgsql-hackers |
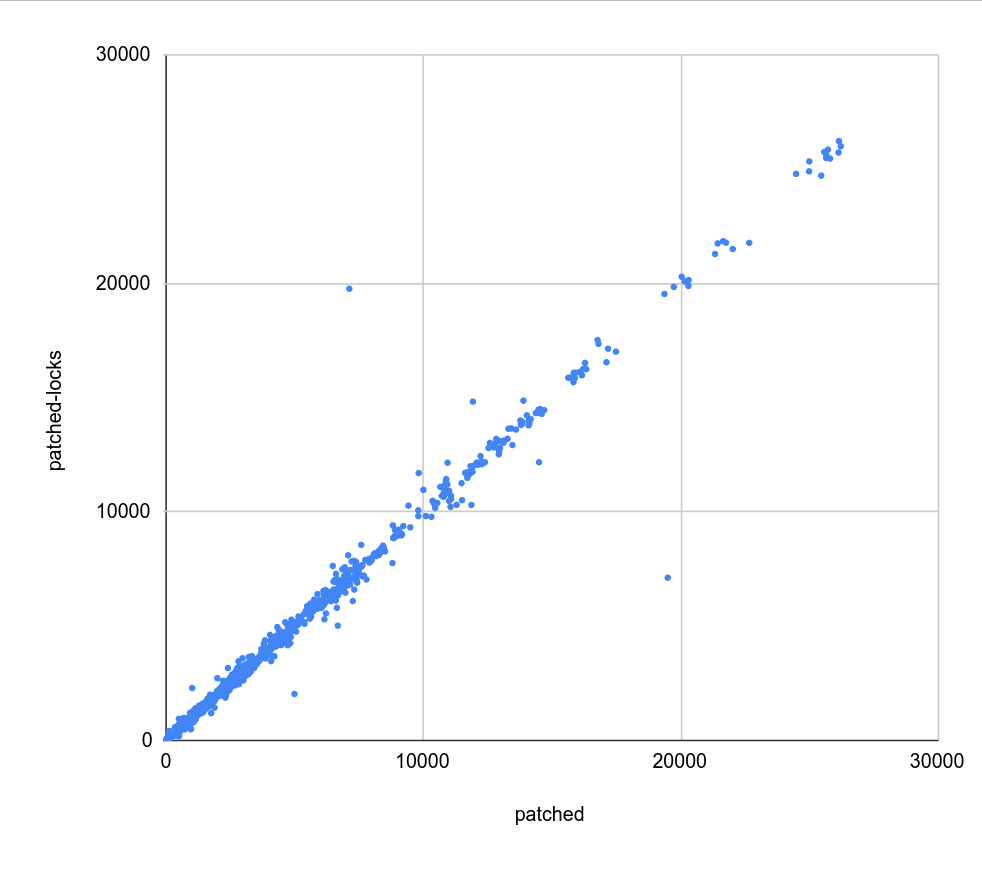
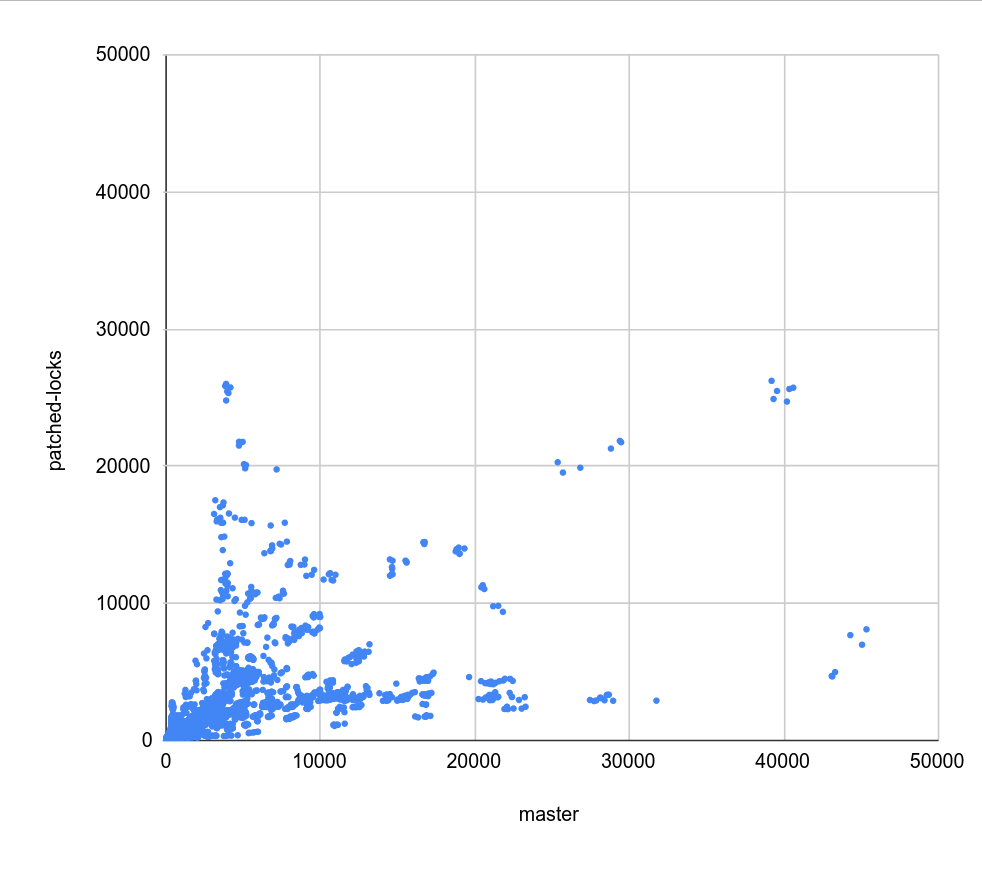
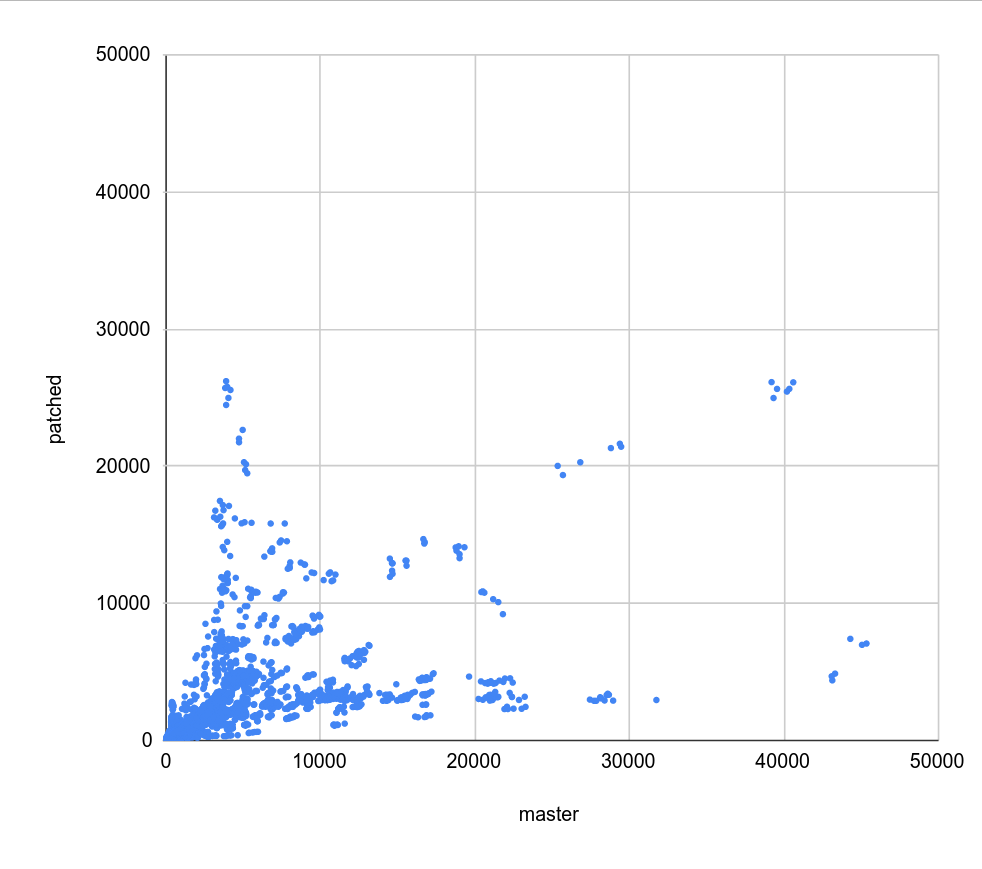
On 3/3/24 00:39, Melanie Plageman wrote:
> On Sat, Mar 2, 2024 at 5:51 PM Tomas Vondra
> <tomas.vondra@enterprisedb.com> wrote:
>>
>> On 3/2/24 23:11, Melanie Plageman wrote:
>>> On Fri, Mar 1, 2024 at 2:31 PM Melanie Plageman
>>> <melanieplageman@gmail.com> wrote:
>>>>
>>>> ...
>>>>
>>>> Hold the phone on this one. I realized why I moved
>>>> BitmapAdjustPrefetchIterator after table_scan_bitmap_next_block() in
>>>> the first place -- master calls BitmapAdjustPrefetchIterator after the
>>>> tbm_iterate() for the current block -- otherwise with eic = 1, it
>>>> considers the prefetch iterator behind the current block iterator. I'm
>>>> going to go through and figure out what order this must be done in and
>>>> fix it.
>>>
>>> So, I investigated this further, and, as far as I can tell, for
>>> parallel bitmapheapscan the timing around when workers decrement
>>> prefetch_pages causes the performance differences with patch 0010
>>> applied. It makes very little sense to me, but some of the queries I
>>> borrowed from your regression examples are up to 30% slower when this
>>> code from BitmapAdjustPrefetchIterator() is after
>>> table_scan_bitmap_next_block() instead of before it.
>>>
>>>         SpinLockAcquire(&pstate->mutex);
>>>         if (pstate->prefetch_pages > 0)
>>>             pstate->prefetch_pages--;
>>>         SpinLockRelease(&pstate->mutex);
>>>
>>> I did some stracing and did see much more time spent in futex/wait
>>> with this code after the call to table_scan_bitmap_next_block() vs
>>> before it. (table_scan_bitmap_next_block()) calls ReadBuffer()).
>>>
>>> In my branch, I've now moved only the parallel prefetch_pages-- code
>>> to before table_scan_bitmap_next_block().
>>> https://github.com/melanieplageman/postgres/tree/bhs_pgsr
>>> I'd be interested to know if you see the regressions go away with 0010
>>> applied (commit message "Make table_scan_bitmap_next_block() async
>>> friendly" and sha bfdcbfee7be8e2c461).
>>>
>>
>> I'll give this a try once the runs with MAX_BUFFERS_PER_TRANSFER=1
>> complete. But it seems really bizarre that simply moving this code a
>> little bit would cause such a regression ...
>
> Yes, it is bizarre. It also might not be a reproducible performance
> difference on the cases besides the one I was testing (cyclic dataset,
> uncached, eic=8, matches 16+, distinct=100, rows=100000000, 4 parallel
> workers). But even if it only affects that one case, it still had a
> major, reproducible performance impact to move those 5 lines before
> and after table_scan_bitmap_next_block().
>
> The same number of reads and fadvises are being issued overall.
> However, I did notice that the pread calls are skewed when the those
> lines of code are after table_scan_bitmap_next_block()  -- fewer of
> the workers are doing more of the reads. Perhaps this explains what is
> taking longer. Why those workers would end up doing more of the reads,
> I don't quite know.
>
> - Melanie


I do have some numbers with e44505ce179e442bd50664c85a31a1805e13514a,
and I don't see any such effect - it performs pretty much exactly like
the v6 patches.

I used a slightly different visualization, plotting the timings on a
scatter plot, so values on diagonal mean "same performance" while values
above/below mean speedup/slowdown.

This is a bit more compact than the tables with color scales, and it
makes it harder (impossible) to see patterns (e.g. changes depending on
eic). But for evaluating if there's a shift overall it still works, and
it also shows clusters. So more a complementary & simpler visualization.

There are three charts

1) master-patched.png - master vs. v6 patches
2) master-locks.png - master vs. e44505ce
3) patched-locks.png - v6 patches vs. e44505ce

There's virtually no difference between (1) and (2) - same pattern of
regressions and speedups, almost as a copy. That's confirmed by (3)
where pretty much all values are exactly on the diagonal, with only a
couple outliers.

I'm not sure why you see a 30% difference with the change. I wonder if
that might be due to some issue in the environment? Are you running in a
VM, or something like that?

regards

--
Tomas Vondra
EnterpriseDB: http://www.enterprisedb.com
The Enterprise PostgreSQL Company
Вложения
В списке pgsql-hackers по дате отправления: