Re: SLRUs in the main buffer pool, redux
| От | Konstantin Knizhnik |
|---|---|
| Тема | Re: SLRUs in the main buffer pool, redux |
| Дата | |
| Msg-id | 7a0fc7e5-ecbb-317c-53a2-f64d7a0ca986@garret.ru обсуждение исходный текст |
| Ответ на | Re: SLRUs in the main buffer pool, redux (Thomas Munro <thomas.munro@gmail.com>) |
| Ответы |
Re: SLRUs in the main buffer pool, redux
(Robert Haas <robertmhaas@gmail.com>)
|
| Список | pgsql-hackers |
On 28.05.2022 04:13, Thomas Munro wrote:
On Fri, May 27, 2022 at 11:24 PM Thomas Munro <thomas.munro@gmail.com> wrote:Rebased, debugged and fleshed out a tiny bit more, but still with plenty of TODO notes and questions. I will talk about this idea at PGCon, so I figured it'd help to have a patch that actually applies, even if it doesn't work quite right yet. It's quite a large patch but that's partly because it removes a lot of lines...FWIW, here are my PGCon slides about this: https://speakerdeck.com/macdice/improving-the-slru-subsystem There was a little bit of discussion on #pgcon-stream2 which I could summarise as: can we figure out a way to keep parts of the CLOG pinned so that backends don't have to do that for each lookup? Then CLOG checks become simple reads. There may be some relation to the idea of 'nailing' btree root pages that I've heard of from a couple of people now (with ProcSignalBarrier or something more fine grained along those lines if you need to unnail anything). Something to think about. I'm also wondering if it would be possible to do "optimistic" pinning instead for reads that normally need only a pin, using some kind of counter scheme with read barriers to tell you if the page might have been evicted after you read the data...
I wonder if there are some tests which can illustrate advantages of storing SLRU pages in shared buffers?
In PgPro we had a customer which run PL-PgSql code with recursively called function containing exception handling code. Each exception block creates subtransaction
and subxids SLRU becomes bottleneck.
I have simulated this workload with large number subxids using the following function:
create or replace function do_update(id integer, level integer) returns void as $$
begin
begin
if level > 0 then
perform do_update(id, level-1);
else
update pgbench_accounts SET abalance = abalance + 1 WHERE aid = id;
end if;
exception WHEN OTHERS THEN
raise notice '% %', SQLERRM, SQLSTATE;
end;
end; $$ language plpgsql;
With the following test script:
\set aid random(1, 1000)
select do_update(:aid,100)
\set aid random(1, 1000)
select do_update(:aid,100)
I got the following results:
pgbench (15beta1)
starting vacuum...end.
progress: 1.0 s, 3030.8 tps, lat 3.238 ms stddev 1.110, 0 failed
progress: 2.0 s, 3018.0 tps, lat 3.303 ms stddev 1.088, 0 failed
progress: 3.0 s, 3000.4 tps, lat 3.329 ms stddev 1.063, 0 failed
progress: 4.0 s, 2855.6 tps, lat 3.494 ms stddev 1.152, 0 failed
progress: 5.0 s, 2747.0 tps, lat 3.631 ms stddev 1.306, 0 failed
progress: 6.0 s, 2664.0 tps, lat 3.743 ms stddev 1.410, 0 failed
progress: 7.0 s, 2498.0 tps, lat 3.992 ms stddev 1.659, 0 failed
...
progress: 93.0 s, 670.0 tps, lat 14.964 ms stddev 10.555, 0 failed
progress: 94.0 s, 615.0 tps, lat 16.222 ms stddev 11.419, 0 failed
progress: 95.0 s, 580.0 tps, lat 17.251 ms stddev 11.622, 0 failed
progress: 96.0 s, 568.0 tps, lat 17.582 ms stddev 11.679, 0 failed
progress: 97.0 s, 573.0 tps, lat 17.389 ms stddev 11.771, 0 failed
progress: 98.0 s, 611.0 tps, lat 16.428 ms stddev 11.768, 0 failed
progress: 99.0 s, 568.0 tps, lat 17.622 ms stddev 11.912, 0 failed
progress: 100.0 s, 568.0 tps, lat 17.631 ms stddev 11.672, 0 failed
tps = 1035.566054 (without initial connection time)
With Thomas patch results are the following:
progress: 1.0 s, 2949.8 tps, lat 3.332 ms stddev 1.285, 0 failed
progress: 2.0 s, 3009.1 tps, lat 3.317 ms stddev 1.077, 0 failed
progress: 3.0 s, 2993.6 tps, lat 3.338 ms stddev 1.099, 0 failed
progress: 4.0 s, 3034.4 tps, lat 3.291 ms stddev 1.056, 0 failed
...
progress: 97.0 s, 1113.0 tps, lat 8.972 ms stddev 3.885, 0 failed
progress: 98.0 s, 1138.0 tps, lat 8.803 ms stddev 3.496, 0 failed
progress: 99.0 s, 1174.8 tps, lat 8.471 ms stddev 3.875, 0 failed
progress: 100.0 s, 1094.1 tps, lat 9.123 ms stddev 3.842, 0 failed
tps = 2133.240094 (without initial connection time)
So there is still degrade of performance but smaller than in case of vanilla and total TPS are almost two times higher.
And this is another example demonstrating degrade of performance from presentation by Alexander Korotkov:
pgbench script:
\set aid random(1, 100000 * :scale)
\set bid random(1, 1 * :scale)
\set tid random(1, 10 * :scale)
\set delta random(-5000, 5000)
BEGIN;
INSERT INTO pgbench_history (tid, bid, aid, delta, mtime)
VALUES (:tid, :bid, :aid, :delta, CURRENT_TIMESTAMP);
SAVEPOINT s1;
INSERT INTO pgbench_history (tid, bid, aid, delta, mtime)
VALUES (:tid, :bid, :aid, :delta, CURRENT_TIMESTAMP);
....
SAVEPOINT sN;
INSERT INTO pgbench_history (tid, bid, aid, delta, mtime)
VALUES (:tid, :bid, :aid, :delta, CURRENT_TIMESTAMP);
SELECT pg_sleep(1.0);
END;
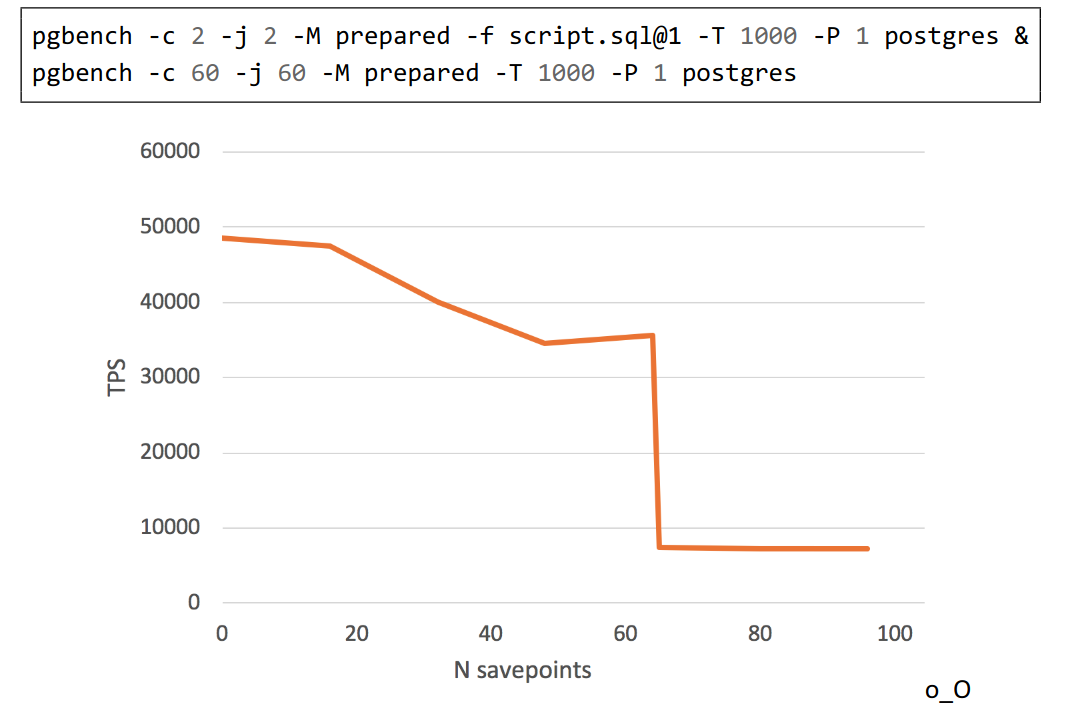
I wonder which workload can cause CLOG to become a bottleneck?
Usually Postgres uses hint bits to avoid clog access. So standard pgbench doesn't demonstrate any degrade of performance even in case of presence of long living transactions,
which keeps XMIN horizon.
Вложения
В списке pgsql-hackers по дате отправления:
Предыдущее
От: Mark DilgerДата:
Сообщение: Re: Modest proposal to extend TableAM API for controlling cluster commands