Excessive WAL generation and related performance issue
| От | Joe Conway |
|---|---|
| Тема | Excessive WAL generation and related performance issue |
| Дата | |
| Msg-id | 534C540F.4030905@joeconway.com обсуждение исходный текст |
| Ответы |
Re: Excessive WAL generation and related performance issue
|
| Список | pgsql-hackers |
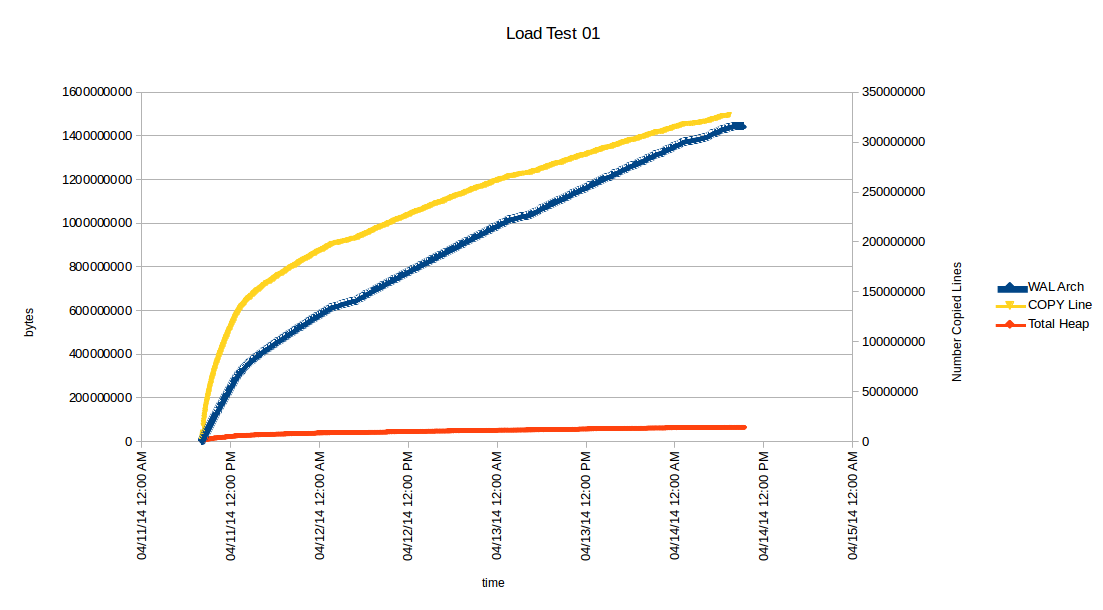
-----BEGIN PGP SIGNED MESSAGE-----
Hash: SHA1

I have run into a situation where bulk loading a table with fairly
narrow rows and two indexes causes WAL to be generated at about 20:1
or higher ratio to the actual heap data (table plus indexes).

There are 560 million loaded rows which ultimately produce a table of
about 50 GB and indexes consuming about 75 GB for a grand total of 125
GB table+index heap size. This generates over 3 TB of WAL. The loading
progresses fairly fast at first and then drops off sharply so that the
load takes 4 plus days on production hardware. Near the end of the
load the heap grows very slowly -- measured in tens of MBs per hour.

I have reproduced the case on a test machine like so:

create table foo
( pid varchar(11) not null, sprid varchar(5) not null, cid varchar(11) not null, csdt date not null, pcind char(1) not
null,cedt date, csnum int2 not null default 767, rcd char(2) not null default '99'::bpchar, rrind char(1) not null
default'K'::bpchar, its timestamp not null default now(), luts timestamp not null default now(), primary key
(pid,sprid,cid,csdt,rcd)
);
create index fooidx on foo(cid,pid);

- -- creates 77GB file for test load
copy
( select  (id % 2604380)::text,  (id % 30)::text,  (id % 7906790)::text,  now() - ((id % 8777)::text || '
days')::interval, (id % 3)::text,  now() - ((id % 6351)::text || ' days')::interval,  (id % 5)::int2,  (id % 27)::text,
(id % 2)::text,  now() - ((id % 16922)::text || ' seconds')::interval,  now() - ((id % 27124)::text || '
seconds')::intervalfrom generate_series(10000000000,10000000000 + 559245675) as g(id)

) to '/home/postgres/foo.dump';


grep -E "^($|#|\s.*#?)" -v $PGDATA/postgresql.conf
max_connections = 1200
superuser_reserved_connections = 30
shared_buffers = 12288MB
work_mem = 8MB
maintenance_work_mem = 128MB
wal_level = hot_standbyhot_standby
checkpoint_segments = 96
checkpoint_timeout = 10min
checkpoint_completion_target = 0.7
archive_mode = on
archive_command = 'cp -i %p /home/postgres/archive/%f </dev/null'
max_wal_senders = 5
wal_keep_segments = 256
log_line_prefix = '%m;'

psql --echo-all \    --single-transaction \    --set ON_ERROR_STOP=on \    --dbname=test \
--file=/home/postgres/foo.dump

I had to kill it at just over half way done because I ran out of disk
space for WAL. This chart shows the growth of heap and WAL against
number of rows copied over time (I added an elog LOG to get messages
during XlogInsert).
 http://www.joeconway.com/presentations/test01.png

Also worth noting is that once this thing gets going, using "perf top"
I could see XLogInsert consuming 20-40% of all cycles, and the vast
majority of that was going into the CRC calculation.


I realize there are many things that can be done to improve my
specific scenario, e.g. drop indexes before loading, change various
configs, etc. My purpose for this post is to ask if it is really
expected to get over 20 times as much WAL as heap data?

Oh, and this is all on postgres 9.2.latest. I have not yet tried to
reproduce on git master but intend to do so.

Thoughts?

Thanks,

Joe


- --
Joe Conway
credativ LLC: http://www.credativ.us
Linux, PostgreSQL, and general Open Source
Training, Service, Consulting, & 24x7 Support
-----BEGIN PGP SIGNATURE-----
Version: GnuPG v1.4.14 (GNU/Linux)
Comment: Using GnuPG with Thunderbird - http://www.enigmail.net/

iQIcBAEBAgAGBQJTTFQPAAoJEDfy90M199hlO+cP/jthKJJqkNMyVwWADHjZaeOC
4fgYSPvEGi8y2AtRZwBIKMWSVhCKbwZ+ZLdpUk3jJ1eIPOvxTAlbdf/haXctRDHv
ZLgs6uBSihbG2guijkxnMtSPjXql6WKmai+UncuGGcsqHvEwvnqIGdr7eg5Rd+c4
Q0b36DhoadKVJEwT3qWGfUXxcpkQIG5hgh39GOhQtL7xW+Tf6odLrep0/lmiNCaz
9eIcbVCzc8cIG8jGugSsGGHo1UA/s5A0aEd3mx5ZnroHjUvEWdHuTNY7ijXs6pqk
ynSHSJtDikTGVxJlj68nv/wGtHN0+xbsci/qv0sTZfOUh8mwfkBZAiOEyzK6lDcc
cxzafqAkFIpIL9cDPyhxWbSOI8LAqXfRGTiM5rsguX4iCuf3SEYl48f6sZ9CW3Jt
zNDlns2BZKKWWx88H/EL84sajo/SJS0Ml+9ppmV3TpA4zHHfiEpn3Rg4/Nsj0qzj
H/kx2UwSXA7iQiQ860gL+EggN0MmVcN+/KOAAg/9cJ4DL8TiVTv/vn5Rspv19Hu1
A12tWnioxGaFsuPAjtZCpxHPUOD3jUUSEJEAYJTCW3eJ7a6SPgAIq3eGE0Fj4v00
RWsCVhqydteuvB59MSAvtA06MHfer/fDvOK2rquY/HnOtwwdPkGG7QZ21lyfhdH1
UKo0u4OmvQuHJsiT7Z2W
=xxw3
-----END PGP SIGNATURE-----
В списке pgsql-hackers по дате отправления: