Backport of fsync queue compaction
| От | Greg Smith |
|---|---|
| Тема | Backport of fsync queue compaction |
| Дата | |
| Msg-id | 4FE0F03D.5080209@2ndQuadrant.com обсуждение исходный текст |
| Ответы |
Re: Backport of fsync queue compaction
Re: Backport of fsync queue compaction |
| Список | pgsql-hackers |
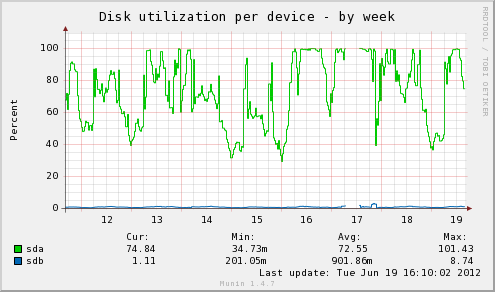
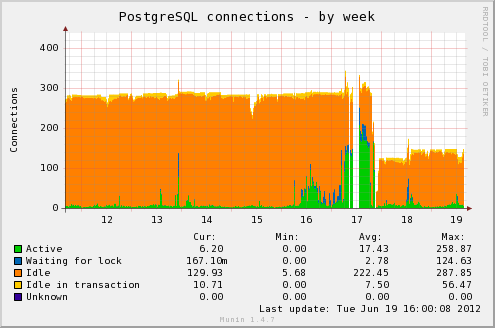
In January of 2011 Robert committed
7f242d880b5b5d9642675517466d31373961cf98 to try and compact the fsync
queue when clients find it full.  There's no visible behavior change,
just a substantial performance boost possible in the rare but extremely
bad situations where the background writer stops doing fsync absorption.
  I've been running that in production at multiple locations since
practically the day it hit this mailing list, with backports all the way
to 8.3 being common (and straightforward to construct).  I've never seen
a hint of a problem with this new code.

I'm running into this more lately, in even worse forms than the report
that kicked that investigation off.  I wanted to share two of those, and
raise the idea of backporting this fix to an uncommon but very bad
situation.  I see this as similar to the O(n^2) DROP issues.  Not that
many people will run into the issue, but the systems impacted really
suffer from it.  And this one can result in significant downtime for the
server.  The attached graphs show how bad the latest example I ran into
was.  The holes were effectively downtime even though the server stayed
running, because performance was too slow to be useful.

Sample bad checkpoint from the downtime on the 17th:

2012-06-17 14:48:13 EDT LOG:  checkpoint complete: wrote 90 buffers
(0.1%); 0 transaction log file(s) added, 0 removed, 14 recycled;
write=26.531 s, sync=4371.513 s, total=4461.058 s

That's over an hour for a checkpoint that only wrote out 720K of buffers!

I used to think this was a terabyte scale problem--first three instances
I saw were that size--and therefore not worth worrying too much about.
This latest example happened with only a 200GB database though, on a
server with 96GB of RAM.  That's the reason I think this is a big enough
risk to consider a mitigation backport now.  The chance of running into
this is much higher than I originally pegged it at.

At the terabyte level, though, this can turn extremely nasty.  Here's my
worst example yet, from a different system altogether than any I've
mentioned yet (I don't have graphs for this one I can share, just the
quite anonymous log data):

2011-07-12 09:02:18.875 BST LOG:  checkpoint complete: wrote 98888
buffers (9.4%); 0 transaction log file(s) added, 510 removed, 257
recycled; write=385.612 s, sync=9852.170 s, total=10246.452 s

2011-07-12 14:48:51.762 BST 30673 LOG:  checkpoint complete: wrote 73101
buffers (7.0%); 0 transaction log file(s) added, 479 removed, 257
recycled; write=1789.793 s, sync=18994.602 s, total=20792.612 s

2011-07-12 18:02:25.722 BST 30673 LOG:  checkpoint complete: wrote
141563 buffers (13.5%); 0 transaction log file(s) added, 1109 removed,
257 recycled; write=944.601 s, sync=10635.130 s, total=11613.953 s

That site was effectively down an entire day while stuck in just these
three checkpoints, with the middle one taking 5 hours to complete.  The
spike in pg_xlog disk usage was pretty nasty as well.

It seems pretty possible for any site with the following characteristics
to run into this at some point:

-Either heavy writes or autovacuum can pump lots into the OS write
cache.  In the example with the graphs, the worst periods involved >4GB
of dirty memory in the OS cache.  That's how the setup for this type of
failure starts, with lots of random writes queued up.

-Periods where disk I/O can hit 100% on the database drive.  Oon the
disk utilization graph, you can see that's the case on the main database
drive (sda); it's stuck at 100% busy doing I/O during the downtime.

-Constant stream of incoming requests, such that a significant slowdown
in query processing will lead to a negative feedback loop on the number
of active queries.  Connection graph attached showing how that plays
out, the large number of idle connections are coming from Tomcat/JDBC
pooling.

--
Greg Smith   2ndQuadrant US    greg@2ndQuadrant.com   Baltimore, MD
PostgreSQL Training, Services, and 24x7 Support www.2ndQuadrant.com
Вложения
В списке pgsql-hackers по дате отправления: