Single client performance on trivial SELECTs
| От | Greg Smith |
|---|---|
| Тема | Single client performance on trivial SELECTs |
| Дата | |
| Msg-id | 4DA69D60.4000108@2ndquadrant.com обсуждение исходный текст |
| Ответы |
Re: Single client performance on trivial SELECTs
Re: Single client performance on trivial SELECTs |
| Список | pgsql-hackers |
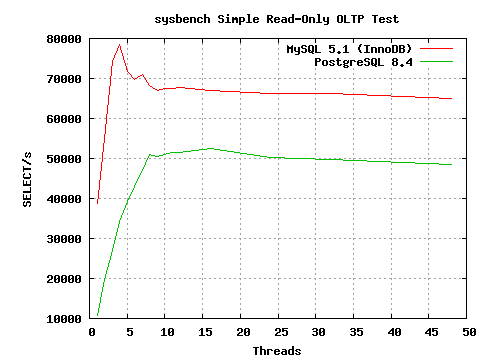
This week several list regulars here waded into the MySQL Convention.  I
decided to revisit PostgreSQL vs. MySQL performance using the sysbench
program as part of that.  It's not important to what I'm going to
describe to understand exactly what statements sysbench runs here or how
to use it, but if anyone is curious I've got some more details about how
I ran the tests in my talk slides at
http://projects.2ndquadrant.com/talks  The program has recently gone
through some fixes that make it run a bit better both in general and
against PostgreSQL.  The write tests are still broken against
PostgreSQL, but it now seems to do a reasonable job simulating a simple
SELECT-only workload.  A fix from Jignesh recently made its way into the
database generation side of the code that makes it less tedious to test
with it too.

The interesting part was how per-client scaling compared between the two
databases; graph attached.  On my 8 core server, PostgreSQL scales
nicely up to a steady 50K TPS.  I see the same curve, almost identical
numbers, with PostgreSQL and pgbench--no reason to suspect sysbench is
doing anything shady.  The version of MySQL I used hits around 67K TPS
with innodb when busy with lots of clients.  That part doesn't bother
me; nobody expects PostgreSQL to be faster on trivial SELECT statements
and the gap isn't that big.

The shocking part was the single client results.  I'm using to seeing
Postgres get around 7K TPS per core on those, which was the case here,
and I never considered that an interesting limitation to think about
before.  MySQL turns out to hit 38K TPS doing the same work.  Now that's
a gap interesting enough to make me wonder what's going on.

Easy enough to exercise the same sort of single client test case with
pgbench and put it under a profiler:

sudo opcontrol --init
sudo opcontrol --setup --no-vmlinux
createdb pgbench
pgbench -i -s 10 pgbench
psql -d pgbench -c "vacuum"
sudo opcontrol --start
sudo opcontrol --reset
pgbench -S -n -c 1 -T 60 pgbench
sudo opcontrol --dump ; sudo opcontrol --shutdown
opreport -l image:$HOME/pgwork/inst/test/bin/postgres

Here's the top calls, from my laptop rather than the server that I
generated the graph against.  It does around 5.5K TPS with 1 clients and
10K with 2 clients, so same basic scaling:

samples  %        image name               symbol name
53548     6.7609  postgres                 AllocSetAlloc
32787     4.1396  postgres                 MemoryContextAllocZeroAligned
26330     3.3244  postgres                 base_yyparse
21723     2.7427  postgres                 hash_search_with_hash_value
20831     2.6301  postgres                 SearchCatCache
19094     2.4108  postgres                 hash_seq_search
18402     2.3234  postgres                 hash_any
15975     2.0170  postgres                 AllocSetFreeIndex
14205     1.7935  postgres                 _bt_compare
13370     1.6881  postgres                 core_yylex
10455     1.3200  postgres                 MemoryContextAlloc
10330     1.3042  postgres                 LockAcquireExtended
10197     1.2875  postgres                 ScanKeywordLookup
9312      1.1757  postgres                 MemoryContextAllocZero

I don't know nearly enough about the memory allocator to comment on
whether it's possible to optimize it better for this case to relieve any
bottleneck.  Might just get a small gain then push the limiter to the
parser or hash functions.  I was surprised to find that's where so much
of the time was going though.

P.S. When showing this graph in my talk, I pointed out that anyone who
is making decisions about which database to use based on trivial SELECTs
on small databases isn't going to be choosing between PostgreSQL and
MySQL anyway--they'll be deploying something like MongoDB instead if
that's the important metric.

--
Greg Smith   2ndQuadrant US    greg@2ndQuadrant.com   Baltimore, MD
PostgreSQL Training, Services, and 24x7 Support  www.2ndQuadrant.us
Вложения
В списке pgsql-hackers по дате отправления: