Checkpoint distribution
| От | Borodin Vladimir |
|---|---|
| Тема | Checkpoint distribution |
| Дата | |
| Msg-id | 4AF2BEEF-5BB5-4155-BF70-D3E877914061@simply.name обсуждение исходный текст |
| Ответы |
Re: Checkpoint distribution
|
| Список | pgsql-performance |
Hi all.
--
I’m running PostgreSQL 9.3.4 and doing stress test of the database with writing only load. The test plan does 1000 transactions per second (each of them does several updates/inserts). The problem is that checkpoint is not distributed over time well. When the checkpoint finishes, the db gets lots of I/O operations and response timings grows strongly.
My checkpoint settings looks like that:
postgres=# select name, setting from pg_catalog.pg_settings where name like 'checkpoint%' and boot_val != reset_val;
name | setting
------------------------------+---------
checkpoint_completion_target | 0.9
checkpoint_segments | 100500
checkpoint_timeout | 600
(3 rows)
postgres=#
But in the log I see that checkpoint continues less than 600*0.9 = 540 seconds:
2014-04-14 12:54:41.479 MSK,,,10517,,53468da6.2915,433,,2014-04-10 16:25:10 MSK,,0,LOG,00000,"checkpoint starting: time",,,,,,,,,""
2014-04-14 12:57:06.107 MSK,,,10517,,53468da6.2915,434,,2014-04-10 16:25:10 MSK,,0,LOG,00000,"checkpoint complete: wrote 65140 buffers (24.8%); 0 transaction log file(s) added, 0 removed, 327 recycled; write=134.217 s, sync=10.292 s, total=144.627 s; sync files=31, longest=3.332 s, average=0.331 s",,,,,,,,,»"
When the checkpoint starts (12:54:41.479) dstat says that I/O load increases:
----system---- -dsk/total- --io/total-
date/time | read writ| read writ
14-04 12:54:39| 0 15M| 0 2562
14-04 12:54:40| 0 13M| 0 2330
14-04 12:54:41| 0 97M| 0 5981
14-04 12:54:42| 0 95M| 0 8869
14-04 12:54:43| 0 147M| 0 8493
14-04 12:54:44| 0 144M| 0 8316
14-04 12:54:45| 0 176M| 0 8189
14-04 12:54:46| 0 141M| 0 8221
14-04 12:54:47| 0 143M| 0 8260
14-04 12:54:48| 0 141M| 0 7576
14-04 12:54:49| 0 173M| 0 8171
But when it finishes (12:57:06.107) the I/O load is much higher than the hardware can do:
----system---- -dsk/total- --io/total-
date/time | read writ| read writ
14-04 12:56:52| 0 33M| 0 5185
14-04 12:56:53| 0 64M| 0 5271
14-04 12:56:54| 0 65M| 0 5256
14-04 12:56:55| 0 153M| 0 15.8k
14-04 12:56:56| 0 758M| 0 18.6k
14-04 12:56:57| 0 823M| 0 4164
14-04 12:56:58| 0 843M| 0 8186
14-04 12:56:59| 0 794M| 0 15.0k
14-04 12:57:00| 0 880M| 0 5954
14-04 12:57:01| 0 862M| 0 4608
14-04 12:57:02| 0 804M| 0 7387
14-04 12:57:03| 0 849M| 0 4878
14-04 12:57:04| 0 788M| 0 20.0k
14-04 12:57:05| 0 805M| 0 6004
14-04 12:57:06| 0 143M| 0 6932
14-04 12:57:07| 0 108M| 0 6150
14-04 12:57:08| 0 42M| 0 6233
14-04 12:57:09| 0 73M| 0 6248
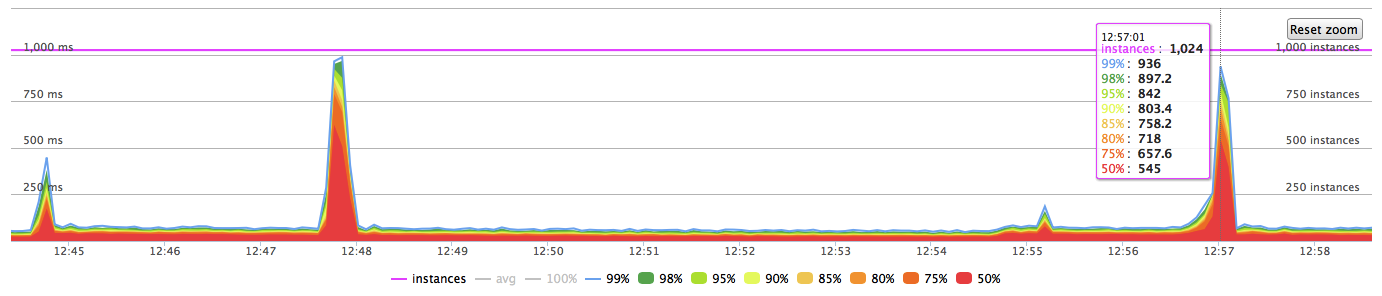
Response timings of the application at this moment look like that:
The hardware is quite good to handle this load (PGDATA lives on soft raid10 array of 8 ssd drives). I’ve done the same test with 3000 tps - the result was exactly the same. The only difference was that I/O spikes had been stronger.
So my question is why the checkpoint is not spread for 540 seconds? Is there any way to understand why I/O spike happens when the checkpoint finishes but does not happen during all of the checkpoint process? Any help would be really appropriate.
--
Vladimir
Вложения
В списке pgsql-performance по дате отправления: