Memory leak from ExecutorState context?
| От | Jehan-Guillaume de Rorthais |
|---|---|
| Тема | Memory leak from ExecutorState context? |
| Дата | |
| Msg-id | 20230228190643.1e368315@karst обсуждение |
| Ответы |
Re: Memory leak from ExecutorState context?
Re: Memory leak from ExecutorState context? |
| Список | pgsql-hackers |
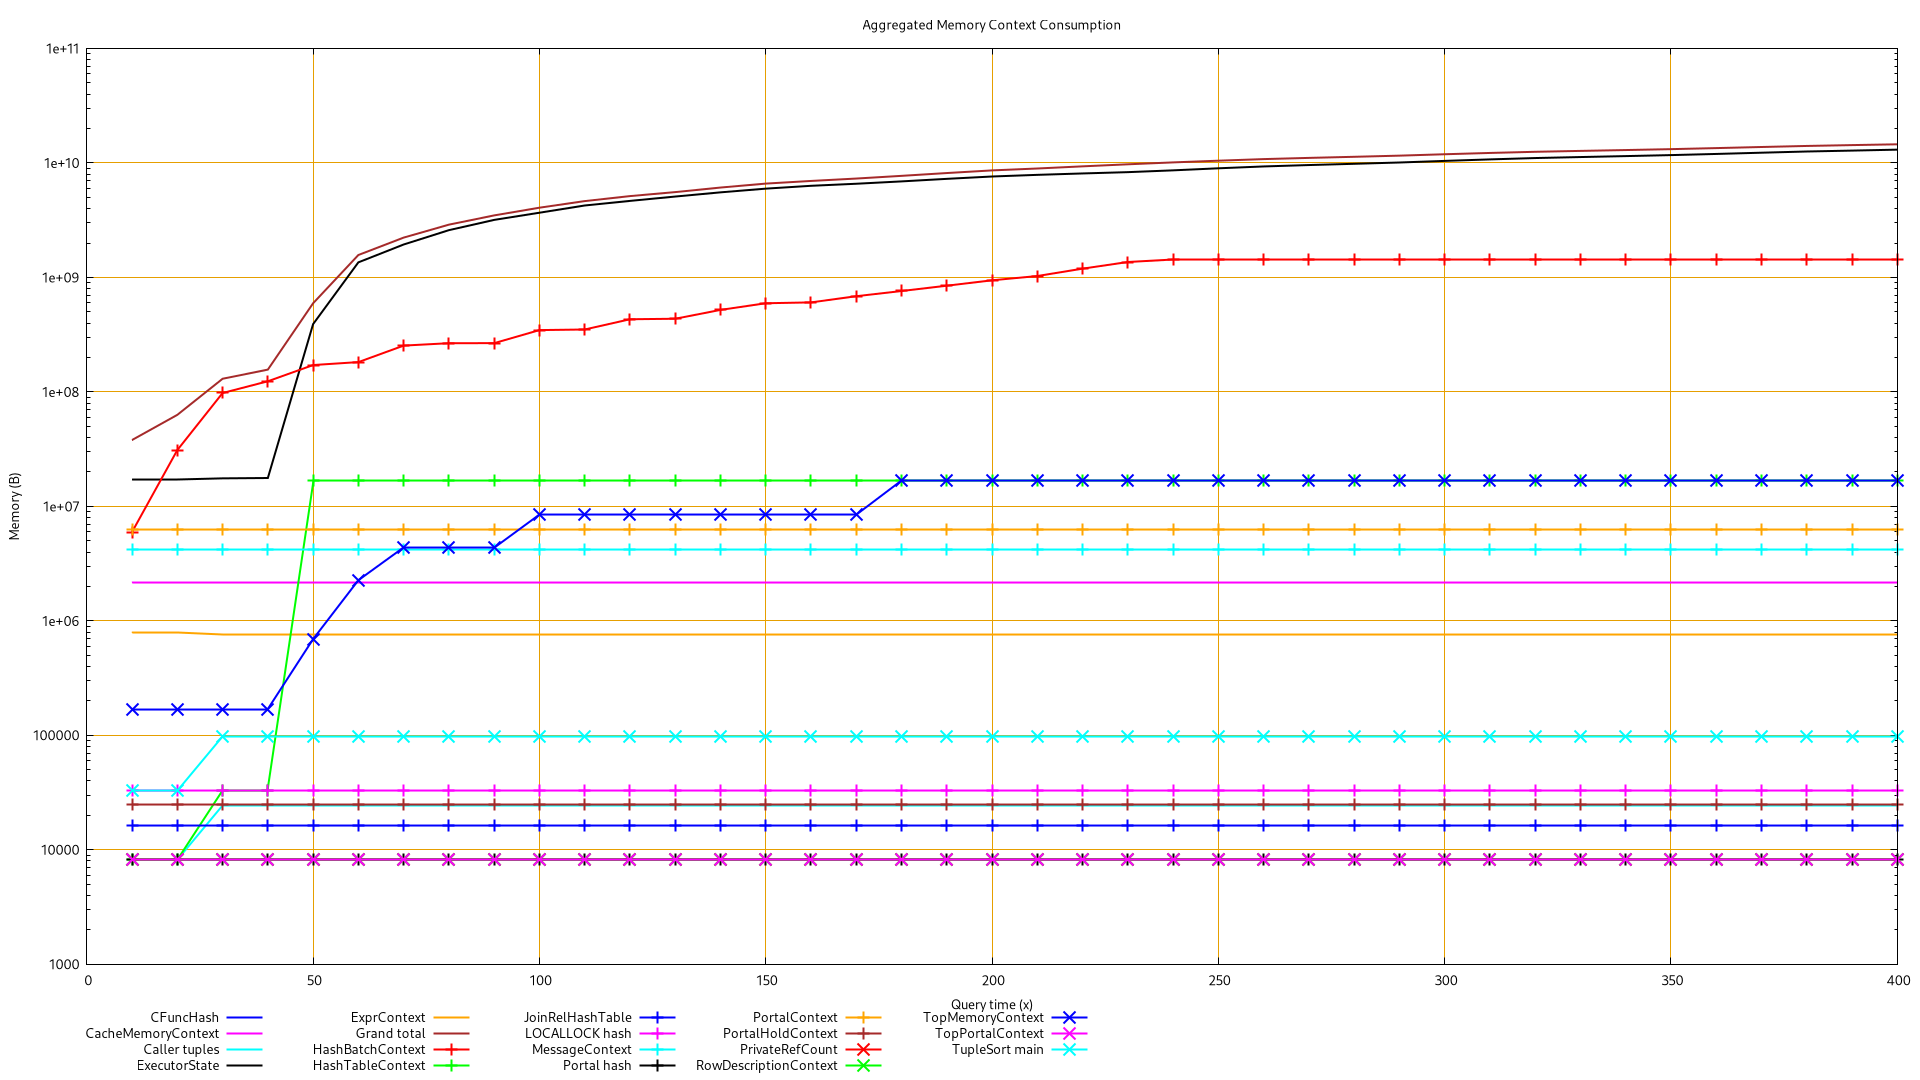
Hello all,

A customer is facing out of memory query which looks similar to this situation:

  https://www.postgresql.org/message-id/flat/12064.1555298699%40sss.pgh.pa.us#eb519865575bbc549007878a5fb7219b

This PostgreSQL version is 11.18. Some settings:

* shared_buffers: 8GB
* work_mem: 64MB
* effective_cache_size: 24GB
* random/seq_page_cost are by default
* physical memory: 32GB

The query is really large and actually update kind of a materialized view.

The customer records the plans of this query on a regular basis. The explain
analyze of this query before running out of memory was:

  https://explain.depesz.com/s/sGOH

The customer is aware he should rewrite this query to optimize it, but it's a
long time process he can not start immediately. To make it run in the meantime,
he actually removed the top CTE to a dedicated table. According to their
experience, it's not the first time they had to split a query this way to make
it work.

I've been able to run this query on a standby myself.  I've "call
MemoryContextStats(TopMemoryContext)" every 10s on a run, see the data parsed
(best view with "less -S") and the graph associated with it in attachment. It
shows:

* HashBatchContext goes up to 1441MB after 240s then stay flat until the end
  (400s as the last record)
* ALL other context are stable before 240s, but ExecutorState
* ExecutorState keeps rising up to 13GB with no interruption until the memory
  exhaustion

I did another run with interactive gdb session (see the messy log session in
attachment, for what it worth). Looking at some backtraces during the memory
inflation close to the end of the query, all of them were having these frames in
common:

  [...]
  #6  0x0000000000621ffc in ExecHashJoinImpl (parallel=false, pstate=0x31a3378)
  at nodeHashjoin.c:398 [...]

...which is not really helpful but at least, it seems to come from a hash join
node or some other hash related code. See the gdb session log for more details.
After the out of mem, pmap of this process shows:

  430:   postgres: postgres <dbname> [local] EXPLAIN
  Address           Kbytes     RSS   Dirty Mode  Mapping
  [...]
  0000000002c5e000 13719620 8062376 8062376 rw---   [ anon ]
  [...]

Is it usual a backend is requesting such large memory size (13 GB) and
actually use less of 60% of it (7.7GB of RSS)?

Sadly, the database is 1.5TB large and I can not test on a newer major version.
I did not try to check how large would be the required data set to reproduce
this, but it moves 10s of million of rows from multiple tables anyway...

Any idea? How could I help to have a better idea if a leak is actually
occurring and where exactly?

Regards,
Вложения
В списке pgsql-hackers по дате отправления: