full-text search with GiST indexes seems to be getting slower since 9.1
| От | Tomas Vondra |
|---|---|
| Тема | full-text search with GiST indexes seems to be getting slower since 9.1 |
| Дата | |
| Msg-id | 20200502223649.5nm22aw3n3kqrell@development обсуждение |
| Ответы |
Re: full-text search with GiST indexes seems to be getting slower since 9.1
|
| Список | pgsql-hackers |
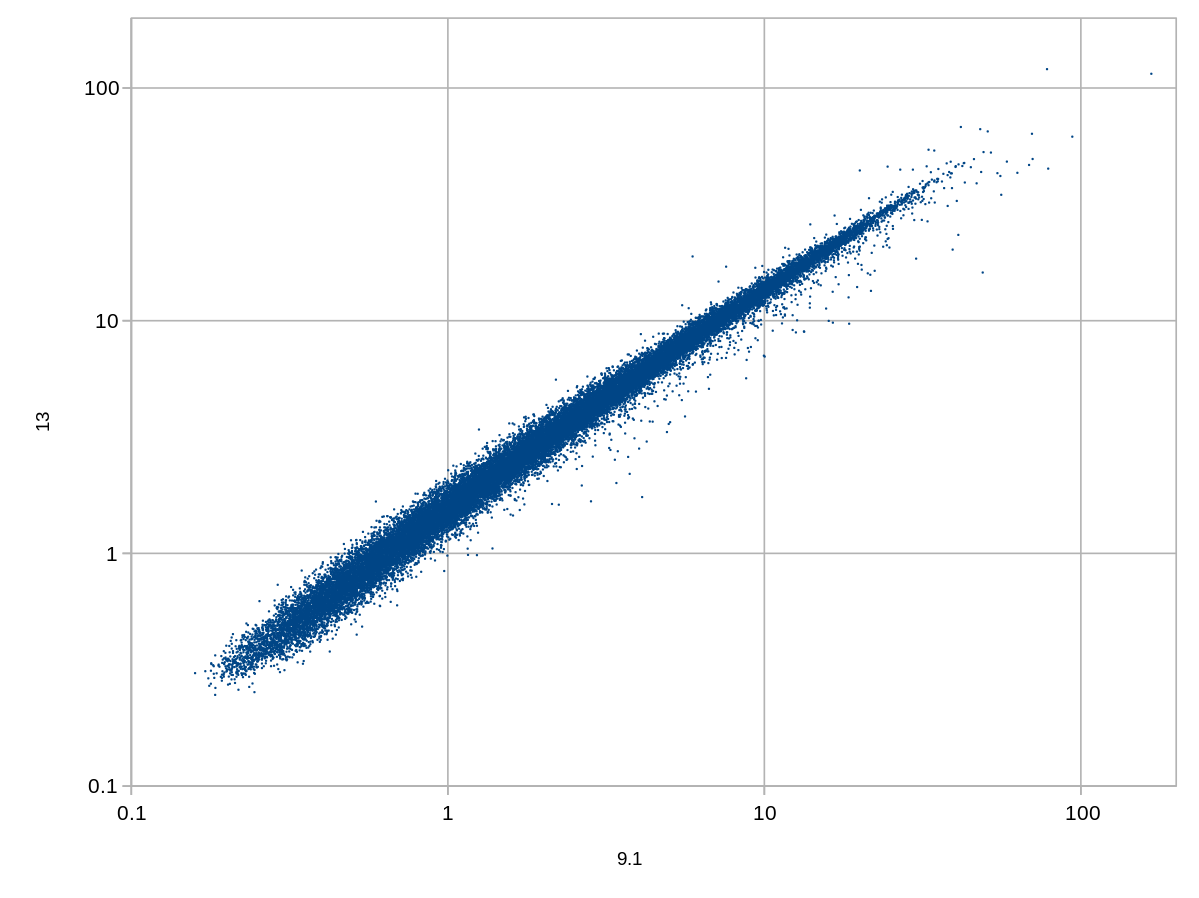
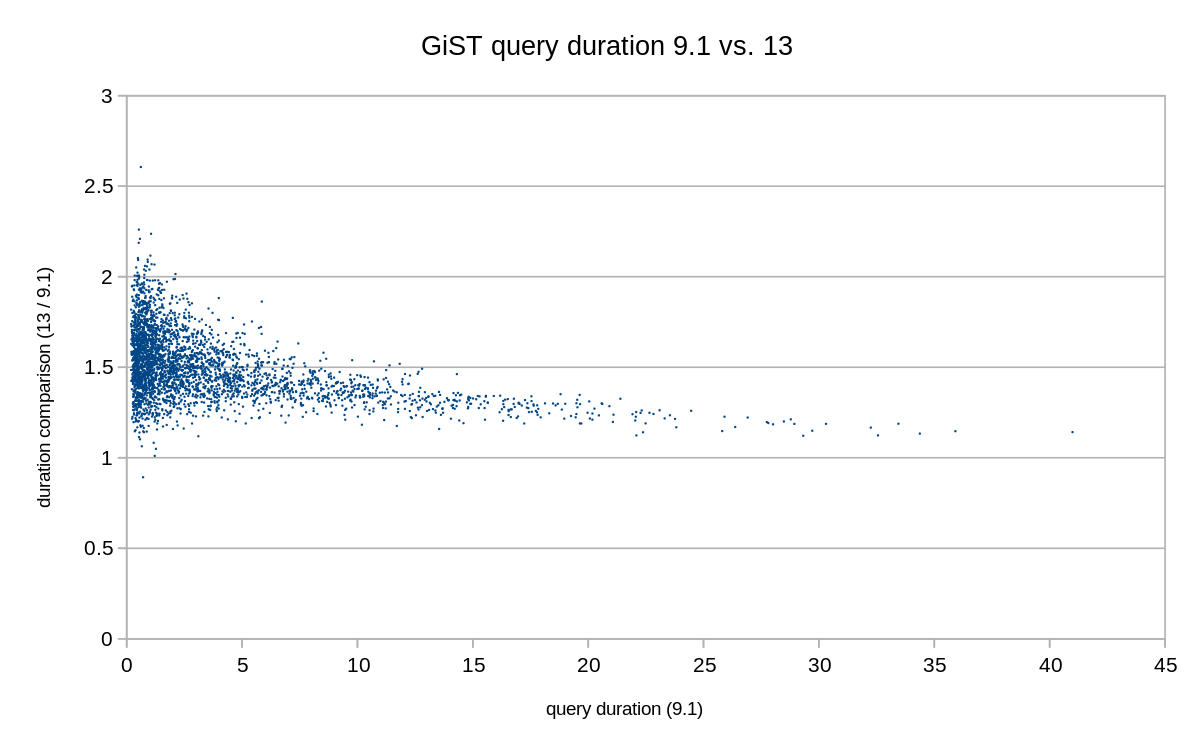
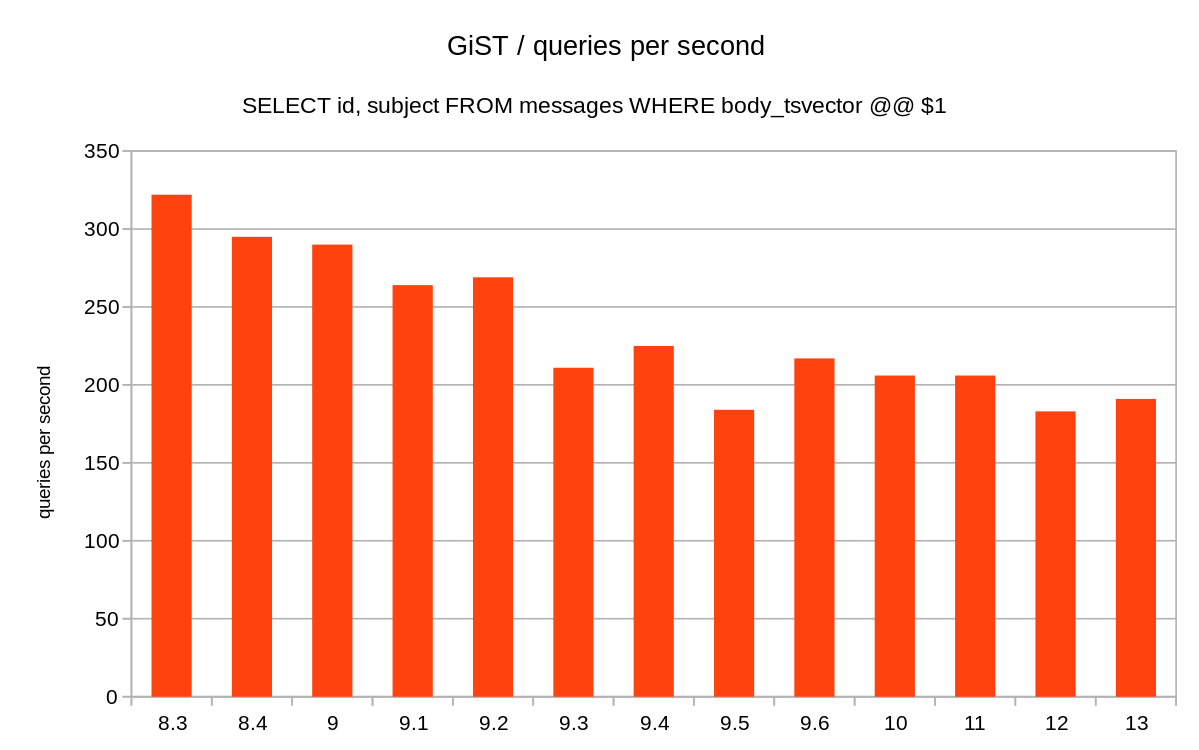
Hi,

over the past couple of weeks I've been running various benchmarks with
the intent to demonstrate how the performance evolved since ~8.3. In
most tests we're doing pretty good, but I've noticed that full-text
search using GiST indexes is an annoying exception - it's getting slower
and slower since ~9.1.

I've been investigating it a bit, but I still don't have any idea what
might be causing this. So perhaps someone else might have an idea ...


The benchmark is not anything special - it simply loads all our mailing
list archives into a table, computes tsvectors from message bodies, and
then an index on the tsvectors. And then it runs ~33k tsqueries that
people were actually searching at our archives (I got this years ago
from someone, I don't recall the details). IMO it's a fairly realistic
benchmark, not something entirely made up.

Attached is a couple of charts illustrating the regression.

The machine is not particularly beefy (4 cores, 8GB of RAM, SSDs) but
it's the same for all the tests. The postgresql.conf was modified a bit,
nothing beyond basic typical tuning.


1) gist-91-vs-13-queries-per-second.png

This shows the throughput since 8.3, where we've been doing ~314 tps,
while now we're doing only about ~200 tps. In 9.1 we did about 270 tps,
and that's the number I'll use for comparisons because queries against
9.0 and older versions are returning fewer results, so and the index on
message body is much lower. So clearly something changed in 9.1, either
in how we compute the tsvector or something. Since 9.1 it seems pretty
stable, though. The main drop seems to happened between 9.2 and 9.3.

Note: All the durations (in all charts) are in milliseconds.


2) gist-large-91-vs-13.png

This plots durations of all 33k queries, comparing duration on 9.1
(x-axis) to 13 (y-axis). The diagonal means same duration on both
versions, anything above it means the query got slower. It's pretty
clear the queries are consistently slower, but the chart is log-scale so
it's not obvious what the slowdown is.


3) gist-large-91-vs-13-slowdown.png

This is a different view on the query durations, plotting 9.1 duration
on x-axis vs. (duration on 13 / duration on 9.1) on y-axis. So for
example 1.5 means the query on 13 takes about 1.5x longer than on 9.1.

The chart seems to say the slowdown is pretty consistent, about 50% for
the shortest queries and then gradually improving for longer ones. This
seems far too consistent to be noise, and the timings are actually
averages of 5 runs for each query (and it seems quite consistent).


I doubt this is merely due to changes in binary layout, or something to
do with compiler. The difference is a bit too high for that (the drop
from 270 to 200 is about 25%), and it seems to affect all versions since
9.3 about the same. Everything was built using the same gcc version
(9.2.0).  Only --enable-debug was used, everything else is the same.
There seem to be some minor variation in final CFLAGS, though.

I've done some basic profiling using perf, but I don't see anything
obvious in the profiles (attached).

I kept the data directories, so I can do additional test if needed.


regards

--
Tomas Vondra                  http://www.2ndQuadrant.com
PostgreSQL Development, 24x7 Support, Remote DBA, Training & Services
Вложения
В списке pgsql-hackers по дате отправления: