"Guillaume Smet" <guillaume.smet@gmail.com> writes:
> Here are some rough results:
> http://people.openwide.fr/~gsmet/postgresql/postgresql_8.3_development_cycle_1.png
I repeated this experiment using the "pgbench -n -S -c 10 -t 100000 bench"
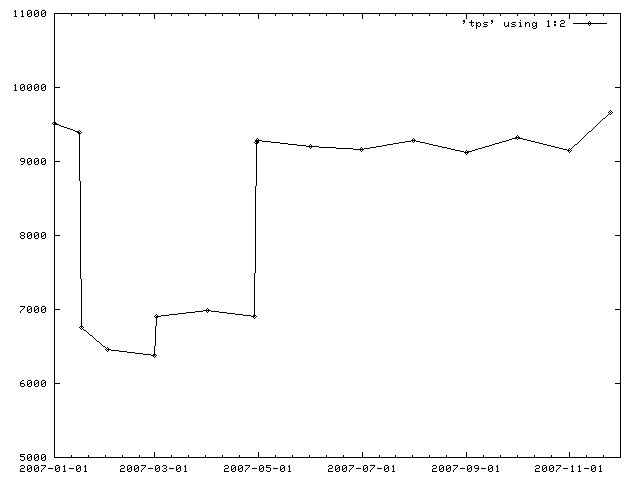
test case that I've been looking at. The attached graph shows reported
TPS for CVS pulls from first-of-the-month dates and dates bracketing
selected interesting changes. Here's the raw data being plotted:
2007-01-01 9512.306699
2007-01-16 9388.317681
2007-01-17 6756.486634
2007-02-01 6457.403152
2007-03-01 6379.643242
2007-03-02 6907.368329
2007-04-01 6989.332803
2007-04-29 6908.091429
2007-04-30 9252.289116
2007-05-01 9290.111548
2007-06-01 9199.813641
2007-07-01 9162.253476
2007-08-01 9281.821046
2007-09-01 9123.663541
2007-10-01 9322.775762
2007-11-01 9148.342301
2007-11-25 9663.446883
The TPS numbers bounce around by 1% or so on repeated trials, so I
wouldn't put too much faith in small differences. What it looks like
to me is that it's all about the stats collection overhead. The drop on
01-17 corresponds to autovac and stats_row_level being turned on by
default. The improvement on 03-02 is the fix for the problem that the
stats collector process wanted to write the stats file way too often,
and the improvement on 04-30 comes from rate-limiting stats messages
from individual backends to the stats collector.
It might be interesting to deconstruct what else happened between 01-17
and 03-01, but I think that the other month-to-month variances are
probably within the noise threshold.
regards, tom lane